Page 1 :
Prof. Tirup Parmar, , UNIT I, Overview of Computer Graphics, What are Computer Graphics?, , Today there are very few aspects of our lives not affected by computers. Practically every cash, or monetary transaction that takes place daily involves a computer. In many cases, the same is, true of computer graphics. Whether you see them on television, in newspapers, in weather, reports or while at the doctor’s surgery, computer images are all around you., “A picture is worth a thousand words” is a well-known saying and highlights the advantages and, benefits of the visual presentation of our data. We are able to obtain a comprehensive overall, view of our data and also study features and areas of particular interest., A well-chosen graph is able to transform a complex table of numbers into meaningful results., Such graphs are used to illustrate papers, reports and theses, as well as providing the basis for, presentation material in the form of slides and overhead transparencies., Computer graphics are pictures and movies created using computers - usually referring to image data, created by a computer specifically with help from specialized graphical hardware and software. It is a vast, and recent area in computer science. The phrase was coined by computer graphics researchers Verne, Hudson and William Fetter of Boeing in 1960. Another name for the field is computer-generated imagery,, or simply CGI, Computer graphics are visual representations of data displayed on a monitor made on a computer., Computer graphics can be a series of images (most often called video) or a single image., Video Lectures @ https://www.youtube.com/TirupParmar & Notes @ https://t.me/bscit, , https://E-next.in, , Page 3
Page 2 :
Prof. Tirup Parmar, Computer graphics are very useful. Computer-generated imagery is used for movie making, video game, and computer program development, scientific modeling, and design for catalogs and other commercial, art. Some people even make computer graphics as art., Computer graphics can be 2D or 3D. They are made differently and used differently. People use, different computer programs to make different types of graphics, 2D graphics, 2D computer graphics are usually split into two categories: vector graphics and raster graphics., , Video Lectures @ https://www.youtube.com/TirupParmar & Notes @ https://t.me/bscit, , https://E-next.in, , Page 4
Page 3 :
Prof. Tirup Parmar, , What Are Vector & Raster Graphics?, , Are you new to the world of graphic design? Don’t worry, we’ve been there. Let’s start with the, basics. To start, there are two categories of graphics you should know about: vector graphics and, raster (or bitmap) graphics., , Vector graphics use mathematical equations to draw out your designs. These mathematical, equations are translated into points that are connected by either lines or curves, also known as, vector paths, and they make up all the different shapes you see in a vector graphic., This allows vector graphics to be scaled to any size without sacrificing image quality as well as, maintain a small file size. Common vector file formats are .svg, .cgm, .odg, .eps, and .xml., , Video Lectures @ https://www.youtube.com/TirupParmar & Notes @ https://t.me/bscit, , https://E-next.in, , Page 5
Page 5 :
Prof. Tirup Parmar, Raster (or bitmap) graphics are made up of tiny squares called pixels. Once a raster, graphic is created at a certain size (i.e. a fixed number of pixels), it can’t be scaled up without, losing image quality. The larger the amount of pixels in an image, the larger the file size – they, are positively correlated since the computer needs to store information on every single pixel., Widely used raster file formats are .jpg, .png, .gif, .bmp, and .tiff., , Figure: Raster Scan System, Raster graphic editors are optimal for digital photograph editing because raster graphics are able, to portray better color depth. Each pixel can be any one of the 16 million different colors, available. But if you’re not working with digital photographs, Vector graphics editors would be, your best bet for all other types of design editing, especially because vector graphics are able to, be scaled and manipulated at any size with clarity., It’s also important to take file size into consideration. If a smaller file size is what you’re looking, for, stick with vector graphics. Raster image files can be quite large.since the computer needs to, remember information about every single pixel. Choosing a graphic type depends on what type, of design you’re creating., Video Lectures @ https://www.youtube.com/TirupParmar & Notes @ https://t.me/bscit, , https://E-next.in, , Page 7
Page 6 :
Prof. Tirup Parmar, , Base of, Difference, Electron Beam, Resolution, , Raster Scan System, , Random ( Vector ) Scan, System, , The electron beam is swept across the, screen, one row at a time, from top to, bottom., Its resolution is poor because raster, system in contrast produces zig-zag lines, that are plotted as discrete point sets., , The electron beam is directed only to, the parts of screen where a picture is, to be drawn., Its resolution is good because this, system produces smooth lines, drawings because CRT beam directly, follows the line path., Picture definition is stored as a set of, line drawing instructions in a display, file., , Picture, Definition, , Picture definition is stored as a set of, intensity values for all screen points,, called pixels in a refresh buffer area., , Realistic, Display, , The capability of this system to store, intensity values for pixel makes it well, suited for the realistic display of scenes, contain shadow and color pattern., , Draw an Image Screen points/pixels are used to draw an, Cost, Line Drawing, Refresh Rate, , image., It is less expensive than Random Scan, System., Zig – Zag line is produced because, plotted value are discrete., , These systems are designed for linedrawing and can’t display realistic, shaded scenes., Mathematical functions are used to, draw an image., It is Costlier than Raster Scan System., , Smooth line is produced because, directly the line path is followed by, electron beam, Refresh rate is 60 to 80 frame per second. Refresh Rate depends on the number, of lines to be displayed i.e 30 to 60, times per second., , Video Lectures @ https://www.youtube.com/TirupParmar & Notes @ https://t.me/bscit, , https://E-next.in, , Page 8
Page 7 :
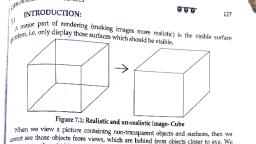
Prof. Tirup Parmar, 3D graphics, 3D graphics are graphics that look like objects because they are three-dimensional. This means the, computer thinks it has a height, a length, and a depth, and displays them as this. Some programs used to, make 3D graphics are Bryce, 3D Studio Max, Maya and Blender, and 3D graphics are used many times in, movies and TV shows and video games., , Pixel: Short for Picture Element, a pixel is a single point in a graphic image. Graphics monitors display, pictures by dividing the display screen into thousands (or millions) of pixels, arranged in rows and, columns. The pixels are so close together that they appear connected., The number of bits used to represent each pixel determines how many colors or shades of gray, can be displayed. For example, in 8-bit color mode, the color monitor uses 8 bits for each pixel, making it, possible to display 2 to the 8th power (256) different colors or shades of gray., , Persistence: The major difference between phosphors is their persistence. It decides how long they, continue to emit light after the electron beam is removed. Persistence is defined as the time it takes the, emitted light from the screen to decay to one-tenth of its original intensity. Lower persistence phosphors, require higher refreshing rates to maintain a picture on the screen without flicker. However it is useful for, displaying animations. On the other hand higher persistence phosphors are useful for displaying static and, highly complex pictures, , Resolution: For graphics monitors, the screen resolution signifies the number of dots (pixels) on the, entire screen, expressed in terms of the number of pixels on the horizontal axis and the number on the, vertical axis. Some common resolutions are:, CGA (Color Graphics Adapter): 320 x 200, EGA (Enhanced Graphics Adapter): 640 x 350, VGA (Video Graphics Array): 640 x 480, SVGA (Super VGA): 800 x 600, XGA (Enhanced Graphics Array): 1024 x 768, 720p: 1280 x 720, 1080p: 1920 x 1080, , Aspect Ratio: The aspect ratio of a geometric shape is the ratio of its sizes in different dimensions., For example, the aspect ratio of a rectangle is the ratio of its longer side to its shorter side - the ratio of, width to height when the rectangle is oriented as a "landscape"., The aspect ratio is expressed as two numbers separated by a colon ( x : y ). The values x and y do, not represent actual width and height but, rather, the "relation" between width and height. As an example,, 8:5, 16:10 and 1.6:1 are the same aspect ratio. An aspect ratio of 4:5 means that a vertical line plotted, with four points has the same length as a horizontal line plotted with five points, , Video Lectures @ https://www.youtube.com/TirupParmar & Notes @ https://t.me/bscit, , https://E-next.in, , Page 9
Page 8 :
Prof. Tirup Parmar, , Computer Graphics Application and Software, Q- Application of Computer Graphics, Computer-Aided Design for engineering and architectural systems etc., Objects maybe displayed in a wireframe outline form. Multi-window environment is also, favored for producing various zooming scales and views. Animations are useful for, testing performance., Presentation Graphics, To produce illustrations which summarize various kinds of data. Except 2D, 3D graphics, are good tools for reporting more complex data., Computer Art, Painting packages are available. With cordless, pressure-sensitive stylus, artists can, produce electronic paintings which simulate different brush strokes, brush widths, and, colors. Photorealistic techniques, morphing and animations are very useful in commercial, art. For films, 24 frames per second are required. For video monitor, 30 frames per, second are required., Entertainment, Motion pictures, Music videos, and TV shows, Computer games, Education and Training, Training with computer-generated models of specialized systems such as the training of, ship captains and aircraft pilots., Visualization, For analyzing scientific, engineering, medical and business data or behavior. Converting, data to visual form can help to understand mass volume of data very efficiently., Image Processing, Image processing is to apply techniques to modify or interpret existing pictures. It is, widely used in medical applications., Graphical User Interface, Multiple window, icons, menus allow a computer setup to be utilized more efficiently, , What is Graphics Software?, Graphics Software has a pretty broad definition in many people's minds, but in the context of this, site, it is any kind of software which can be used to create, edit, and manage 2D computer, graphics. These computer graphics may be clip art, Web graphics, logos, headings,, backgrounds, digital photos, or other kinds of digital images., Some of the graphics software titles covered on this site include:, Video Lectures @ https://www.youtube.com/TirupParmar & Notes @ https://t.me/bscit, , https://E-next.in, , Page 10
Page 9 :
Prof. Tirup Parmar, , , , , , , , , , , , Photoshop, Illustrator, Paint Shop Pro, CorelDRAW, The Apple Photos plugins from Macphun, Adobe Lightroom, Digital Image Suite, Canva, Picasa, and many more., , 3D Modeling and CAD (computer-aided design) software is also graphics software, but these are, very specialized applications which are best covered under the respective topics for the industries, in which they are used. For example, 3D graphics software is often used in animation, and CAD, software is often used in architecture and engineering., Motion graphics have their own unique qualities, and though we do touch on this kind of, graphics software on this site, it is covered in more detail in the About.comAnimation and, Desktop Video topics. Then again, you will be surprised to discover a lot of graphics, applications are able to do just that., Another software category that we cover is graphics software you can use on your smartphone or, tablet., Inspiration can hit anywhere, at any time. Thus your smartphone or tablet can be used to modify, a photo you have just taken, wireframe a web site you are working on, sketch out an idea you, have or anything else that heeds the call of your creative muse. best of all these mobile apps let, you answer the call anywhere from your local coffee shop to a picnic table in a local park., , WHAT ISN'T GRAPHICS SOFTWARE?, There is a lot of software that some people think of as graphics software because you use it to, work with graphics, but technically it is not because you don't use it for directly manipulating, images. Here are some examples of software that people think of as graphics software, but aren't, covered on this site:, , , , , Page layout software such as InDesign, QuarkXpress, and Publisher., Presentation software such as PowerPoint or Apple Keynote., Home publishing or creative printing software ., , WHAT ARE THE TYPES OF GRAPHICS SOFTWARE?, There are two main categories of graphics software and many smaller categories of specialized, tools. The two main categories are pixel-based image editors, and vector-based image editors., , Video Lectures @ https://www.youtube.com/TirupParmar & Notes @ https://t.me/bscit, , https://E-next.in, , Page 11
Page 10 :
Prof. Tirup Parmar, , , About the Two Types of Graphics Software, , Some of the categories of specialized tools are:, , , , , , , Image Management Software, Image Viewers, Batch Processing Tools, Web and Animation Software, Diagramming Software, , WHAT IS GRAPHICS SOFTWARE USED FOR?, Graphics software is used in many facets of life and business. Some of the common things, people use graphics software for include: editing and sharing digital photos, creating logos,, drawing and modifying clip art, creating digital fine art, creating Web graphics, designing, advertisements and product packaging, touching up scanned photos, and drawing maps or other, diagrams., There are the unconventional uses as well such as editing video in Photoshop or 3D drawing in, Illustrator. As well a whole new class of software is emerging. It is prototyping software where, graphic designers create the design and interactive prototypes for apps or web pages that will be, destined for smartphones ,tablets and desktops. We look at all of that as well., In fact practically everything you see on paper or a screen has been touched by Graphics, Software., Since you have arrived on this site, you may have something in mind that you want to do using, graphics software.We have a rather extensive list o techniques, tips and tutorials showing you, how to it. Head on over to the Find Software category for lots of resources to help you find the, best graphics software to fit your needs and budget., , 3DStudio Max, The successor to 3DStudio 3.0. 3DStudio Max runs under WindowsNT. It is entirely object, oriented, featuring new improvments such as volumetric lighting, spacewarps, and an all new, redesigned inteface., , 3DStudio, 3DStudio is a 3D computer graphics program. 3DStudio runs on PC's. It is relativly easy to use., Many schools and small time production studios use 3DStudio to satisfy their needs. 3DStudio is, created by AutoDesk. 3DStudio consists of a 2D modeler in which shapes can be drawn, a 3D, Lofter, in which 2D shapes can be extruded, twisted, or solidified to created 3D objects. Then, there is a 3D modelet in which a scene is created. Finally there is a animator in which key frames, , Video Lectures @ https://www.youtube.com/TirupParmar & Notes @ https://t.me/bscit, , https://E-next.in, , Page 12
Page 11 :
Prof. Tirup Parmar, are assigned to create an animation and a material editor in which a great veriety of textures can, be created. Overall this is a great program., , LightWave3D, LightWave 3D is another high end PC 3D computer graphics software package. Originally, developed for the Amiga platform, LightWave 3D is now also avilable on the PC. LightWave 3D, is used in quite a few television productions such as Babylon 5 and SeaQuest. Many people, debate that LightWave3D is the best 3D product for the PC., , Adobe Photoshop, Although Adobe Photoshop is not a computer animation application, it is one of the top of the, line graphics programs. It is created by Adobe. Photoshop runs both on Mac's and PC Windows,, and even on SGI's. It can be used to touch up digitized images or to create graphics from scratch., , Adobe Premiere, Adobe Premier, just like the name says, is created by Adobe. It is a tool used to composite, digitized video, stills, and apply a veriety of transitions and special effects. Adobe Premiere runs, both on Macintoshes and PC Windows., , Animator Studio, Animator Studio is a cell animation program from AutoDesk. It's predecessor was Animator Pro, for PC DOS. Animator Studio runs under Windows. It has a multitude of features that minimize, the animation creation time., , Strata Studio Pro, Strata Studio Pro is probably the most known 3D graphics application on the Mac. It is created, by Strata Inc. Strata Studio Pro is mainly a still graphic rendering application, but it does have, animation capabilities. Graphics for some games such as Myst were created in Strata Studio Pro., , What is a Graphics Device?, A graphics device is something where you can make a plot appear, A window on your computer (screen device), A PDF file (file device), A PNG or JPEG file (file device), A scalable vector graphics (SVG) file (file device), When you make a plot in R, it has to be “sent” to a specific graphics device, The most common place for a plot to be “sent” is the screen device, On a Mac the screen device is launched with the quartz(), On Windows the screen device is launched with windows(), , , , On Unix/Linux the screen device is launched with x11(), , Video Lectures @ https://www.youtube.com/TirupParmar & Notes @ https://t.me/bscit, , https://E-next.in, , Page 13
Page 12 :
Prof. Tirup Parmar, When making a plot, you need to consider how the plot will be used to determine what device, the plot should be sent to, , Description of some Graphics Devices:, Data output through graphic devices on computer systems is made possible through, techniques that use video generation modules to display images. This differs from text mode, output, for which the computer generates horizontal lines of alphanumeric symbols. Although, the technical requirements of both systems overlap, graphic devices use an approach that, assumes that every dot on the screen is separately accessible. By contrast, in text mode, the, smallest screen element is actually a group of points that together all define a character—a letter,, a numeral, or a punctuation mark., A graphic display is composed of a screen or panel that is made up of a large number of, small cells or dots that are called pixels . These pixels emit light when they are struck by a beam, of electrons and switched on. At any one instant, the computer hardware can switch some pixels, on fully so that they emit light, skip over others so that they remain dark, and prompt still others, to emit an intermediate measure of light. In this way the representation of a picture can be, displayed on a graphic device using every pixel as a separate component in the image., Graphic devices are output devices, but their physical characteristics restrict them from, taking data as represented in the computer's memory and displaying the data directly. Instead,, they require the assistance of a special device to translate data into electrical signals that are, compatible with the display hardware. These devices are called graphics controllers., One way that data can be formulated for display by the computer is through a technique, known as a bitmapped display or "raster-scan display." Using this approach, the computer, contains an area of memory that holds all the data that are to be displayed. The central processor, writes data into this region of memory and the video controller collects them from there. The bits, of data stored in this block of memory are related to the eventual pattern of pixels that will be, used to construct an image on the display., , Examples of Computer Graphics Devices:, , Video Lectures @ https://www.youtube.com/TirupParmar & Notes @ https://t.me/bscit, , https://E-next.in, , Page 14
Page 13 :
Prof. Tirup Parmar, CRT, EGA(Enhanced Graphic Adapter)/CGA/VGA/SVGA monitors, plotters, data matrix, laser, printers, Films, flat panel devices, Video Digitizers, scanners, LCD Panels, keyboard, joystick,, mouse, touch screen, track ball, etc., The most commonly used display device is the CRT Monitor, , Components of an Interactive Graphics System, • Graphics Hardware, - Graphics Input and Storage devices, - Graphics Display devices, • Graphics Software, - General Programming packages, - Special-purpose applications packages, , Figure: Components of a typical interactive graphics system, , Video Lectures @ https://www.youtube.com/TirupParmar & Notes @ https://t.me/bscit, , https://E-next.in, , Page 15
Page 14 :
Prof. Tirup Parmar, Input Devices for Operator Interaction, One enduring trait of computing systems is the presence of the human operator. At the, human-computer interface, the nature of computing has witnessed dramatic, transformations--from feeding punched cards into a reader to manipulating 3D virtual, objects with an input glove. The technology at our finger tips today transcends by, orders of magnitude that in the behemoth calculators of the 1940s. Yet technology, must co-exist with the human interface of the day. Not surprisingly, themes on, keeping pace with advances in technology in the human-computer interface and,, hopefully, getting ahead, underlie many chapters in this book. The present chapter is, no exception. Input devices and interaction techniques are the human operator's baton., They set, constrain, and elicit a spectrum of actions and responses, and in a large way, inject a personality on the entire human-machine system. In this chapter, we will, present and explore the major issues in "input", focusing on devices, their properties, and parameters, and the possibilities for exploiting devices in advanced humancomputer interfaces., To place input devices in perspective, we illustrate a classical human factors, interpretation of the human-machine interface (e.g., Chapanis, 1965, p. 20). Figure 1, simplifies the human and machine to three components each. The internal states of, each interact in a closed-loop system through controls and displays (the machine, interface) and motor-sensory behaviour (the human interface). The terms "input" and, "output" are, by convention, with respect to the machine; so input devices are inputs, to the machine controlled or manipulated by human "outputs". Traditionally human, outputs are our limbs--the hands, arms, legs, feet, or head--but speech and eye, motions can also act as human ouput. Some other human output channels are breath, and electrical body signals (important for disabled users)., , Video Lectures @ https://www.youtube.com/TirupParmar & Notes @ https://t.me/bscit, , https://E-next.in, , Page 16
Page 15 :
Prof. Tirup Parmar, Interaction takes place at the interface (dotted line in Figure 1) through an output channel-displays stimulating human senses--and the input channel., , Graphics Input Devices, • Any device that allows information fromoutside the computer to be communicated to the, computer is considered an input device., • Understanding of various input devices is important in order to construct high-quality, graphical user-interfaces., • Input devices are of two basic types: analog and digital., , Commonly used Analog Input Devices, (convert a graphic system user’s movements into changes in voltage), • Paddle control,, • Trackball,, • Mouse, and, • Joystick, , Commonly used Digital Input Devices, (are actually analog devices that collect input, information in discrete form), • Light pen,, • Magnetic pen and tablet,, • Touch Panel, and, • Keyboard, • Digitizers, • Image Scanners, , Paddle Control, • Simplest of the analog input, devices., • The paddle control varies its, resistance, thereby changing the, voltage of the input circuit in, relation to the movement of the, paddle’s control knob., • Commonly, two paddle controls, are used in graphics system, one to, control movement in the x-direction, and one to control movement in the, y-direction., Figure: Paddle Control, , Video Lectures @ https://www.youtube.com/TirupParmar & Notes @ https://t.me/bscit, , https://E-next.in, , Page 17
Page 16 :
Prof. Tirup Parmar, Trackball, • Trackball is normally operated by rolling the ball with the palm of the hand., • It mechanically combines two variable resistors in a single device, thus allowing the user to use, one hand to enter both x and y information with a single device., , Figure: Trackball, , Mouse, • The mouse, like trackball, combines two variable resistors in a single device., • Wheels or rollers on the bottom of the mouse can be used to record the amount and direction of, movement. Another method for detecting mouse motion is with an optical sensor., • One, two or three buttons are usually included on the top of the mouse for signaling the, execution of some operation, such as recording cursor position or invoking a function., , Figure: Mouse, , Video Lectures @ https://www.youtube.com/TirupParmar & Notes @ https://t.me/bscit, , https://E-next.in, , Page 18
Page 17 :
Prof. Tirup Parmar, , optical mouse, , mechanical mouse, , Joystick, • A joystick consists of a small,, vertical lever (stick) mounted on a, base that is used to steer the screen, cursor around., • The distance that the stick is moved, in any direction from its center, position corresponds to screen-cursor, movement in that direction., , Figure: Joystick, , Light Pen, • Light pens are used to select screen positions by detecting the light coming from the points on, the CRT screen., • They are sensitive to the short burst of light emitted from the phosphor coating at the instant the, electron beam strikes a particular point., • The recorded light-pen coordinates can be used to position an object or to select a processing, option., , Video Lectures @ https://www.youtube.com/TirupParmar & Notes @ https://t.me/bscit, , https://E-next.in, , Page 19
Page 18 :
Prof. Tirup Parmar, , Figure: Light pen system, , Magnetic pen and tablet, • A magnetic pen and tablet are composed of a two-dimensional wire grid and a radiowaveemitting stylus., • The wire grid is a matrix antenna which locates the position of the stylus measuring the, intensity of the radio signal received by each wire in the grid., , Figure: Magnetic Tablet, , Touch Panel, • Touch panels allow displayed objects or screen positions to be selected with the touch of a, finger., , Video Lectures @ https://www.youtube.com/TirupParmar & Notes @ https://t.me/bscit, , https://E-next.in, , Page 20
Page 19 :
Prof. Tirup Parmar, • Optical touch panels make use of a series of infrared light-emitting diodes (LEDs) and sensors, located around the perimeter of the display., • When the user touches the screen, light beams are broken, indicating the location of the user’s, finger., , Figure: Optical Touch Panel, , Keyboard, , Fig. Working of Keyboard, , Video Lectures @ https://www.youtube.com/TirupParmar & Notes @ https://t.me/bscit, , https://E-next.in, , Page 21
Page 20 :
Prof. Tirup Parmar, • The keyboard is an efficient device for inputting nongraphic data as picture levels associated, with a graphic display., • Keyboards can also be provided with features to facilitate entry of screen coordinates, menu, selections, or graphic functions., • Function keys allow users to enter frequently used operations in a single keystroke, and, cursorcontrol keys can be used to select displayed objects or coordinate positions by positioning, the screen cursor., , Figure: Ergonomically designed keyboard with removable palm rests, , Digitizers, • A common device for interactively selecting, coordinate positions on a object is a digitizer., • These discrete coordinate positions can be, joined with straight-line segments to, approximate the curve or surface shapes., • Graphic tablets provide a highly accurate, method for selecting coordinate positions with, accuracy of about 0.05 mm., • Many graphic tablets are constructed with a, rectangular grid of wires embedded in the tablet, surface., • Electromagnetic pulses are generated in, sequence along the wires, and an electric signal, is induced in a wire coil in an activated stylus or, hand cursor to record a tablet position., , Figure: Digitizer, , Video Lectures @ https://www.youtube.com/TirupParmar & Notes @ https://t.me/bscit, , https://E-next.in, , Page 22
Page 21 :
Prof. Tirup Parmar, Image Scanners, • An image scanner records the, gradations of gray scale/color, of a given color or b/w photos, and stores in an array., • On stores image, we can, apply transformations to, rotate, scale, crop the picture, to a particular screen area., • We can also apply various, image processing methods to, modify the array, representation of the picture, (e.g. contrast enhancement)., , Figure: Flatbed scanner, , DataGlove: 3D Interaction Device, • The glove is constructed, with a series of sensors that, detect hand and finger, movements., • Electromagnetic coupling, between transmitting, antennas and receiving, antennas is used to provide, information about position, and orientation of the hand., • Inputs from the glove can, be used to position or, manipulate objects in a, virtual scene., , Figure: DataGlove, , Video Lectures @ https://www.youtube.com/TirupParmar & Notes @ https://t.me/bscit, , https://E-next.in, , Page 23
Page 22 :
Prof. Tirup Parmar, , Types of Video Input Devices, An input device is any device that sends data from an outside source into a processing system, such as a computer or television. A video input device is any device that sends video. There are, several types of video input devices that allow you to play video from an external device on a, video display., , Media Players, Media players are devices that play any sort of media. These include physical media players such, as VCRs, DVD players and Blu-ray players, as well as digital media players such as DVRs and, streaming video players such as the Roku Netflix player and other Netflix-supported devices., , Video Game Consoles, Video game consoles play video game media. These include the PlayStation 3, Xbox 360 and, Nintendo Wii. Some hand-held consoles such as the PlayStation Portable can also function as a, video input device with an optional video output cable. Also, some video game consoles can play, other video media such as videos from a media server or streaming Netflix or Hulu., Video Lectures @ https://www.youtube.com/TirupParmar & Notes @ https://t.me/bscit, , https://E-next.in, , Page 24
Page 23 :
Prof. Tirup Parmar, Satellite/Cable Receivers, Satellite and cable receivers are set-top boxes (STB) that allow you to receive a decrypted video, signal from your satellite or cable service provider. This allows you to receive broadcast TV and, subscription channels as well as optional services such as video on-demand and DVR recordings., , Digital Cameras, Digital cameras can also function as video input devices. Most digital cameras, including still, cameras and video cameras, include video output ports such as composite or HDMI ports; these, ports allow you to connect the camera to a TV to view the photos and videos form the camera., Digital cameras can also be connected to a computer to transfer photos and videos., , Audio Input Devices, Voice Input, Microphones convert spoken words to digital signals that can be processed by a computer., Modern speech recognition software is able to translate this into either commands or data. This, enables the user to use a microphone as an alternative to the keyboard., , Digitised Audio Signals, MIDI (Musical Instrumental Digital Interface) devices allow direct input from musical, instruments capable of electrical I/O., , Active and Passive Graphics Devices, Types of Computer Graphics:Non – Interactive or Simple or Passive Computer Graphics & Interactive or Passive, Computer Graphics, , Interactive Computer Graphics: Interactive Computer Graphics involves a two way, communication between computer and user. Here the observer is given some control over the, image by providing him with an input device for example the video game controller of the ping, pong game. This helps him to signal his request to the computer., The computer on receiving signals from the input device can modify the displayed picture, appropriately. To the user it appears that the picture is changing instantaneously in response to his, Video Lectures @ https://www.youtube.com/TirupParmar & Notes @ https://t.me/bscit, , https://E-next.in, , Page 25
Page 24 :
Prof. Tirup Parmar, commands. He can give a series of commands, each one generating a graphical response from the, computer. In this way he maintains a conversation, or dialogue, with the computer., Interactive computer graphics affects our lives in a number of indirect ways. For example, it helps, to train the pilots of our airplanes. We can create a flight simulator which may help the pilots to, get trained not in a real aircraft but on the grounds at the control of the flight simulator. The flight, simulator is a mock up of an aircraft flight deck, containing all the usual controls and surrounded, by screens on which we have the projected computer generated views of the terrain visible on take, off and landing., Flight simulators have many advantages over the real aircrafts for training purposes, including fuel, savings, safety, and the ability to familiarize the trainee with a large number of the world’s airports., , Non Interactive Computer Graphics: In non interactive computer graphics otherwise, known as passive computer graphics. it is the computer graphics in which user does not have any, kind of control over the image. Image is merely the product of static stored program and will work, according to the instructions given in the program linearly. The image is totally under the control, of program instructions not under the user. Example: screen savers., , Control, Communication, Interaction, , Motion & Updation, , Passive, , Active, , No control, , Dynamic nature, , One Way Communication, , 2-Way Communication, , No Interaction b/w User and H/W, , High bandwidth user interaction, , Earlier supported, , Modern Applications, , No facility, , 2-D, 3-D Transformations, , Display Technologies, A display is a computer output surface and projecting mechanism that shows text and often, graphic images to the computer user, using a cathode ray tube ( CRT ), liquid crystal display, ( LCD ), light-emitting diode, gas plasma, or other image projection technology. The display is, usually considered to include the screen or projection surface and the device that produces the, information on the screen. In some computers, the display is packaged in a separate unit called, a monitor . In other computers, the display is integrated into a unit with the processor and other, parts of the computer. (Some sources make the distinction that the monitor includes other signalhandling devices that feed and control the display or projection device. However, this distinction, disappears when all these parts become integrated into a total unit, as in the case of notebook, computers.) Displays (and monitors) are also sometimes called video display terminals (VDTs) ., The terms display and monitor are often used interchangably., Most computer displays use analog signals as input to the display image creation mechanism., This requirement and the need to continually refresh the display image mean that the computer, also needs a display or video adapter. The video adapter takes the digital data sent by application, Video Lectures @ https://www.youtube.com/TirupParmar & Notes @ https://t.me/bscit, , https://E-next.in, , Page 26
Page 25 :
Prof. Tirup Parmar, programs, stores it in video random access memory ( video RAM ), and converts it to analog, data for the display scanning mechanism using an digital-to-analog converter ( DAC )., Graphics display technologies, • They include:, o cathode ray tube, o Plasma, o LCD, o Raster graphics, , Random Scan (Vector Scan) calligraphic display, In this technique, the electron beam is directed only to the part of the screen where the picture is, to be drawn rather than scanning from left to right and top to bottom as in raster scan. It is also, called vector display, stroke-writing display, or calligraphic display., Picture definition is stored as a set of line-drawing commands in an area of memory referred to, as the refresh display file. To display a specified picture, the system cycles through the set of, commands in the display file, drawing each component line in turn. After all the line-drawing, commands are processed, the system cycles back to the first line command in the list., Random-scan displays are designed to draw all the component lines of a picture 30 to 60 times, each second., , Video Lectures @ https://www.youtube.com/TirupParmar & Notes @ https://t.me/bscit, , https://E-next.in, , Page 27
Page 26 :
Prof. Tirup Parmar, Refresh Cathode-Ray Tubes, The basic operation of a CRT. A beam of electrons (cathode rays) emitted by an electron gun,, passes through focusing and deflection systems that direct the beam toward specified positions, on the phosphor coated screen. Fig.1., The phosphor then emits a small spot of light at each position contacted by the electron, beam. Because the light emitted by the phosphor fades very rapidly, some method is, needed for maintaining the screen picture. One way to keep the phosphor glowing is to, redraw the picture repeatedly by quickly directing the electron beam back over the same, points. This type of display is called a refresh CRT., , Fig.1, , Fig. 2, , Fig. 3, , Video Lectures @ https://www.youtube.com/TirupParmar & Notes @ https://t.me/bscit, , https://E-next.in, , Page 28
Page 27 :
Prof. Tirup Parmar, , , , , , , , , , , , , , , , The primary components of an electron gun in a CRT are the heated metal cathode and a, control grid, Heat is supplied to the cathode by directing a current through a coil of wire, called the, filament, inside the cylindrical cathode structure. This causes electrons to be boiled off", the hot cathode surface. In the vacuum inside the CRT envelope, the free, negatively, charged electrons are then accelerated toward the phosphor coating by a high positive, voltage. The accelerating voltage can be generated with a positively charged metal, coating on the inside of the CRT envelope near the phosphor screen, or an accelerating, anode can be used, as in Fig.3., Sometimes the electron gun is built to contain the accelerating anode and focusing system, within the same unit. Intensity of the electron beam is controlled by setting voltage levels, on the control grid, which is a metal cylinder that fits over the cathode. A high negative, voltage applied to the control grid will shut OFF the beam by repelling electrons and, stopping them from passing through the small hole at the end of the control grid structure., A smaller negative voltage on the control grid simply decreases the number of electrons, passing through. Since the amount of light emitted by the phosphor coating depends on, the number of electrons striking the screen,, The focusing system in a CRT is needed to force the electron beam to converge into a, small spot as it strikes the phosphor. Otherwise, the electrons would repel each other, and, the beam would spread out as it approaches the screen. Focusing is accomplished with, either electric or magnetic fields., The distance that the electron beam must travel to different points on the screen varies, because the radius of curvature for most CRTs is greater than the distance from the, focusing system to the screen center. Therefore, the electron beam will be focused, properly only at the center to the screen., As the beam moves to the outer edges of the screen, displayed images become blurred., To compensate for this, the system can adjust the focusing according to the screen, position of the beam., As with focusing, deflection of the electron beam can be controlled either with electric, fields or with magnetic fields., Magnetic deflection has two pairs of coils are used, with the coils in each pair mounted, on opposite sides of the neck of the CRT envelope. One pair is mounted on the top and, bottom of the neck and the other pair is mounted on opposite sides of the neck. The, magnetic, field produced by each pair of coils results in a transverse deflection force that, is perpendicular both to the direction of the magnetic field and to the direction of travel of, the electron beam. Horizontal deflection is accomplished with one pair of coils, and, vertical deflection by the other pair. The proper deflection amounts are attained by, adjusting the current through the coils., Electrostatic deflection has two pairs of parallel plates are mounted inside the CRT, envelope. One pair coil plates is mounted horizontally to control the vertical deflection,, and the other pair is mounted vertically to control horizontal deflection (Fig. 3). Spots of, light are produced on the screen by the transfer of the CRT beam energy to the phosphor., When the electrons in the beam collide with the phosphor coating, they are stopped and, then kinetic energy is absorbed by the phosphor. Part of the beam energy is converted by, friction into heat energy, and the remainder causes electrons in the phosphor atoms to, move up to higher quantum-energy levels. After a short time, the "excited phosphor, , Video Lectures @ https://www.youtube.com/TirupParmar & Notes @ https://t.me/bscit, , https://E-next.in, , Page 29
Page 28 :
Prof. Tirup Parmar, electrons begin dropping back to their stable ground state, giving up their extra energy as, small quantum’s of Light energy. The frequency (or color) of the light emitted by the, phosphor is proportional to the energy difference between the excited quantum state and, the ground state. Different kinds of phosphors are available for use in a CRT., Besides color, a major difference between phosphors is their persistence., , , , Persistence: How long they continue to emit light (that is, have excited electrons, returning to the ground state) after the CRT beam is removed., Persistence is defined as “the time it takes the emitted light from the screen to decay, to one- tenth of its original intensity”., Lower persistence phosphors require higher refresh rates to maintain a picture on, the screen without flicker. It is useful for animation, High-persistence phosphor is useful for displaying highly complex, static, pictures. Although some phosphors have persistence greater than 1 second, graphics, monitors are usually constructed with persistence in the range from 10 to 60, microseconds., , , , Resolution: The maximum number of points that can be displayed without overlap on a, CRT is referred to as the resolution., Resolution is the number of points per centimeter that can be plotted horizontally and, vertically, although it is often simply stated as the total number of points in each direction., , , Spot intensity has a Gaussian distribution, so two adjacent spots will appear distinct as, long as their separation is greater than the diameter at which each spot has an intensity of, about 60 percent of that at the center of the spot., Typical resolution on high-quality systems is 1280 by 1024, with higher resolutions, available on many systems. High resolution systems are often referred to as high-definition, systems. The physical size of a graphics monitor is given as the length of the screen diagonal,, with sizes varying from about 12 inches to 27 inches or more., , , Aspect Ratio: This number gives the ratio of vertical points to horizontal points, necessary to produce equal-length lines in both directions on the screen. (Sometimes, aspect ratio is stated in terms of the ratio of horizontal to vertical points.) An aspect ratio, of 3/4 means that a vertical line plotted with three points has the same length as a, horizontal line plotted with four points., , RASTER-SCAN DISPLAYS, The most common type of graphics monitor employing a CRT is the raster-scan display, based, on television technology., , Video Lectures @ https://www.youtube.com/TirupParmar & Notes @ https://t.me/bscit, , https://E-next.in, , Page 30
Page 29 :
Prof. Tirup Parmar, In a raster-scan system, “the electron beam is swept across the screen, one row at a time from, top to bottom”. As the electron beam moves across each row, the beam intensity is turned on, and off to create a pattern of illuminated spots., , Fig. 4, , Fig. 5, , , , Picture definition is stored in a memory area called the refresh buffer or frame buffer., This memory area holds the set of intensity values for all the screen points. Stored, intensity values are then retrieved from the refresh buffer and "painted" on the screen one, row (scan line) at a time Fig., PIXEL: Each screen point is referred to as a pixel or pel (shortened forms of picture, element)., The capability of a raster-scan system to store intensity information for each screen point, makes it well suited for the realistic display of scenes containing subtle shading and color, patterns., Eg: Home Television sets and Printers., Intensity range for pixel positions depends on the capability of the raster system., , , In a simple black-and-white system, each screen point is either on or off, so only one bit, per pixel is needed to control the intensity of screen positions., For a bit level system,, A bit value of 1 indicates that the electron beam is to be turn ON at that position., A bit value of 0 indicates that the beam intensity is to be turn OFF., Additional bits are needed when color and intensity variations can be displayed., , , , Up to 24 bits per pixel are included in high-quality systems, which can require several, megabytes of storage for the frame buffer, depending on the resolution of the system., A system with 24 bits per pixel and a screen resolution of 1024 bv 1024 requires 3, Mega Bytes of storage for the frame buffer., , Video Lectures @ https://www.youtube.com/TirupParmar & Notes @ https://t.me/bscit, , https://E-next.in, , Page 31
Page 30 :
Prof. Tirup Parmar, , , , , , , , , , Bitmap: On a black-and-white system with one bit per pixel, the frame buffer is, commonly called a Bitmap., Pixmap: Systems with multiple bits per pixel, the frame buffer are often referred to as a, Pixmap., Refreshing on raster-scan displays is carried out at the rate of 60 to 80 frames per, second, although some systems are designed for higher refresh rates. Sometimes, refresh, rates are described in units of cycles per second, or Hertz (Hz), where a cycle, corresponds to one frame., A refresh rate of 60 frames per second as simply 60 cycle per second or 60 Hz., At the end of each scan line, the electron beam returns to the left side of the screen to, begin displacing the next scan line., Horizontal Retrace: The return to the left of the screen, after refreshing each, scan line, is called the horizontal retrace of the electron beam., Vertical Retrace: At the end of each frame (displayed in 1/80th to 1/60th of a, second), the electron beam returns (vertical retrace) to the top left comer of the screen to, begin the next frame., On some raster-scan systems (and in TV sets), each frame is displayed in two passes, using an interlaced refresh procedure. In the first pass, the beam sweeps across every, other scan line from top to bottom. Then after the vertical retrace, the beam sweeps out, the remaining scan lines (Fig. 6)., , , , Interlacing: Interlacing of the scan lines in this way allows us to see” the entire screen, displayed in one-half the time” it would have taken to sweep across all the lines at once, from top to bottom. Interlacing is primarily used with slower refreshing rates., On an older, 30 frame per-second, non-interlaced display, for instance, some flicker is, noticeable. But with interlacing, each of the two passes can be accomplished in 1/60th of a, second, which brings the refresh rate nearer to 60 frames per second., This is an effective technique for avoiding flicker, providing that adjacent scan lines, contain similar display information., , Video Lectures @ https://www.youtube.com/TirupParmar & Notes @ https://t.me/bscit, , https://E-next.in, , Page 32
Page 31 :
Prof. Tirup Parmar, , Random-Scan Displays, When operated as a random-scan display unit, a CRT has “the electron beam directed only to, the parts of the screen where a picture is to be drawn”., Random scan monitors draw a picture one line at a time and for this reason are also referred to, as vector displays (or stroke-writing or calligraphic displays)., , , , , , , , The component lines of a picture can be drawn and refreshed by a random-scan system in, any specified order (Fig.). A pen plotter operates in a similar way and is an example of a, random-scan, hard-copy device., Refresh rate on a random-scan system depends on the number of lines to be displayed., Picture definition is now stored as a set of line drawing commands in an area of memory, r e f e d to as the refresh display file., , Video Lectures @ https://www.youtube.com/TirupParmar & Notes @ https://t.me/bscit, , https://E-next.in, , Page 33
Page 32 :
Prof. Tirup Parmar, , , , , , , , , , , Sometimes the refresh display file is called the display list, display program, or, simply the refresh buffer., To display a specified picture, the system cycles through the set of commands in the, display file, drawing each component line in turn. After all line drawing commands have, been processed, the system cycles back to the first line command in the list., Random-scan displays are designed to draw all the component lines of a picture 30 to 60, times each second., High quality vector systems are capable of handling approximately 100,000 "short" lines, at this refresh rate. When a small set of lines is to be displayed, each refresh cycle is, delayed to avoid refresh rates greater than 60 frames per second. Otherwise, faster, refreshing is the set of lines could burn out the phosphor., Random-scan systems are designed for line drawing applications and cannot display, realistic shaded scenes. Since picture definition is stored as a set of line drawing, instructions and not as a set of intensity values for all screen points, vector displays, generally have higher resolution than raster systems., Also, vector displays produce smooth line drawings because the CRT beam directly, follows the line path., A raster system, in contrast, produces jagged lines that are plotted as discrete end point, sets., , Color CRT Monitors, A CRT monitor displays color pictures by using a combination of phosphors that emit differentcolored light. By combining the emitted light from the different phosphors, a range of colors can, be generated. The two basic techniques for producing color displays with a CRT are, 1. The Beam-Penetration method., 2. The Shadow-Mask method., , 1. BEAM-PENETRATION METHOD, The beam-penetration method for displaying color pictures has been used with randomscan monitors. Two layers of phosphor, usually RED and GREEN, are coated onto the inside, of the CRT screen, and the displayed color depends on how far the electron beam penetrates into, the phosphor layers., A beam of slow electrons excites only the outer RED layer., A beam of very fast electrons penetrates through the RED layer and excites the inner, GREEN layer. At intermediate beam speeds, combinations of red and green light are emitted, to show two additional colors, ORANGE and YELLOW., The speed of the electrons, and hence the screen color at any point, is controlled by the, beam-acceleration voltage., Advantage: Beam penetration has been an inexpensive way to produce color in random-scan, monitors,, Disadvantage: only four colors are possible, and the quality of pictures is not as good as with, other methods., , Video Lectures @ https://www.youtube.com/TirupParmar & Notes @ https://t.me/bscit, , https://E-next.in, , Page 34
Page 33 :
Prof. Tirup Parmar, 2. SHADOW-MASK METHODS, , , , , , Shadow-mask methods are commonly used in raster scan systems (including color TV), because they produce a much wider range of colors than the beam penetration method., A shadow-mask CRT has three phosphor color dots at each pixel position., One phosphor dot emits a RED Light, another emits a GREEN light, and the third emits, a BLUE light., This type of CRT has three electron guns, one for each color dot, and a shadow-mask grid, just behind the phosphor-coated screen., , 1. Delta-Delta Shadow-Mask method, commonly used in color CRT systems. The, three electron beams are deflected and focused as a group onto the shadow mask, which, contains a series of holes aligned with the phosphor-dot patterns. When the three beams pass, through a hole in the shadow mask, they activate a Dot Triangle, which appears as a small, color spot on the screen. The phosphor dots in the triangles are arranged so that each electron, beam can activate only its corresponding color dot when it passes through the shadow mask., 2.In-Line arrangement in which the three electron guns, and the corresponding redgreen-blue color dots on the screen, are aligned along one scan line instead of in a triangular, pattern. This in-line arrangement of electron guns is easier to keep in alignment and is, commonly used I n high-resolution color CRTs., , Fig. 2.1, , Fig. 2.2, , Video Lectures @ https://www.youtube.com/TirupParmar & Notes @ https://t.me/bscit, , https://E-next.in, , Page 35
Page 34 :
Prof. Tirup Parmar, , , , , , , , , , , , , , The color variations in a shadow-mask CRT by varying the intensity levels of the three, electron beams., By turning OFF the RED and GREEN guns, gets the color coming from the BLUE, phosphor., Other combinations of beam intensities produce a small light spot for each pixel position,, since our eyes tend to merge the three colors into one composite., The color depends on the amount of excitation of the red, green, and blue phosphors., White (or gray) area is the result of activating all three dots with equal intensity., Yellow is produced with the green and red dots only., Magenta is produced with the blue and red dots., Cyan shows up when blue and green are activated equally., In some low-cost systems, the electron beam can only be set to on or off, limiting, displays to Eight Colors., , Video Lectures @ https://www.youtube.com/TirupParmar & Notes @ https://t.me/bscit, , https://E-next.in, , Page 36
Page 35 :
Prof. Tirup Parmar, , , , , , , , , , , , More sophisticated systems can set intermediate intensity levels for the electron beams,, allowing several million different colors to be generated., Color graphics systems can be designed to be used with several types of CRT display, devices. Some inexpensive home-computer systems and video games are designed for, use with a color TV set and an RF (radio-frequency) modulator., The purpose of the RF modulator is to simulate the signal from a broadcast TV station., This means that the color and intensity information of the picture must be combined and, superimposed on the broadcast-frequency carrier signal that the TV needs to have as, input. The RF modulator and TV circuitry decreases the quality of displayed images., These monitors use shadow-mask methods and take the intensity level for each electron, gun (red, green, and blue) directly from the computer system without any intermediate, processing., High-quality raster-graphics systems have 24 bits per pixel in the frame buffer, allowing, 256 voltage settings for each electron gun and nearly 17 million color choices for each, pixel., An RGB color system with 24 bits of storage per pixel is generally referred to as a FullColor System or a True-Color System., , Direct-View Storage Tubes, An alternative method for maintaining a screen image is to “store the picture, information inside the CRT instead of refreshing the screen”., A direct-view storage tube (DVST) “stores the picture information as a charge, distribution just behind the phosphor-coated screen”., Two electron guns are used in a DVST., 1. Primary gun: It is used to store the picture pattern, 2. Flood gun: It maintains the picture display., A DVST monitor has both disadvantages and advantages compared to the refresh CRT., Advantages, 1. Because no refreshing is needed., 2. Very complex pictures can be displayed at very high resolutions without flicker., Disadvantages, 1. DVST systems are that they ordinarily do not display color and that selected parts of a picture, cannot he erased., 2. To eliminate a picture section, the entire screen must be erased and the modified picture, redrawn., 3. The erasing and redrawing process can take several seconds for a complex picture., 4. For these reasons, storage displays have been largely replaced by raster systems., , Video Lectures @ https://www.youtube.com/TirupParmar & Notes @ https://t.me/bscit, , https://E-next.in, , Page 37
Page 36 :
Prof. Tirup Parmar, FLAT-PANEL DISPLAYS, Although most graphics monitors are still constructed with CRTs, other technologies are, emerging that may soon replace CRT monitors. The term flat-panel display refers to a class of, video devices that have, 1. Reduced volume, 2. Weight, 3. Power requirements, compared to a CRT. A significant feature of it is that they are thinner than CRTs, and, can hang them on walls or wear them on our wrists., Current uses for flat-panel displays include small TV monitors, calculators, pocket, video games, laptop computers, armrest viewing of movies on airlines, as advertisement, boards in elevators, and as graphics displays in applications requiring rugged, portable, monitors and pocket notepads., Flat-panel displays into two categories:, 1. Emissive displays, 2. Non-Emissive displays., 1. Emissive displays (or emitters): These devices that convert electrical energy into light., Examples:, 1. Plasma panels., 2. Thin-film electroluminescent., 3. Light-Emitting Diodes (LED)., Flat CRTs have also been devised, in which electron beams arts accelerated parallel to the, screen, then deflected 90' to the screen. But flat CRTs have not proved to be as successful as, other emissive devices., 2. Non-emissive displays (or non-emitters): These device use optical effects to convert sunlight, or light from some other source into graphics patterns., Example:, 1. Liquid-Crystal Device (LCD), , PLASMA PANELS:, , , , , , Plasma panels also called gas-discharge displays, These are constructed by filling the region between two glass plates with a mixture of, gases that usually includes neon., A series of vertical conducting ribbons is placed on one glass panel, and a set of, horizontal ribbons is built into the other glass panel (Fig.)., Firing voltages applied to a pair of horizontal and vertical conductors cause the gas at the, intersection of the two conductors to break down into glowing plasma of electrons and, ions., , Video Lectures @ https://www.youtube.com/TirupParmar & Notes @ https://t.me/bscit, , https://E-next.in, , Page 38
Page 37 :
Prof. Tirup Parmar, , , , , , Picture definition is stored in a refresh buffer, and the firing voltages are applied to, refresh the pixel positions (at the intersections of the conductors) 60 times per second., Alternating methods are used to provide faster application of the firing voltages, and thus, brighter displays., Separation between pixels is provided by the electric field of the conductors., One disadvantage of plasma panels has been that they were strictly monochromatic, devices, but systems have been developed that are now capable of displaying color and, grayscale., , Thin-Film Electroluminescent:, , , , , , Thin-film electroluminescent displays are similar in construction to a plasma panel., The difference is that the region between the glass plates is filled with a phosphor, such, as zinc sulfide doped with manganese, instead of a gas., When a sufficient high voltage is applied to a pair of crossing electrodes, the phosphor, becomes a conductor in the area of the intersection of the two electrodes., Electrical energy is then absorbed by the manganese atoms, which then release the energy, as a spot of light similar to the glowing plasma effect in a plasma panel., , Disadvantage: These displays require more power than plasma panels, and good color and, gray scale displays are hard to achieve., , Light-Emitting Diode (LED):, A matrix of diodes is arranged to form the pixel positions in the display, and picture definition is, stored in a refresh buffer., As in scan-line refreshing of a CRT, information is read from the refresh buffer and converted to, voltage levels that are applied to the diodes to produce the light patterns in the display., , Liquid-Crystal Device (LCD):, , , , , , , , These are commonly used in small systems, such as calculators and portable, laptop, computers, These non-emissive devices produce a picture by passing polarized light from the, surroundings or from an internal light source through a liquid-crystal material that can be, aligned to either block or transmit the light., The term liquid crystal refers to the fact that these compounds have a crystalline, arrangement of molecules, yet they flow like a liquid., Flat-panel displays commonly use nematic (threadlike) liquid-crystal compounds that, tend to keep the long axes of the rod-shaped molecules aligned., A flat-panel display can then be constructed with a nematic liquid crystal., Passive-Matrix LCD: Two glass plates, each containing a light polarizer at right angles, to the-other plate, sandwich the liquid-crystal material. Rows of horizontal transparent, conductors are built into one glass plate, and columns of vertical conductors are put into, , Video Lectures @ https://www.youtube.com/TirupParmar & Notes @ https://t.me/bscit, , https://E-next.in, , Page 39
Page 38 :
Prof. Tirup Parmar, , , , , , , , the other plate. The intersection of two conductors defines a pixel position. Normally, the, molecules are aligned as shown in the "on state"., Polarized light passing through the material is twisted so that it will pass through the, opposite polarizer. The light is then reflected back to the viewer., To turn off the pixel, apply a voltage to the two intersecting conductors to align the, molecules so that the light is not .twisted., This type of flat-panel device is referred to as a passive-matrix LCD. Picture definitions, are stored in a refresh buffer, and the screen is refreshed at the rate of 60 frames per, second, as in the emissive devices., Back lighting is also commonly applied using solid-state electronic devices, so that the, system is not completely dependent on outside light sources be displayed by using, different materials or dyes and by placing a triad of color pixels at each screen location., Active-Matrix Displays: Another method for constructing LCD is to place a transistor, at each pixel location, using thin-film transistor technology. The transistors are used to, control the voltage at pixel locations and to prevent charge from gradually leaking out of, the liquid-crystal cells. These devices are called active-matrix displays., , Video Basics, What is Video?, , , , , Video, or moving image in general, is created from a sequence of still images, called frames., By recording and then playing back frames in quick succession, an illusion of movement, is created., Video can be edited by removing some frames and combining sequences of frames,, called clips, together in a timeline., , What is a Video Format?, , , , , , A video format defines the way in which video is recorded and stored. It normally, specifies:, o Codec/compressor, o Frame rate, o Frame size, o Frame aspect ratio, o Pixel aspect ratio, o Scanning method (interlaced or progressive), Common formats are DV, HDV and AVCHD., Tape-based formats such as DV and HDV can be transferred to a computer for editing, via Firewire., , Video Lectures @ https://www.youtube.com/TirupParmar & Notes @ https://t.me/bscit, , https://E-next.in, , Page 40
Page 39 :
Prof. Tirup Parmar, , , , File-based formats such as AVCHD are already stored as files and can be transferred to a, computer for editing via USB., File-based formats may need to be converted during or after transfer to be compatible, with editing software., , What is a Codec (Compressor)?, , , , , , , , Codec is short for coder-decoder and describes the method in which video data is, encoded into a file and decoded when the file is played back., Most video is compressed during encoding, and so the terms codec and compressor are, often used interchangeably., Transcoding is the process of converting from one codec to another., Codecs can be Lossless, which means that they do not throw away any data, or Lossy,, which means that data is lost during encoding., Lossless codecs are higher quality than lossy codecs, but produce larger file sizes., In a video workflow, you should avoid transcoding to a lossy codec until final output., This means that your final edit can be exported to H.264 for the web, but you should not, use the H.264 file for further editing, DVD authoring, etc., , What is a Frame?, , , , , A frame is a single still image within a video clip., As with any digital image, a frame consists of pixels (picture elements), with each pixel, representing a colour within the image., The higher the number of pixels, the more accurately an image can be represented. This, is called resolution and is measured in megapixels., , What is Frame Size?, , , , , , , , Frame Size describes the size of a single video frame: width x height, measured in pixels., The width of the frame can vary depending on whether the pixels in the frame are square, pixels or non-square pixels., An example: a DV-PAL 4:3 frame is 768 pixels wide (square pixels) or 720 pixels wide, (non-square pixels). This is because a smaller number of pixels are required to create the, same size frame on screen if each individual pixel is wider., Computer graphics use square pixels, whereas video cameras use non-square pixels., Therefore if creating graphics for video, use the square pixel frame size., A square pixel aspect ratio can be written as 1.0 (width÷height). All other values indicate, non-square pixels., , Video Lectures @ https://www.youtube.com/TirupParmar & Notes @ https://t.me/bscit, , https://E-next.in, , Page 41
Page 40 :
Prof. Tirup Parmar, , What is Frame Aspect Ratio?, , , , , , , , Frame Aspect Ratio describes the relationship between the width and height of a single, video frame., Video is landscape, so the width of a frame is greater than the height., Typical Frame Aspect Ratios for video are 4:3 and 16:9., Digital stills cameras often use 4:3 or 3:2., 4:3 is refered to as standard., 16:9 is referred to as widescreen, and is sometimes (inaccurately) called anamorphic., Some widescreen video is anamorphic, but not all., , What is Frame Rate?, , , , , , , Frame Rate tells you how many frames per second there are when recording or playing, video., Video cameras in Europe use 25 frames per second (fps). In USA & Japan 29.97fps or, 30fps is used., Animation works by recording each frame individually (e.g. with a stills camera) and, then playing them back at a frame rate., Animators often work with a lower frame rate (e.g. 12fps) so less frames are needed for, the same length video clip., If you change the frame rate of a 12fps video clip to 25fps, e.g. by adding it to a 25fps, editing project, each frame will be repeated to keep the clip the same duration., , What is Timecode?, , , , , Timecode is how the duration of video is measured, and is divided into hours, minutes,, seconds and frames, like so: HH:MM:SS:FF., An example: 00:01:22:06 means 1 minute, 22 seconds and 6 frames., It is recorded by the video camera as part of the video signal, and is used to navigate and, locate video when editing., , What does Scanning Method mean?, , , , A video frame is displayed on a screen by scanning each horizontal line from left to right, to form the image., Scanning method describes the way this is done, either by scanning first the odd lines,, then the even lines (interlaced), or by scanning every line in order (progressive)., , Video Lectures @ https://www.youtube.com/TirupParmar & Notes @ https://t.me/bscit, , https://E-next.in, , Page 42
Page 41 :
Prof. Tirup Parmar, , What does Interlaced mean?, , , , , , Interlaced describes a method of recording video where each frame consists of two fields,, which are combined (interlaced) together to form a complete frame., SD televisions and DVD players use interlaced scanning to display video., The Upper Field (field 1) contains the odd lines that form the image., The Lower Field (field 2) contains the even lines that form the image., , What does Progressive mean?, , , , , , , , Progressive or Progressive Scan describes a method of recording video where each frame, is recorded as a whole image, with no fields., This is similar to how a film or stills camera records images, so progressive video is often, said to look more 'film-like'., Progressive is often a recording option on HD video cameras., It is a good choice for recording video that will be slowed down as it avoids any, interlacing artifacts appearing in the slowed-down image., Computer monitors and some HD televisions use progressive scanning to display video., All video for playback on a computer (e.g. on the web) should be progressive scan, either, by recording it as progressive scan, or by de-interlacing it if it is interlaced., , What is Standard Definition (SD)?, , , , , , The term 'Standard Definition' (SD) describes the frame size of a video., SD video can have either a 4:3 or 16:9 frame aspect ratio., SD PAL 4:3 frame size is 720x576 pixels, or 768x576 if using square pixels., A lot of SD web video uses a frame size of 640x480 pixels., , What is High Definition (HD)?, , , , , , The term 'High Definition' (HD) describes a frame size that is larger than Standard, Definition video., HD video always uses a 16:9 frame aspect ratio., HD refers to multiple video formats which use different frame sizes, frame rates and, scanning methods., Typical HD frame sizes are:, o 1280x720 pixels (used for HD television and HD web video), o 1920x1080 pixels (referred to as full-HD or full-raster), o 1440x1080 pixels (full-HD with non-square pixels), , Video Lectures @ https://www.youtube.com/TirupParmar & Notes @ https://t.me/bscit, , https://E-next.in, , Page 43
Page 42 :
Prof. Tirup Parmar, , , HD video formats are normally written like so: HDV1080p25 or HDV1080i50, which, means:, , Codec, , Frame, Height, , Scan, Method, , Frame/Field, Rate, , Description, , HDV, , 1080, , p, , 25, , HDV codec, frame height = 1080 pixels,, progressive scan, 25fps, , HDV, , 1080, , i, , 50, , HDV codec, frame height = 1080 pixels,, interlaced scan, 25fps (50 fields per, second), , What Is a Video Controller?, A video controller, often referred to as a video or graphics card, is a key hardware component, that allows computers to generate graphic information to any video display devices, such as, a monitor or projector. They are also known as graphics or video adapters. Some, modern computers do not include video cards, but rather have graphics processing units directly, integrated into the computer's motherboard., Older Video Controllers, A video controller, once more commonly referred to as a video display controller, were used in, older models of home-computers during the 1980s; they were also used in some early video, game system consoles. Their main function as an integrated circuit in a video signal generator, was to produce television video signals in computers or game systems. Although they could, generate graphics, older video controller models did not have specialized hardware accelerators, that created 2D and 3D images., Evolution of the Video Controller, Modern video controllers are installed with hardware accelerators that create both 2D and 3D, images. They also offer various functions beyond accelerated image rendering, such as TV, output and the ability to hook up to several monitors. Although many computers' motherboards, are already integrated with graphics processing units, you can disable the integrated graphics, chip via the computer's BIOS to install a higher-performance video controller via the accelerated, graphics port. For a modern video controller to function properly in a computer,, Video Lectures @ https://www.youtube.com/TirupParmar & Notes @ https://t.me/bscit, , https://E-next.in, , Page 44
Page 43 :
Prof. Tirup Parmar, a computer needs to have four essential units: a functioning motherboard, a processor that, generates the power that a video controller needs to perform its tasks, enough memory to, distribute the images created by the GPU and a screen or monitor to properly display these, images., GPU, As the brain of a computer's motherboard is the CPU, video controllers have their own unique, "centers," referred to as the graphics processing unit, although the GPU is also referred to as the, visual processing unit. The GPU's specialized electronic circuit is designed specifically to, translate data into graphic images and performs complex mathematical calculations in order to, do so. GPUs are also embedded into mobile phonesand game consoles., Advanced Video Cards, A modern video controller, more frequently referred to as a video card, are installed into, expansion slots onto the motherboard of a computer. The parts of a modern video card include, power supply connectors, a cooling fan, a GPU, and typically also have a PCIe interface,, Graphics Double Data Rate version 5 memory, a display port, a digital video interface and an, HDMI interface. While some video cards have only one port for connection, other advanced, cards have multiple ports that connect to additional televisions and monitors. Advanced 3D, graphics cards, which are more expensive than the average consumer graphics card, allow, consumers to preview modeling viewpoints more fluidly. For example, both AMD Radeon, and Nvidia release popular graphics cards used by gamers. At the time of publication, the specs, for a high-performance video card made by AMD is the Radeon video card, which has 4GB of, memory, 1250 MHz memory clock speed and 320GB per-second memory bandwidth. For, graphic artists, many computers come with GPU-accelerated apps, such as Microsoft's DirectX, or Nvida's close integration with the Autodesk suite. Rather than utilizing a video card slot,, GPU-accelerated programs are integrated into the CPU., , Video Lectures @ https://www.youtube.com/TirupParmar & Notes @ https://t.me/bscit, , https://E-next.in, , Page 45
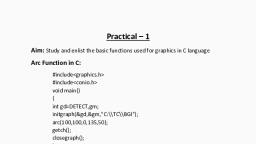
Page 44 :
Prof. Tirup Parmar, , Scan conversion, DDA Line generation Algorithm in Computer Graphics, In any 2-Dimensional plane if we connect two points (x0, y0) and (x1, y1), we get a line segment., But in the case of computer graphics we can not directly join any two coordinate points, for that, we should calculate intermediate point’s coordinate and put a pixel for each intermediate point, of, the desired color with help of functions like putpixel(x, y, K) in C, where (x,y) is our co-ordinate, and K denotes some color., Examples:, Input: For line segment between (2, 2) and (6, 6) :, we need (3, 3) (4, 4) and (5, 5) as our intermediate, points., , Input: For line segment between (0, 2) and (0, 6) :, we need (0, 3) (0, 4) and (0, 5) as our intermediate, points., , For using graphics functions, our system output screen is treated as a coordinate system where the, coordinate of the top-left corner is (0, 0) and as we move down our x-ordinate increases and as we, move, right, our, y-ordinate, increases, for, any, point, (x,, y)., Now, for generating any line segment we need intermediate points and for calculating them we, have can use a basic algorithm called DDA(Digital differential analyzer) line generating, algorithm., , DDA Algorithm:, Consider one point of the line as (X0,Y0) and the second point of the line as (X1,Y1)., // calculate dx , dy, dx = X1 - X0;, dy = Y1 - Y0;, , // Depending upon absolute value of dx & dy, // choose number of steps to put pixel as, // steps = abs(dx) > abs(dy) ? abs(dx) : abs(dy), steps = abs(dx) > abs(dy) ? abs(dx) : abs(dy);, , // calculate increment in x & y for each steps, Xinc = dx / (float) steps;, , Video Lectures @ https://www.youtube.com/TirupParmar & Notes @ https://t.me/bscit, , https://E-next.in, , Page 46
Page 46 :
Prof. Tirup Parmar, // Driver program, int main(), {, int gd = DETECT, gm;, // Initialize graphics function, initgraph (&gd, &gm, "");, int X0 = 2, Y0 = 2, X1 = 14, Y1 = 16;, DDA(2, 2, 14, 16);, return 0;, }, , Bresenham’s Line Generation Algorithm, Given coordinate of two points A(x1, y1) and B(x2, y2). The task to find all the intermediate points, required for drawing line AB on the computer screen of pixels. Note that every pixel has integer, coordinates., Examples:, Input, , : A(0,0), B(4,4), , Output : (0,0), (1,1), (2,2), (3,3), (4,4), , Input, , : A(0,0), B(4,2), , Output : (0,0), (1,0), (2,1), (3,1), (4,2), , Below are some assumptions to keep algorithm simple., 1. We draw line from left to right., 2. x1 < x2 and y1< y2, 3. Slope of the line is between 0 and 1. We draw a line from lower left to upper right., Let us understand the process by considering the naive way first., // A naive way of drawing line, void naiveDrawLine(x1, x2, y1, y2), {, m = (y2 - y1)/(x2 - x1), for (x = x1; x <= x2; x++), {, // Assuming that the round function finds, // closest integer to a given float., y = round(mx + c);, print(x, y);, }, }, , Above algorithm works, but it is slow. The idea of Bresenham's algorithm is to avoid floating, point multiplication and addition to compute mx + c, and then computing round value of (mx +, c) in every step. In Bresenham's algorithm, we move across the x-axis in unit intervals., Video Lectures @ https://www.youtube.com/TirupParmar & Notes @ https://t.me/bscit, , https://E-next.in, , Page 48
Page 47 :
Prof. Tirup Parmar, 1., , We always increase x by 1, and we choose about next y, whether we need to go to y+1 or, remain on y. In other words, from any position (Xk, Yk) we need to choose between (Xk +, 1, Yk) and (Xk + 1, Yk + 1)., , 2. We would like to pick the y value (among Yk + 1 and Yk) corresponding to a point that is, closer to the original line., We need to a decision parameter to decide whether to pick Yk + 1 or Yk as next point. The idea is, to keep track of slope error from previous increment to y. If the slope error becomes greater than, 0.5, we know that the line has moved upwards one pixel, and that we must increment our y, coordinate and readjust the error to represent the distance from the top of the new pixel – which is, done by subtracting one from error., // Modifying the naive way to use a parameter, // to decide next y., void withDecisionParameter(x1, x2, y1, y2), {, m = (y2 - y1)/(x2 - x1), slope_error = [Some Initial Value], for (x = x1, y = y1; x <= x2; x++), {, print(x, y);, // Add slope to increment angle formed, slope_error += m;, // Slope error reached limit, time to increment, // y and update slope error., if (slope_error >= 0.5), {, y++;, slope_error -= 1.0;, }, }, }, , How to avoid floating point arithmetic, The above algorithm still includes floating point arithmetic. To avoid floating point arithmetic,, consider the value below value m., m = (y2 - y1)/(x2 - x1), Video Lectures @ https://www.youtube.com/TirupParmar & Notes @ https://t.me/bscit, , https://E-next.in, , Page 49
Page 48 :
Prof. Tirup Parmar, We multiply both sides by (x2 - x1), We also change slope_error to slope_error * (x2 - x1). To avoid comparison with 0.5, we further, change it to slope_error * (x2 - x1) * 2., Also, it is generally preferred to compare with 0 than 1., // Modifying the above algorithm to avoid floating, // point arithmetic and use comparison with 0., void bresenham(x1, x2, y1, y2), {, m_new = 2 * (y2 - y1), slope_error_new = [Some Initial Value], for (x = x1, y = y1; x <= x2; x++), {, print(x, y);, // Add slope to increment angle formed, slope_error_new += m_new;, // Slope error reached limit, time to increment, // y and update slope error., if (slope_error_new >= 0), {, y++;, slope_error_new -= 2 * (x2 - x1);, }, }, }, , The initial value of slope_error_new is 2*(y2 - y1) - (x2 - x1)., , Bresenham’s circle drawing algorithm, It is not easy to display a continuous smooth arc on the computer screen as our computer screen is, made of pixels organized in matrix form. So, to draw a circle on a computer screen we should, always choose the nearest pixels from a printed pixel so as they could form an arc. There are two, algorithm to do this:, 1. Mid-Point circle drawing algorithm, 2. Bresenham’s circle drawing algorithm, , 1., , Mid-Point Circle Drawing Algorithm, , We need to plot the perimeter points of a circle whose center co-ordinates and radius are given, using the Mid-Point Circle Drawing Algorithm., We use the above algorithm to calculate all the perimeter points of the circle in the first octant and, then print them along with their mirror points in the other octants. This will work only because a, circle is symmetric about it’s centre., , Video Lectures @ https://www.youtube.com/TirupParmar & Notes @ https://t.me/bscit, , https://E-next.in, , Page 50
Page 49 :
Prof. Tirup Parmar, , The algorithm is very similar to the Mid-Point Line Generation Algorithm. Here, only the, boundary condition is different., For any given pixel (x, y), the next pixel to be plotted is either (x, y+1) or (x-1, y+1). This can be, decided by following the steps below., 1. Find the mid-point p of the two possible pixels i.e (x-0.5, y+1), 2. If p lies inside or on the circle perimeter, we plot the pixel (x, y+1), otherwise if it’s outside, we plot the pixel (x-1, y+1), , Video Lectures @ https://www.youtube.com/TirupParmar & Notes @ https://t.me/bscit, , https://E-next.in, , Page 51
Page 50 :
Prof. Tirup Parmar, Boundary Condition : Whether the mid-point lies inside or outside the circle can be decided, by using the formula:-, , In our program we denote F(p) with P. The value of P is calculated at the mid-point of the two, contending pixels i.e. (x-0.5, y+1). Each pixel is described with a subscript k., , Video Lectures @ https://www.youtube.com/TirupParmar & Notes @ https://t.me/bscit, , https://E-next.in, , Page 52
Page 51 :
Prof. Tirup Parmar, The first point to be plotted is (r, 0) on the x-axis. The initial value of P is calculated as follows:-, , Examples:, Input : Centre -> (0, 0), Radius -> 3, Output : (3, 0) (3, 0) (0, 3) (0, 3), (3, 1) (-3, 1) (3, -1) (-3, -1), (1, 3) (-1, 3) (1, -3) (-1, -3), (2, 2) (-2, 2) (2, -2) (-2, -2), , Input : Centre -> (4, 4), Radius -> 2, Output : (6, 4) (6, 4) (4, 6) (4, 6), (6, 5) (2, 5) (6, 3) (2, 3), (5, 6) (3, 6) (5, 2) (3, 2), , 2.Bresenham’s circle drawing algorithm, We have already discussed the Mid-Point circle drawing algorithm. Now we will discuss about, the Bresenham’s circle drawing algorithm., Both of these algorithms uses the key feature of circle that it is highly symmetric. So, for whole, 360 degree of circle we will divide it in 8-parts each octant of 45 degree. In order to that we will, use Bresenham’s Circle Algorithm for calculation of the locations of the pixels in the first octant, of 45 degrees. It assumes that the circle is centered on the origin. So for every pixel (x, y) it, calculates, we draw a pixel in each of the 8 octants of the circle as shown below :, , Video Lectures @ https://www.youtube.com/TirupParmar & Notes @ https://t.me/bscit, , https://E-next.in, , Page 53
Page 52 :
Prof. Tirup Parmar, , Now, we will see how to calculate the next pixel location from a previously known pixel location, (x, y). In Bresenham’s algorithm at any point (x, y) we have two option either to choose the next, pixel in the east i.e. (x+1, y) or in the south east i.e. (x+1, y-1)., , And this can be decided by using the decision parameter d as:, , , , If d > 0, then (x+1, y-1) is to be chosen as the next pixel as it will be closer to the arc., else (x+1, y) is to be chosen as next pixel., Now to draw the circle for a given radius ‘r’ and centre (xc, yc) We will start from (0, r) and move, in first quadrant till x=y (i.e. 45 degree). We should start from listed initial condition:, d = 3 - (2 * r), x = 0, y = r, , Now for each pixel, we will do the following operations:, Video Lectures @ https://www.youtube.com/TirupParmar & Notes @ https://t.me/bscit, , https://E-next.in, , Page 54
Page 55 :
Prof. Tirup Parmar, Draw Ellipse ( XC, YC, X, Y):, 1., , Call PutPixel(XC + X, YC + Y), , 2., , Call PutPixel(XC - X, YC + Y), , 3., , Call PutPixel(XC + X, YC - Y), , 4., , Call PutPixel(XC - X, YC - Y), , 5., , Exit, , Line clipping, In computer graphics, line clipping is the process of removing lines or portions of lines outside, an area of interest. Typically, any line or part thereof which is outside of the viewing area is, removed., There are two common algorithms for line clipping: Cohen–Sutherland and Liang–Barsky., A line-clipping method consists of various parts. Tests are conducted on a given line segment to, find out whether it lies outside the view volume. Afterwards, intersection calculations are carried, out with one or more clipping boundaries.[1], Determining which portion of the line is inside or outside of the clipping volume is done by, processing the endpoints of the line with regards to the intersection., , Video Lectures @ https://www.youtube.com/TirupParmar & Notes @ https://t.me/bscit, , https://E-next.in, , Page 57
Page 56 :
Prof. Tirup Parmar, , Line Clipping, Algorithm), , | Set 1, , (Cohen–Sutherland, , Given a set of lines and a rectangular area of interest, the task is to remove lines which, are outside the area of interest and clip the lines which are partially inside the area., Input : Rectangular area of interest (Defined by, below four values which are coordinates of, bottom left and top right), x_min = 4, y_min = 4, x_max = 10, y_max = 8, , A set of lines (Defined by two corner coordinates), line 1 : x1 = 5, y1 = 5, x2 = 7, y2 = 7, Line 2 : x1 = 7, y1 = 9, x2 = 11, y2 = 4, Line 2 : x1 = 1, y1 = 5, x2 = 4, y2 = 1, , Output : Line 1 : Accepted from (5, 5) to (7, 7), Line 2 : Accepted from (7.8, 8) to (10, 5.25), Line 3 : Rejected, , Cohen-Sutherland algorithm divides a two-dimensional space into 9 regions and then, efficiently determines the lines and portions of lines that are inside the given, rectangular area., The algorithm can be outlines as follows:Nine regions are created, eight "outside" regions and one, "inside" region., , For a given line extreme point (x, y), we can quickly, find its region's four bit code. Four bit code can, be computed by comparing x and y with four values, (x_min, x_max, y_min and y_max)., , If x is less than x_min then bit number 1 is set., If x is greater than x_max then bit number 2 is set., If y is less than y_min then bit number 3 is set., If y is greater than y_max then bit number 4 is set, , Video Lectures @ https://www.youtube.com/TirupParmar & Notes @ https://t.me/bscit, , https://E-next.in, , Page 58
Page 57 :
Prof. Tirup Parmar, , There are three possible cases for any given line., 1. Completely inside the given rectangle : Bitwise OR of region of two end points of line is 0, (Both points are inside the rectangle), 2. Completely outside the given rectangle : Both endpoints share at least one outside region, which implies that the line does not cross the visible region. (bitwise AND of endpoints != 0)., 3. Partially inside the window : Both endpoints are in different regions. In this case, the, algorithm finds one of the two points that is outside the rectangular region. The intersection of, the line from outside point and rectangular window becomes new corner point and the, algorithm repeats, , Video Lectures @ https://www.youtube.com/TirupParmar & Notes @ https://t.me/bscit, , https://E-next.in, , Page 59
Page 58 :
Prof. Tirup Parmar, , Pseudo Code:, Step 1 : Assign a region code for two endpoints of given line., Step 2 : If both endpoints have a region code 0000, then given line is completely inside., Step 3 : Else, perform the logical AND operation for both region codes., Step 3.1 : If the result is not 0000, then given line is completely, outside., Step 3.2 : Else line is partially inside., Step 3.2.1 : Choose an endpoint of the line, that is outside the given rectangle., Step 3.2.2 : Find the intersection point of the, rectangular boundary (based on region code)., Step 3.2.3 : Replace endpoint with the intersection point, and update the region code., Step 3.2.4 : Repeat step 2 until we find a clipped line either, trivially accepted or trivially rejected., Step 4 : Repeat step 1 for other lines, , Below is implementation of above steps., // C++ program to implement Cohen Sutherland algorithm, // for line clipping., #include <iostream>, using namespace std;, , Video Lectures @ https://www.youtube.com/TirupParmar & Notes @ https://t.me/bscit, , https://E-next.in, , Page 60
Page 59 :
Prof. Tirup Parmar, // Defining region codes, const int INSIDE = 0; // 0000, const int LEFT = 1;, // 0001, const int RIGHT = 2; // 0010, const int BOTTOM = 4; // 0100, const int TOP = 8;, // 1000, // Defining x_max, y_max and x_min, y_min for, // clipping rectangle. Since diagonal points are, // enough to define a rectangle, const int x_max = 10;, const int y_max = 8;, const int x_min = 4;, const int y_min = 4;, // Function to compute region code for a point(x, y), int computeCode(double x, double y), {, // initialized as being inside, int code = INSIDE;, if (x < x_min), code |= LEFT;, else if (x > x_max), code |= RIGHT;, if (y < y_min), code |= BOTTOM;, else if (y > y_max), code |= TOP;, , // to the left of rectangle, // to the right of rectangle, // below the rectangle, // above the rectangle, , return code;, }, , Clipping Polygons, An algorithm that clips a polygon must deal with many different cases. The case is particularly, note worthy in that the concave polygon is clipped into two separate polygons. All in all, the task, of clipping seems rather complex. Each edge of the polygon must be tested against each edge of, the clip rectangle; new edges must be added, and existing edges must be discarded, retained, or, divided. Multiple polygons may result from clipping a single polygon. We need an organized, way to deal with all these cases., The following example illustrate a simple case of polygon clipping., Sutherland and Hodgman's polygon-clipping algorithm uses a divide-and-conquer strategy: It, solves a series of simple and identical problems that, when combined, solve the overall problem., The simple problem is to clip a polygon against a single infinite clip edge. Four clip edges, each, defining one boundary of the clip rectangle, successively clip a polygon against a clip rectangle., , Video Lectures @ https://www.youtube.com/TirupParmar & Notes @ https://t.me/bscit, , https://E-next.in, , Page 61
Page 60 :
Prof. Tirup Parmar, Note the difference between this strategy for a polygon and the Cohen-Sutherland algorithm for, clipping a line: The polygon clipper clips against four edges in succession, whereas the line, clipper tests the outcode to see which edge is crossed, and clips only when necessary., , Steps of Sutherland-Hodgman's polygon-clipping algorithm, , , , , , Polygons can be clipped against each edge of the window one at a time. Windows/edge, intersections, if any, are easy to find since the X or Y coordinates are already known., Vertices which are kept after clipping against one window edge are saved for clipping, against the remaining edges., Note that the number of vertices usually changes and will often increases., We are using the Divide and Conquer approach., , Step by step example of polygon clipping, The original polygon and the clip rectangle, , After clipped by the right clip boundary, , Video Lectures @ https://www.youtube.com/TirupParmar & Notes @ https://t.me/bscit, , https://E-next.in, , Page 62
Page 61 :
Prof. Tirup Parmar, After clipped by the right and bottom, clip boundaries., , After clipped by the right, bottom, and, left clip boundaries., , After clipped by all four boundaries., , Video Lectures @ https://www.youtube.com/TirupParmar & Notes @ https://t.me/bscit, , https://E-next.in, , Page 63