Notes of Second PUC, Economics 2PUC Economics 5th Chapter notes.pdf - Study Material
Page 1 :
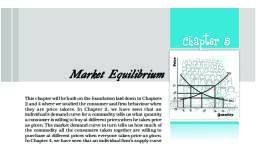
Market Equilibrium, , , , , , An equilibrium i s a situati, Cy um is defined as a situation where the plans of all consumers and firms in the market match and the, market clears,, , In equilibrium market supply equals to market demand (q? = q*), , Equilibrium price: The price at which equilibrium of quantity demand and quantity. Supply is reached is called, equilibrium price. oa aes ot, , Equilibrium quantity: The quantity bought and sold at equilibrium price is called equilibrium quantity., q?(P) =q5(P), , , , Excess supply: In a given price if market supply is greater than market demand (q* >q") this situation is called, excess supply, , Excess demand: In a given price if market demand exceeds market supply (q >q°) this situation is called excess, demand., , Market Equilibrium: Fixed Number of firms, , Market equilibrium means a state of rest. It is a position from which there will not be a tendency to move or change, in either direction. At equilibrium price, quantity of demand and supply will be equal. Both the buyers and séllers, objectives are satisfied., , In the perfectly competitive market with a fixed number of firms. The price of a product is determined by its supply, and demand forces. This is called as ‘price mechanism’. Prof Adam Smith calls this price mechanism as invisible, hand’. If there is any imbalances invisible hand directs and guides both the producers and the consumers towards, equilibrium., , The following diagram jllustrates equilibrium for a perfectly competitive market.
Page 2 :
67, , ss, , , , , , Price, 0, , DD, , , , Pi, , , , , , , , , , , , , , , , , , oO a q q 4, Quantity, , , , In the above diagram OX axis represents quantity demand and supply and OY axis represents the price level., quilibrium occurs at the intersection of the market demand curve DD and market supply curve SSi in the point E., The equilibrium quantity is q and equilibrium price is P., , , , price falls to OP to OP; quantity of demand exceeds to quantity of supply (Oqy > Oqi) as a result market price, , would tend to increase. This continues until demand equals to supply. (Qd = Qs), , If price increases from OP to OP, quantity of supply exceeds to quantity of demand (Og; > Oqz) as a result market, price would tend to decrease. Once again equilibrium can be achieved in ‘E’ point., , epee, Thus if price is above or below the equilibrium price. The invisible hand will operate to bring the price to the level, which the quantity supplied will be equal to quantity demanded., , , , To understand the equilibrium price and quantity determination following example is useful., , xample: A market consisting of identical firms producing same quantity of wheat. Suppose the market demand, , , , ve and wheat supply curve for wheat are given as, , , , , =200-P for O<P<200, , for P>200, , for P210, , for O<P<10 then, , , , Equilibrium price °, , Market supply = market demand, , Qs =Q,, , 120+P = 200-P * oe, P+P= 200-120, , 2P = 80, , peed, 2, , P= 40, , i PU Economics, , , , Student's illuminator
Page 3 :
aot Eun, , 68 Ma, , , , (b) Substitute the value of equilibrium price to equilibrium quantity., , , , , , , , , , , , , , , , , , , , , , , , , , , , , , , , , , , , Equilibrium supply Equilibrium demand, , q, =120+P qy = 200-P, , =120+40 = 200-40, , qs =160 q, = 160), , (c) If the market price is greater than equilibrium price say P = 45, , qu = 200-P qs =120+P, , = 200-45 = 120445, Qa =155 qs =165 |, * 14s > Ga |, , , , , , , , (d) If the market price is less than equilibrium price say P = 25., , , , , , , , , , , , , , , , , , |, , |, , a= 200;.P q, =120+P, = }, = 200-25 - = 120425 |, g=175 4, =145 |, * Ga > 4s t, , , , , , , , For the above example it is clear that for any price greater than Rs. 40 leads to excess supply (q* >q") and at any |, , price lower than Rs. 40 leads to excess demand (q‘ >q°)., , Wage determination in labour market, In the labour market, households are the suppliers of labour and demand for labour comes from firms, , The wage rate is determined at the intersection of the demand and supply curve, s of labour whi :, and supply of labor balance. ere the demand for, , Wage rate (W): The extra cost of hiring one more unit of labour is called wage rate., , Marginal product of labour (MP1), The extra output produced by one more unit of labour i, , product of labour., , is called marginal, , Marginal Revenue Product of Labor (MRP.), , An additional benefit equal to marginal revenue times, , is called marginal revenue product of labour (MRP;), , marginal product, , |, |, f, j, |, t, i, |, f, i, |, |, |, , ie, | MRP,=MRXMP,, , W=MRP,, , , , In perfectly competitive firm MRP, = VRP,, , , , t, Labour (hrs)
Page 4 :
~ Jeevith Publications . oO, , ~ As shown in the diagram D, is demand for labour which is downward sloping curve and S;, is supply of labour, - which is upward sloping. The equilibrium wage rate is determined at the point where these two curves interest., , - Shifts in Demand and Supply, ~ With changes in one or more of the factors which determined demand and supply the supply or the demand curve, - or both may shift there by affecting the equilibrium price and quantity., , _ Shift in Demand its effect on equilibrium price, (1) Increase in demand: If there is increase in demand, Keeping supply unchanged equilibrium point will shift to, , ight. Asa result equilibrium quantity and price both will increase., , , , , , , , , , , , , , , , , , aeeght ry, SS,, i G, i Pi, g |tN,, ™ Dp,, DD,, =>, i509, x, 0 % 4 qs, , Quantity, , FE, , " (2) Decrease in demand: If there is decrease in demand keeping supply unchanged demand curve and equilibrium, , = point will shift to left. As a result equilibrium quantity and price both will decrease., , , , , , , , , , , , , , , , , , ¥, b, . SS,, . — E, Po, 8 4 F, z Py, DD,, <_, DD,, x, 0 q "4, Quantity, , ; Shift in supply and its effect on equilibrium price, F (1) Increase in supply: If there is increase in supply. Keeping demand unchanged. Supply curve and equilibrium, point will shift to right. As a result equilibrium quantity will increase and price will decrease. ., , PU Economics
Page 5 :
70, , (2) Decrease in supply, , Price, , , , , , , , , , , , , , , , Y¥, SS,, SS,, E, Po, J F, PB, DD,, Oo % q q'5, Quantity, , IvtarKet Equip, \, , If there is decrease in supply keeping demand unchanged. Supply curve and equilibrium point shift to left, 4;,, result equilibrium quantity will decrease and price will increase., , Price, , , , , , , , , , , , , , , , Y, SS,, Pi 2 SS,, 1 E, Po, _—, DD,, ° qa % a, Quantity, , Simultaneous shifts of supply and demand and its impact on equilibrium, , Impact of simultaneous shifts on equilibrium, , , , , , , , , , , , , , , , , , , , , , , , , , , , , , , , Sl. Shift in Shift in Quantity ., No. demand supply ¥ Price, 1. Left ward Leftward Decreases May increase decrease or rem!, unchanged., 2, Right ward Right ward Increases May increase; decrease or rem#!, unchanged., 3. Left ward Right ward May increase decrease, or remain | Decreases, unchanged,, 4. Right ward Left ward May increase decrease or remain | Increase, unchanged. _, 2, Student's iiluminator 1 Pu Econom
 Learn better on this topic