Page 1 :
13, , Motion and Time, , I, , n Class VI, you learnt about different, types of motions. You learnt that a, motion could be along a straight line,, it could be circular or periodic. Can you, recall these three types of motions?, Table 13.1 gives some common, examples of motions. Identify the type, of motion in each case., Table 13.1 Some examples of, different types of motion, Example of, , Type of motion, , motion, , Along a straight, line/circular/, periodic, , 13.1 SLOW OR FAST, We know that some vehicles move faster, than others. Even the same vehicle may, move faster or slower at different times., Make a list of ten objects moving along, a straight path. Group the motion of, these objects as slow and fast. How did, you decide which object is moving slow, and which one is moving fast?, If vehicles are moving on a road in, the same direction, we can easily tell, which one of them is moving faster than, the other. Let us look at the motion of, vehicles moving on a road., , Activity 13.1, , Soldiers in a, march past, Bullock cart, moving on a, straight road, Hands of an, athlete in a race, Pedal of a bicycle, in motion, Motion of the Earth, around the Sun, Motion of a swing, Motion of a, pendulum, , It is common experience that the, motion of some objects is slow while that, of some others is fast., , Look at Fig. 13.1. It shows the position, of some vehicles moving on a road in, the same direction at some instant of, time. Now look at Fig. 13.2. It shows the, position of the same vehicles after some, time. From your observation of the two, figures, answer the following questions:, Which vehicle is moving the fastest, of all? Which one of them is moving the, slowest of all?, The distance moved by objects in a, given interval of time can help us to, decide which one is faster or slower. For, example, imagine that you have gone to, see off your friend at the bus stand., Suppose you start pedalling your bicycle, at the same time as the bus begins to, , 2020-21
Page 2 :
it is easy to decide whose speed, is the highest. One who takes, shortest time to cover the, distance of 100 metres has the, highest speed., , 13.2 SPEED, , Fig. 13.1 Vehicles moving in the same, direction on a road, , Fig. 13.2 Position of vehicles shown in, Fig. 13.1 after some time, , move. The distance covered by you after, 5 minutes would be much smaller than, that covered by the bus. Would you say, that the bus is moving faster than the, bicycle?, We often say that the faster vehicle, has a higher speed. In a 100-metre race, , You are probably familiar with, the word speed. In the, examples given above, a higher, speed seems to indicate that a, given distance has been, covered in a shorter time, or a, larger distance covered in a, given time., The most convenient way to, find out which of the two or, more objects is moving faster, is to compare the distances, moved by them in a unit time., Thus, if we know the distance, covered by two buses in one, hour, we can tell which one is, faster. We call the distance, covered by an object in a unit, time as the speed of the object., When we say that a car is, moving with a speed of 50, kilometres per hour, it implies, that it will cover a distance of, 50 kilometres in one hour. However, a, car seldom moves with a constant speed, for one hour. In fact, it starts moving, slowly and then picks up speed. So,, when we say that the car has a speed of, 50 kilometres per hour, we usually, consider only the total distance covered, by it in one hour. We do not bother, whether the car has been moving with, , 144, , SCIENCE, , 2020-21
Page 3 :
a constant speed or not during that, hour. The speed calculated here is, actually the average speed of the car. In, this book we shall use the term speed, for average speed. So, for us the speed, is the total distance covered divided, by the total time taken. Thus,, Speed =, , Total distance covered, Total time taken, , In everyday life we seldom find objects, moving with a constant speed over long, distances or for long durations of time., If the speed of an object moving along, a straight line keeps changing, its, motion is said to be non-uniform. On, the other hand, an object moving along, a straight line with a constant speed, is said to be in uniform motion. In, this case, the average speed is the, same as the actual speed., , they found that the sun rises everyday, in the morning. The time between one, sunrise and the next was called a day., Similarly, a month was measured from, one new moon to the next. A year was, fixed as the time taken by the earth to, complete one revolution of the sun., Often we need to measure intervals, of time which are much shorter than a, day. Clocks or watches are perhaps the, most common time measuring devices., Have you ever wondered how clocks and, watches measure time?, The working of clocks is rather, complex. But all of them make use of, some periodic motion. One of the most, well-known periodic motions is that of, a simple pendulum., , We can determine the speed of a given, object once we can measure the time, taken by it to cover a certain distance., In Class VI you learnt how to measure, distances. But, how do we measure, time? Let us find out., , 13.3 MEASUREMENT, , OF, , TIME, , If you did not have a clock, how would, you decide what time of the day it is?, Have you ever wondered how our elders, could tell the approximate time of the, day by just looking at shadows?, How do we measure time interval of, a month? A year?, Our ancestors noticed that many, events in nature repeat themselves after, definite intervals of time. For example,, MOTION, , AND, , T IME, , (a) Wall clock, , (b) Table clock, , (c) Digital clock, Fig. 13.3 Some common clocks, 145, , 2020-21
Page 4 :
to A, to B and back to O. The, pendulum also completes one, oscillation when its bob moves, from one extreme position A to the, other extreme position B and, comes back to A. The time taken, by the pendulum to complete one, oscillation is called its time, period., , Activity 13.2, Set up a simple pendulum as, shown in Fig. 13.4 (a) with a, thread or string of length nearly, one metre. Switch off any fans, nearby. Let the bob of the, pendulum come to rest at its, A, B, mean position. Mark the mean, O, position of the bob on the floor, below it or on the wall behind it., Fig. 13.4 (a) A simple, Fig. 13.4 (b) Different, To measure the time period of, pendulum, positions of the bob of an, the pendulum we will need, oscillating simple pendulum, a stopwatch. However, if a, stopwatch is not available, a table, A simple pendulum consists of a, clock or a wristwatch can be used., small metallic ball or a piece of stone, To set the pendulum in motion,, suspended from a rigid stand by a, gently hold the bob and move it slightly, thread [Fig. 13.4 (a)]. The metallic ball, to one side. Make sure that the string, is called the bob of the pendulum., attached to the bob is taut while you, Fig. 13.4 (a) shows the pendulum at, displace it. Now release the bob from its, rest in its mean position. When the bob, displaced position. Remember that the, of the pendulum is released after taking, bob is not to be pushed when it is, it slightly to one side, it begins to move, released. Note the time on the clock, to and fro [Fig. 13.4 (b)]. The to and fro, when the bob is at its mean position., motion of a simple pendulum is an, Instead of the mean position you may, example of a periodic or an oscillatory, note the time when the bob is at one of, motion., The pendulum is said to have, its extreme positions. Measure the time, the pendulum takes to complete 20, completed one oscillation when its bob,, starting from its mean position O, moves, oscillations. Record your observations, 146, , SCIENCE, , 2020-21
Page 5 :
in Table 13.2. The first observation, shown is just a sample. Your, observations could be different from, this. Repeat this activity a few times and, record your observations. By dividing, the time taken for 20 oscillations by 20,, get the time taken for one oscillation, or, the time period of the pendulum., Is the time period of your pendulum, nearly the same in all cases?, Note that a slight change in the, initial displacement does not affect the, time period of your pendulum., Nowadays most clocks or watches, have an electric circuit with one or more, Table 13.2 Time period of a simple, pendulum, Length of the string = 100 cm, S.No. Time taken for 20 Time period, oscillations (s), (s), 1., , 42, , 2., 3., , 2.1, , cells. These clocks are called quartz, clocks. The time measured by quartz, clocks is much more accurate than that, by the clocks available earlier., , Units of time and speed, The basic unit of time is a second. Its, symbol is s. Larger units of time are, minutes (min) and hours (h). You, already know how these units are related, to one another., What would be the basic unit of, speed?, Since the speed is distance/time, the, basic unit of speed is m/s. Of course, it, could also be expressed in other units, such as m/min or km/h., You must remember that the, symbols of all units are written in, singular. For example, we write 50 km, and not 50 kms, or 8 cm and not 8 cms., Boojho is wondering how many, seconds there are in a day and how, many hours in a year. Can you help, him?, , There is an interesting story about the discovery that the time period of a given, pendulum is constant. You might have heard the name of famous scientist, Galileo Galilie (A.D. 1564 –1642). It is said that once Galileo was sitting in a, church. He noticed that a lamp suspended from the ceiling with a chain was, moving slowly from one side to the other. He was surprised to find that his, pulse beat the same number of times during the interval in which the lamp, completed one oscillation. Galileo experimented with various pendulums to, verify his observation. He found that a pendulum of a given length takes always, the same time to complete one oscillation. This observation led to the, development of pendulum clocks. Winding clocks and wristwatches were, refinements of the pendulum clocks., MOTION, , AND, , T IME, , 147, , 2020-21
Page 6 :
Different units of time are used, depending on the need. For example, it, is convenient to express your age in, years rather than in days or hours., Similarly, it will not be wise to express, in years the time taken by you to cover, the distance between your home and, your school., How small or large is a time interval, of one second? The time taken in saying, aloud “two thousand and one” is nearby, one second. Verify it by counting aloud, from "two thousand and one" to "two, thousand and ten". The pulse of a, normal healthy adult at rest beats about, 72 times in a minute that is about 12, times in 10 seconds. This rate may be, slightly higher for children., , Paheli wondered how time was, measured when pendulum, clocks were not available., , Many time measuring devices were, used in different parts of the world before, the pendulum clocks became popular., Sundials, water clocks and sand clocks, are some examples of such devices., Different designs of these devices were, developed in different parts of the world, (Fig. 13.5)., , 13.4 MEASURING SPEED, Having learnt how to measure time and, distance, you can calculate the speed of, an object. Let us find the speed of a ball, moving along the ground., , Activity 13.3, Draw a straight line on the ground with, chalk powder or lime and ask one of, your friends to stand 1 to 2 m away from, it. Let your friend gently roll a ball along, the ground in a direction perpendicular, to the line. Note the time at the moment, the ball crosses the line and also when, it comes to rest (Fig. 13.6). How much, time does the ball take to come to rest?, , The smallest time interval that can be measured with commonly available, clocks and watches is one second. However, now special clocks are available, that can measure time intervals smaller than a second. Some of these clocks, can measure time intervals as small as one millionth or even one billionth of a, second. You might have heard the terms like microsecond and nanosecond., One microsecond is one millionth of a second. A nanosecond is one billionth, of a second. Clocks that measure such small time intervals are used for scientific, research. The time measuring devices used in sports can measure time intervals, that are one tenth or one hundredth of a second. On the other hand, times of, historical events are stated in terms of centuries or millenniums. The ages of, stars and planet are often expressed in billions of years. Can you imagine the, range of time intervals that we have to deal with?, , 148, , SCIENCE, , 2020-21
Page 7 :
(b) Sand clock, , (c) Water clock, , (a) Sundial at Jantar Mantar, Delhi, Fig. 13.5 Some ancient time-measuring devices, , Fig. 13.6 Measuring the speed of a ball, MOTION, , AND, , Measure the distance between the point, at which the ball crosses the line and, the point where it comes to rest. You, can use a scale or a measuring, tape. Let different groups repeat the, activity. Record the measurements in, Table 13.3. In each case calculate the, speed of the ball., You may now like to compare your, speed of walking or cycling with that of, your friends. You need to know the, distance of the school from your home, or from some other point. Each one of, you can then measure the time taken, to cover that distance and calculate your, speed. It may be interesting to know who, amongst you is the fastest. Speeds of, some living organisms are given in, , T IME, , 149, , 2020-21
Page 8 :
Table 13.3 Distance moved and time taken by a moving ball, Name of the group, , Distance moved by, the ball (m), , Table 13.4, in km/h. You can calculate, the speeds in m/s yourself., Rockets, launching satellites into, earth’s orbit, often attain speeds up to, 8 km/s. On the other hand, a tortoise, can move only with a speed of about 8, cm/s. Can you calculate how fast is the, rocket compared with the tortoise?, Once you know the speed of an, object, you can find the distance moved, by it in a given time. All you have to do, is to multiply the speed by time. Thus,, Distance covered = Speed × Time, You can also find the time an object, would take to cover a distance while, moving with a given speed., , Time taken (s), , Speed = Distance/, Time taken (m/s), , Time taken = Distance/Speed, , Boojho wants to know, whether there is any device, that measures the speed., You might have seen a meter fitted, on top of a scooter or a motorcycle., Similarly, meters can be seen on the, dashboards of cars, buses and other, vehicles. Fig. 13.7 shows the dashboard, of a car. Note that one of the meters has, km/h written at one corner. This is, called a speedometer. It records the, , Table 13.4 Fastest speed that some animals can attain, S. No., , Name of the object, , 1., , Falcon, , 2., 3., 4., 5., 6., 7., 8., 9., , Cheetah, Blue fish, Rabbit, Squirrel, Domestic mouse, Human, Giant tortoise, Snail, , Speed in km/h, , Speed in m/s, , 320, , 320 × 10 0 0, 60 × 60, , 112, 40 – 46, 56, 19, 11, 40, 0.27, 0.05, , 150, , SCIENCE, , 2020-21
Page 9 :
13.5 DISTANCE-TIME GRAPH, You might have seen that newspapers,, magazines, etc., present information in, various forms of graphs to make it, Table 13.5 Odometer reading at, different times of the journey, , Fig. 13.7 The dashboard of a car, , speed directly in km/h. There is also, another meter that measures the, distance moved by the vehicle. This, meter is known as an odometer., While going for a school picnic, Paheli, decided to note the reading on the, odometer of the bus after every, 30 minutes till the end of the journey., Later on she recorded her readings in, Table 13.5., Can you tell how far was the picnic, spot from the school? Can you calculate, the speed of the bus? Looking at the, Table, Boojho asked Paheli whether she, can tell how far they would have, travelled till 9:45 AM. Paheli had no, answer to this question. They went to, their teacher. She told them that one, way to solve this problem is to plot a, distance-time graph. Let us find out how, such a graph is plotted., MOTION, , AND, , Time, (AM), , Odometer, reading, , Distance from, the starting, point, , 8:00 AM, , 36540 km, , 0 km, , 8:30 AM, , 36560 km, , 20 km, , 9:00 AM, , 36580 km, , 40 km, , 9:30 AM, , 36600 km, , 60 km, , 10:00 AM 36620 km, , 80 km, , Fig. 13.8 A bar graph showing runs scored by, a team in each over, , interesting. The type of graph shown in, Fig. 13.8 is known as a bar graph., Another type of graphical representation, is a pie chart (Fig. 13.9). The graph, shown in Fig. 13.10 is an example of a, line graph. The distance-time graph is a, line graph. Let us learn to make such a, graph., , T IME, , 151, , 2020-21
Page 10 :
Oxygen, , Y, , Other gases, , X, , X, , O, , Nitrogen, Fig. 13.9 A pie chart showing composition, of air, 80, , Y, Fig. 13.11 x-axis and y-axis on a graph paper, , Y, , Therefore, we shall use only the shaded, part of the graph shown in Fig. 13.11., Boojho and Paheli found out the, distance travelled by a car and the time, taken by it to cover that distance. Their, data is shown in Table 13.6., , 70, , Weight (in kg), , 60, 50, 40, 30, 20, 10, , X, 2, , 4, , 6, , 8, , 10, , 12, , 14, , 16, , 18, , 20, , Table 13.6 The motion of a car, , 22, , Age (in year), , S. No., Fig. 13.10 A line graph showing change in, weight of a man with age, , Take a sheet of graph paper. Draw, two lines perpendicular to each other, on it, as shown in Fig. 13.11. Mark the, horizontal line as XOX'. It is known as, the x-axis. Similarly mark the vertical, line YOY'. It is called the y-axis. The point, of intersection of XOX' and YOY' is, known as the origin O. The two, quantities between which the graph is, drawn are shown along these two axes., We show the positive values on the, x-axis along OX. Similarly, positive, values on the y-axis are shown along, OY. In this chapter we shall consider, only the positive values of quantities., , Time (min.), , Distance (km), , 1., , 0, , 0, , 2., , 1, , 1, , 3., , 2, , 2, , 4., , 3, , 3, , 5., , 4, , 4, , 6., , 5, , 5, , You can make the graph by following, the steps given below:, § Draw two perpendicular lines to, represent the two axes and mark, them as OX and OY as in Fig. 13.11., § Decide the quantity to be shown, along the x-axis and that to be, shown along the y-axis. In this case, , 152, , SCIENCE, , 2020-21
Page 11 :
§, , §, , §, , we show the time along the x-axis, and the distance along the y-axis., Choose a scale to represent the, distance and another to represent, the time on the graph. For the motion, of the car scales could be, Time: 1 min = 1 cm, Distance: 1 km = 1 cm, Mark values for the time and the, distance on the respective axes, according to the scale you have, chosen. For the motion of the car, mark the time 1 min, 2 min, … on, the x-axis from the origin O., Similarly, mark the distance 1 km,, 2 km … on the y-axis (Fig. 13.12)., Now you have to mark the points on, the graph paper to represent each, set of values for distance and time., Observation recorded at S. No. 1, in Table 13.6 shows that at time, 0 min the distance moved is also, zero. The point corresponding to this, set of values on the graph will, therefore be the origin itself. After 1, minute, the car has moved a distance, of 1 km. To mark this set of values, look for the point that represents, 1 minute on the x-axis. Draw a line, parallel to the y-axis at this point., Then draw a line parallel to the, x-axis from the point corresponding, to distance 1 km on the y-axis. The, point where these two lines, intersect represents this set of values, on the graph (Fig. 13.12). Similarly,, mark on the graph paper the, points corresponding to different, sets of values., , MOTION, , AND, , Y, , O, , X, , Fig. 13.12 Making a graph, Y, , O, , X, , Fig. 13.13 Making a graph, , §, , §, , §, , T IME, , Fig. 13.12 shows the set of points on, the graph corresponding to positions, of the car at various times., Join all the points on the graph as, shown in Fig. 13.13. It is a straight, line. This is the distance-time graph, for the motion of the car., If the distance-time graph is a, straight line, it indicates that the, object is moving with a constant, speed. However, if the speed of the, object keeps changing, the graph can, be of any other shape., 153, , 2020-21
Page 12 :
Y, , X, , Fig. 13.14 Distance-time graph of the bus, , Generally, the choice of scales is not, as simple as in the example given in Fig., 13.12 and 13.13. We may have to choose, two different scales to represent the, desired quantities on the x-axis and the, y-axis. Let us try to understand this, process with an example., Let us again consider the motion of, the bus that took Paheli and her friends, to the picnic. The distance covered and, time taken by the bus are shown in, Table 13.5. The total distance covered, by the bus is 80 km. If we decide to, choose a scale 1 km = 1 cm, we shall, have to draw an axis of length 80 cm., This is not possible on a sheet of paper., On the other hand, a scale 10 km = 1, cm would require an axis of length only, 8 cm. This scale is quite convenient., However, the graph may cover only a, small part of the graph paper. Some of, the points to be kept in mind while, choosing the most suitable scale for, drawing a graph are:, , the difference between the highest, and the lowest values of each, quantity., § the intermediate values of each, quantity, so that with the scale, chosen it is convenient to mark the, values on the graph, and, § to utilise the maximum part of the, paper on which the graph is to be, drawn., Suppose that you are given a graph, paper of size 25 cm × 25 cm. One of the, scales which meets the above conditions, and can accommodate the data of Table, 13.5 could be, Distance: 5 km = 1 cm, and, Time: 6 min = 1 cm, Can you now draw the distance-time, graph for the motion of the bus? Is the, graph drawn by you similar to that, shown in Fig. 13.13?, Distance-time graphs provide a, variety of information about the motion, §, , 154, , SCIENCE, , 2020-21
Page 13 :
when compared to the data presented, by a table. For example, Table 13.5 gives, information about the distance moved, by the bus only at some definite time, intervals. On the other hand, from the, distance-time graph we can find the, distance moved by the bus at any, instant of time. Suppose we want to, know how much distance the bus had, travelled at 8:15 AM. We mark the point, corresponding to the time (8:15 AM) on, the x-axis (Fig. 13.14). Suppose this, point is A. Next we draw a line, perpendicular to the x-axis (or parallel, , to the y-axis) at point A. We then mark, the point, T, on the graph at which this, perpendicular line intersects it (Fig., 13.14). Next, we draw a line through the, point T parallel to the x-axis. This, intersects the y-axis at the point B. The, distance corresponding to the point B, on the y-axis, OB, gives us the distance, in km covered by the bus at 8:15 AM., How much is this distance in km? Can, you now help Paheli to find the distance, moved by the bus at 9:45 AM? Can you, also find the speed of the bus from its, distance-time graph?, , Keywords, Bar graph, Graphs, Non-uniform motion, , Oscillation, Simple pendulum, Speed, , Time period, Uniform motion, Unit of time, , What you have Learnt, , MOTION, , n, , The distance moved by an object in a unit time is called its speed., , n, , Speed of objects help us to decide which one is moving faster than the, other., , n, , The speed of an object is the distance travelled divided by the time taken, to cover that distance. Its basic unit is metre per second (m/s)., , n, , Periodic events are used for the measurement of time. Periodic motion of, a pendulum has been used to make clocks and watches., , n, , Motion of objects can be presented in pictorial form by their, distance-time graphs., , n, , The distance-time graph for the motion of an object moving with a constant, speed is a straight line., , AND, , T IME, , 155, , 2020-21
Page 14 :
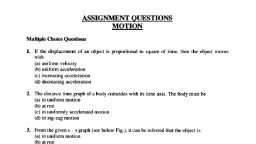
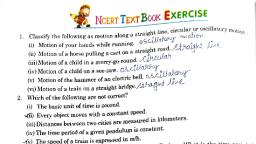
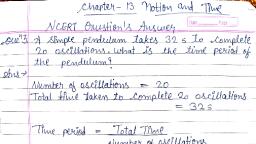
Exercises, 1. Classify the following as motion along a straight line, circular or, oscillatory motion:, (i), , Motion of your hands while running., , (ii), , Motion of a horse pulling a cart on a straight road., , (iii), , Motion of a child in a merry-go-round., , (iv), , Motion of a child on a see-saw., , (v), (vi), , Motion of the hammer of an electric bell., Motion of a train on a straight bridge., , 2. Which of the following are not correct?, (i), , The basic unit of time is second., , (ii), , Every object moves with a constant speed., , (iii), , Distances between two cities are measured in kilometres., , (iv), , The time period of a given pendulum is constant., , (v), , The speed of a train is expressed in m/h., , 3. A simple pendulum takes 32 s to complete 20 oscillations. What is the, time period of the pendulum?, 4. The distance between two stations is 240 km. A train takes 4 hours to, cover this distance. Calculate the speed of the train., 5. The odometer of a car reads 57321.0 km when the clock shows the time, 08:30 AM. What is the distance moved by the car, if at 08:50 AM, the, odometer reading has changed to 57336.0 km? Calculate the speed of, the car in km/min during this time. Express the speed in km/h also., 6. Salma takes 15 minutes from her house to reach her school on a, bicycle. If the bicycle has a speed of 2 m/s, calculate the distance, between her house and the school., 7. Show the shape of the distance-time graph for the motion in the, following cases:, (i), , A car moving with a constant speed., , (ii), , A car parked on a side road., , 8. Which of the following relations is correct?, (i), (iii), , (ii), , Speed =, , Distance, Time, , (iv), , Speed =, , 1, Distance × Time, , Speed = Distance × Time, Speed =, , Time, Distance, , 156, , SCIENCE, , 2020-21
Page 15 :
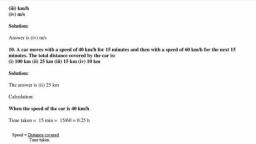
9. The basic unit of speed is:, (i), (iii), , km/min, , (ii), , m/min, , km/h, , (iv), , m/s, , 10. A car moves with a speed of 40 km/h for 15 minutes and then with a, speed of 60 km/h for the next 15 minutes. The total distance covered by, the car is:, (i), , 100 km, , (ii), , 25 km, , (iii), , 15 km, , (iv), , 10 km, , 11. Suppose the two photographs, shown in Fig. 13.1 and Fig. 13.2, had, been taken at an interval of 10 seconds. If a distance of 100 metres, is shown by 1 cm in these photographs, calculate the speed of the, fastest car., 12. Fig. 13.15 shows the distance-time graph for the motion of two vehicles, A and B. Which one of them is moving faster?, , Fig. 13.15 Distance-time graph for the motion of two cars, 13. Which of the following distance-time graphs shows a truck moving with, speed which is not constant?, , (i), , MOTION, , AND, , (ii), , T IME, , 157, , 2020-21
Page 16 :
(iii), , (iv), , Extend Learning — Activities and Projects, 1. You can make your own sundial and use it to mark the time of the day, at your place. First of all find the latitude of your city with the help of an, atlas. Cut out a triangular piece of a cardboard such that its one angle, is equal to the latitude of your place and the angle opposite to it is a, right angle. Fix this piece, called gnomon, vertically along a diameter of, a circular board a shown in Fig. 13.16. One way to fix the gnomon could, be to make a groove along a diameter on the circular board., Next, select an open space, which receives sunlight for most of the day., Mark a line on the ground along the North-South direction. Place the, sundial in the sun as shown in Fig. 13.16. Mark the position of the tip, of the shadow of the gnomon on the circular board as early in the day, as possible, say 8:00 AM. Mark the position of the tip of the shadow, every hour throughout the day. Draw lines to connect each point marked, by you with the centre of the base of the gnomon as shown in Fig. 13.16., Extend the lines on the circular board up to its periphery. You can use, this sundial to read the time of the day at your place. Remember that, the gnomon should always be placed in the North-South direction as, shown in Fig. 13.16., , Fig. 13.16, 158, , SCIENCE, , 2020-21
Page 17 :
2. Collect information about time-measuring devices that were used in, the ancient times in different parts of the world. Prepare a brief write up, on each one of them. The write up may include the name of the device,, the place of its origin, the period when it was used, the unit in which, the time was measured by it and a drawing or a photograph of the, device, if available., 3. Make a model of a sand clock which can measure a time interval of 2, minutes (Fig. 13.17)., , Fig. 13.17, 4. You can perform an interesting activity when you visit a park to ride a, swing. You will require a watch. Make the swing oscillate without, anyone sitting on it. Find its time period in the same way as you did for, the pendulum. Make sure that there are no jerks in the motion of the, swing. Ask one of your friends to sit on the swing. Push, it once and let it swing naturally. Again measure its time period., Repeat the activity with different persons sitting on the swing. Compare, the time period of the swing measured in different cases. What, conclusions do you draw from this activity?, , Did you know?, The time-keeping services in India are provided by the National Physical, Laboratory, New Delhi. The clock they use can measure time intervals, with an accuracy of one-millionth of a second. The most accurate clock, in the world has been developed by the National Institute of Standards, and Technology in the U.S.A. This clock will lose or gain one second after, running for 20 million years., , MOTION, , AND, , T IME, , 159, , 2020-21