Page 1 :
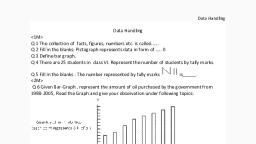
What have we discussed?, 1., , We have seen that data is a collection of numbers gathered to give some information., , 2., , To get a particular information from the given data quickly, the data can be arranged, in a tabular form using tally marks., , 3., , We learnt how, , a, , pictograph represents data in the form of pictures, objects or parts, , of objects. We have also seen how to interpret a pictograph and answer the related, questions. We have drawn pictographs using symbols to represent a certain number, of items or things. For example,, =100 books., 4., , We have discussed how to represent data by using a bar diagram or a bar graph. In, a bar graph, bars of uniform width are drawn horizontally or vertically with equal, spacing between them. The length of each bar gives the required information., , 5., , To do this, , we, , also discussed the process of, , choosing, , a, , scale for the, , graph., , For example, I unit = 100 students. We have also practised reading a given bar, , graph. We have seen how interpretations from the same can be made.
Page 2 :
1., , WHAT HAVE WE DIsCUSSED?, The collection, recording and presentation of data help us organise our experiences, , and draw inferences from them., 2. Before collecting data we need to know what we would use it for., 3. The data that is collected needs to be organised in a proper table, so that it becomes, easy to understand and interpret., 4. Average is a number that represents or shows the central tendency of a group of, observations or data., 5. Arithmetic mean is one of the representative values of data., , 6. Mode is another form of central tendency or representative value. The mode of a set, of observations is the observation that occurs most often., 7. Median is also a form of representative value. It refers to the value which lies in the, middle of the data with half of the observations above it and the other half below it., 8. A bar graph is a representation of numbers using bars of uniform widths., 9. Double bar graphs help to compare two collections of data at a glance., 10. There are situations in our life, that are certain to happen, some that are impossible, and some that may or may not happen. The situation that may or may not happen has, a chance of, happening
Page 3 :
WHAT HAVE WE DISCUSSED?, 1. Data mostly available to us in an unorganised form is called raw data., 2. In order to draw meaningful inferences from any data, we need to organise the data systematically, , 88MATHEMATICS, 3. Frequeney gives the number of times that a particular entry occurs., 4. Raw data can be 'grouped' and presented systematically through 'grouped frequency distribution'., 5., , Grouped, data can be presented using histogram. Histogram isatype of bar diagram, where the, class intervals are shown on the horizontal axis and the heights of the bars show the frequency of, the class interval. Also, there is no gap between the bars as there is no gap between the class, intervals., , 6. Data can also presented using circle graph or pie chart. A circle graph shows the relationship, between a whole and its part., , 7. There are certain experiments whose outcomes have an equal chance of occurring., 8. Arandom experiment is one whose outcome cannot be predicted exactly in advance., 9. Outcomes of an experiment are equally likely ifeach has the same chance, 10., , Probability of an, , of occurring., , Number of outcomes that make Cc, when the outcomes, Total number of outcomes of the experiment, , ure equally likely., , 1l. One or more outcomes of an experiment make an event., , 12. Chances and probability are related to real life.
Page 4 :
14.6 Summary, In this, , chapter, you, , have studied the, , following points:, , 1. Facts or figures, collected with a definite purpose, are called data., 2. Statistics is the area of study dealing with the presentation, analysis and interpretation of, data., , 3. How data can be presented graphically in the form of bar graphs, histograms and frequency, , polygons., 4. The three measures of central tendency for ungrouped data are:, ), , Mean: It is found by adding all the values of the observations and dividing it by the, , total number of observations. It is denoted by ., , So, * =, , (i), , For an ungrouped frequency distribution, it is X, , Median : It is the value of the middle-most observation (s)., , If n is an odd number, the median = value of the, , observation., , If n is an even number, median = Mean of the values of the, , observations., (i), , Mode: The mode is the most frequently occurring observation.