Page 1 :
Chapter 3, Organisation Of Data, Organization of data refers to the systematic, arrangement of collected figures (raw data), so that, the data becomes easy to understand and more, convenient for further statistical treatment ., RawData are those data which are collected by the, investigator. They are in their original form. They, are highly disorganized. The investigator has to, organize them in a classified form., A mass of data in its original form is called raw data., It is an unorganized mass of various items, Classification is the process of arranging data into, sequences and groups according to their common, characteristics of separating them in to different but, related parts., Characteristics of classification:, 1. Homogeneity, 2.Suitability, 3. Clarity
Page 2 :
4. Flexibility, 5. Diversification, Basis of classification:, Raw data can be classified as:, 1. Chronological classification: In such a, classification data are classified either in ascending, or in descending order with reference to time such, as years, quarters, months weeks etc., 2. Geographical/Spatial classification: The data are, classified with reference to geographical, location/place such as countries, states , cities,, districts, block etc., 3. Qualitative classification: Data are classified with, reference to descriptive characteristics like sex, caste,, religion literacy etc., They cannot be measured. Yet this attributes can be, classified on the basis of either the presence or the, absence of a qualitative characteristics., Such a classification of data on attributes is called a, qualitative classification.
Page 3 :
4. Quantitative classification: Data are classified on, the basis of some measurable characteristics such as, height, age, weight, income, marks of students., A variable is a characteristic which is capable of, being measured and capable of change in its value, from time to time., It is of two types., (a) Discrete, (b) Continuous, Discrete: Discrete variable are those variables that, increase in jumps or in complete numbers and are, not fractional. Ex.-number of student in a class could, be 2, 4, 10, 15,, 20, 25, etc. It does not take any, fractional value between them., Continuous variable: Continuous variables are, those variables that take a range of values and, increase continuously. i.e. integral value or, fractional value in a specified interval., Ex- Wages of workers in a factory.
Page 4 :
A frequency distribution is a comprehensive way to, classify raw data of a quantitative variable. It shows, how different values of a variable are distributed in, different classes along with their corresponding, class frequencies., The Class Mid-Point or Class Mark is the middle, value of a class. It lies halfway between the lower, class limit and the upper class limit of a class and, can be ascertained in the following manner., Class Mid-Point = Upper Class Limit + Lower, Class Limit / 2., How to prepare a frequency Distribution?, First we have to find out as to what extent the, variable in hand changes in value., Such variables are captured by its range., The Range is the difference between the, largest and the smallest values of a variable., A large range indicates that the values of the, variable are widely spread., A small range indicates that the values of, the variable are spread narrowly.
Page 5 :
After obtaining the value of range we determine, the number of classes., After deciding the number of classes it is easy to, determine the class interval. The decision of, number of classes and the class intervals are, interlinked with one another., The value of the upper class limit of a class is, obtained by adding the class interval with the, value of the lower class limit of that class., Class frequency: It means the number of values in a, particular class., Class width:- It is the difference between the upper, class limit and lower class limit, Class width = Upper Class Limit – Lower Class, Limit, 5. Class Limits:- There are two ends of a class. The, lowest value is called lower class limit and, highest value is called upper class limit., In exclusive method the upper class limit of one, class equals the lower class limit of the next, class. eg 0-10, 10-20.
Page 6 :
In this method the continuity of the data is, maintained., Under the exclusive method, the upper class, limit is excluded but the lower class limit of a, class is included in the next interval., Thus an observation that is exactly equal to the, upper class limit would not be included in that, class but would be included in the next class., In comparison to the exclusive method, the, inclusive method does not exclude the upper, class limit in a class interval. It includes the, upper class in a class. Thus both class limits are, parts of the class intervals e.g., 0-9, 10-19., The classification of data as a frequency, distribution has an inherent short coming., Frequency array, For a discrete variable, the classification of its data is, known as a Frequency Array
Page 7 :
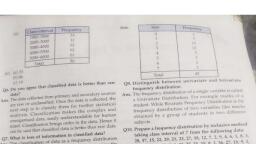
The difference between, Univariate and Bivariate Frequency distribution, Basis, , Univariate Freque, ncy distribution, , Bivariate Frequency distrib, ution, , When data is, classified on the, basis of single, variable,the, Meanin, distribution is, g, known as, univariate, frequency, distribution., , when data is classified on, the basis of two variables,, the distribution is known as, bivariate frequency, distribution., , Alterna, te, Name, , One-way, frequency, , Two-way frequency, , Exampl, e, , Height of students, in a class, , Height and weight of, students in a class
Page 8 :
Broadly statistical series are of two types., Types of series, 1. Individual series, 2. Frequency series, a. Discrete series Or frequency array, b. Frequency distribution or continuous series, Individual series are those series in which the, items are listed single. For example:, Sr. No., of workers, , Daily wages(in Rs.), , 1, , 25, , 2, , 50, , 3, , 35, , 4, , 40, , 5, , 20, , 6, , 45
Page 9 :
A discrete series or frequency array is that series in, which data are prescribed in a way that exact, measurements of items are clearly shown. The, example in following table illustrates a frequency, array., Frequency array of the size of household, Size of the, household, , Number of, household, (Frequency), , 1, , 5, , 2, , 15, , 3, , 25, , 4, , 35, , 5, , 10, , 6, , 5
Page 10 :
A continuous series: It is that series in which items, cannot be exactly measured. The items assume a, range of values and are placed within the range of, limits. In other words, data are classified into, different classes with a range, the range is called, class-intervals., Frequency distribution or continuous series, Marks, , Frequency, , 10-20, , 4, , 20-30, , 5, , 30-40, , 8, , 40-50, , 5, , 50-60, , 4, , 60-70, , 3