Page 1 :
29, , Tabulation, , Chapter4, Tabulation, Outline: Presentation- Types- Basis of Classification, Characteristics, Classification of Numeric Data- Bivariate Frequency Distribution- Tabulation, , -, , Parts of Table- Rules to be Observed- Examples-Exercise., , Presentation of Data, , 4.1, , have seen how to collect the data about, The information is in the form of, the behaviour of a group., and schedules must, questionnaires and schedules. These questionnaires, contain erroneous data, some, be edited first. Some of them may, in some. We have to, contradictory statements might be present, In case of doubt we may be, determine which of the statements is correct., form. Even after this is done,, required to delete the whole questionnaire, them no conclusion, the data are very large and just by going through, it is difficult to see relations and patterns, can be drawn. For most people, of raw data must be, in raw data. The characteristics of a group, to make the data, summarized to make them comprehensible. Therefore,, This also, understandable and comparable, classification is necessary., In the, , previous chapter we, , basis for decision making. We classify the data, certain characteristics and tabulate the information., , provides, , a, , according, , to, , The data can be presented in any of the following forms. They may, be:, , incorporated in a paragraph of text., (ii) put into tabular form., , (i), , (ii) expressed graphically., G) Text Presentation, , whole, , to read the, It is not very effective since it is necessary, to, and most people will not be able, carefully,, very, paragraph, is an example of text, understand the data in this form easily. Following, , presentation.
Page 2 :
tics(BMS, V, , i, , p, , u, , l, , ', , s, , M, B, , u, , s, , i, , n, , e, , s, , s, S, , t, , a, , t, , i, , s, , t, , ing on a, , historical, , lac spectators visiting, , 30, , e, , A, , Survey, , day,, , particular, , and, , Comic, , Spectators, , amongst, , conducted, , was, , the, , criminal,, portion, , houses, , cinema, , f, , o, , i, , s, , under, , was, , survey, , seeing, , o, , n, , c, , i, , d, , a, , i, , l, , c, , a, , a, , t, , n, , e, , d, , i, , l, , m, , s, , w, , a, , the, , d, , h, , n u m b e r, , number, , The, , SIxteen,, four, was, these types, , seeing, , per, , ive, , male, , that, ale, The proportion, f iviewers, wers, inaicaeorical, It, It, wo., two., three to, omale, fen, social ana, of, criminal,, ctual, actual, , percentage, and eighteen., six, twenty-six, thousand, , two, , respeci, , so, , i, , s, , t, , o, , r, , i, , c, , a, , v, , h o u s a n dt w o, , of spectators, , thousand, , hundred, , of, , showing, , films., , mythological, , to fema, , lac s p e c i a i a l, , one, , and, , seven, , eight, , o, , o m a i n i n g, , twelve, c,t i v e l y . T h en b yforty, h u n d rp, ee, d, torty, , *on by, female, w e o r of, sandfourhundred., mythological, hundred., The nu, , respectively, see, hundred, were, , o, , f, f, , e, , m, , a, , l, , e, , ber, , m y t h o l o g i c a l, , mic and, comic, , spectators., films, namely, types of, the male, cent of, , thousand, , cent, , and, , one, , per, , was, , films, , four, , mythological, , Spectators, , h, gs, s, he, ea, ading, , seeing, , With, With, , This, rows, , better, method is, , and, , In the, , columns, , above, , m, , than the, , is, the table, , text c a n be, , its, p r e s e n t e d, , method,, , (i) Tabular Presentation, , e, , t, , h, , o, , d, , ., , previous., , The, , d, ta, a, da, at, , pE, , erstand., unde, rstand., , easier, , presented, , for, for, , in, , a, , to, tabular, , form as follow, , Table 1, Number of spectators, , Total, Types of film, , Males, , Females, , 11,400, Criminal, , 35,000, , 11,000, , 24,000, , Comic, Mythological, , 5,000, , 4,400, , 600, , 100,000, , 40,000, , 60,000, , Total, , 18,000, , 7,800, , 10,200, , Historical, , 26,000, , 12,200, , 13,800, , Social, , 16,000, , 4,600, , Bombay, Uni. Examination,, (Source: B. Com. I., , -April 1963)., , i i ) GraphicalP r e s e n t a t i o n, , Graphs are extremely, , useful in, , quick, , understanding, , of, , with in a separate chapter, method will be dealt, This, data., of, 4.2, , a, , limited set, , later, , on., , Tabular Presentation, tabular form, , the, , can, , be, , easily seen, if we comparetable, , The advantages of, in the paragraph given in, data in Table 1 with the data, same data, but they, and the paragraph contain the, represented in the table., The data, , are, , classified and then presented in, , a, , (i). Both the, are more, , tabular form., , clearly, , are a number of ways of classifying the data, but the possi, , classification can be grouped into the following four types:, , re, , Iher
Page 3 :
31, , Tabulation, , Classification based on Differences of Kind, A business concerm may sell a variety of products Information of, , sales of different products is a common requirement. Here the sales are, ssified according to ditferent kinds of products The classes are set up, the basis of qualitative differences. The following are the examples, where this type ot classification is used, , Sales classifed acconding to terms of sale, cash, credit., by, salesmen., )Sales classified, ii) Emplovees classified by types of work done, (iv) Products classified as defective or non-defective., () Population classified by religion., (vi) Exports classified by commodities, Table 2, No. of Students in, , a, , college, , Male, , 2000, , Female, , 1000, , Total, , 3000, , This table considers only one characteristic, namely sex. The, following table considers two characteristics and classifies the workers, , in a factory., , Table 3, Workers in ABC factory (1980), , Type, , Number of workers, Skilled, , Unskilled, , Total, , Permanent, , Temporary, Total, Similarly, we can consider three or four characteristics in a table, Tables 18,19 illustrate such classification., (2) Classification based on Differences of Degree, If households are classified according to income received in 1990, we, get a classification of this type. Here the classes represent varyings, degrees of income, and all households having income between certain, specified amounts are placed in the same class., This classification will be quantitative, as the ditterences of degree, Sometimes such classification is, w be expressed in quantitative terms., done on, terms, but that is not, may be classified as young, middle aged and old. But this classification, , qualitative, , usually satisfactory. Employees
Page 4 :
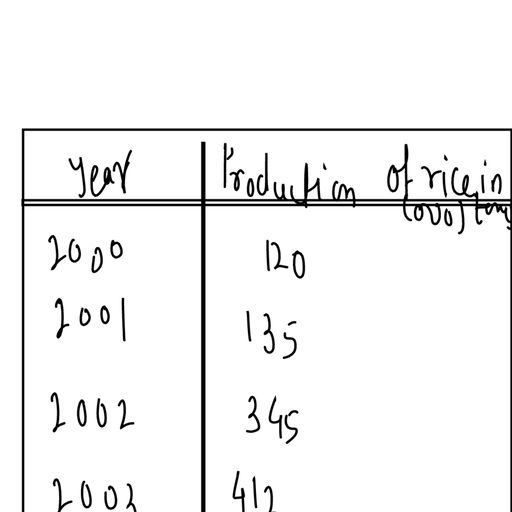
Vipul'sMEBusiness St, , SatStastis, xamples classificatin, , 32, is, , not, , type(), , following, very clear. The, , are, , of clase:, examples of, , ., , Classification of a group of persons according to age, , classified according to, () Customers of a store, , amo, , mount of a, , purchases., , (ii) Retail stores classified according to yearly volumes aff .sales., (iv) Factoriesclasified according to number of employees, , () Banks clasified according to amounts of deposits., Table 4, , Age distribution of 70 children, , Age in yearsNo. of children, 0-3, 3-6, , 20, , 6-9, , 25, , 9-12, Total, , 15, , 10, , 70, , (3) Geographic Classification, , This, , separates, , the, , countries and other data into groups according to, the, different states in geographic subdivisions., continents,, India, population in, Production, this type of, of rice in, different states, classification., are, , Table 5, , Rainfall in some states, State, , in, , 105, 125, 120, 100, , Madras, , Maharashtra, , Here the data, arranged in the orderare ofclassified, time series., , India 1987-88, , Rainfall (in cms), , Andhra Pradesh, Kerala, (4) Time Series, , examples of, , on, , the, urrence. The basis, , G) Yearly, of India, from 1971, (ii) Numberexports, of books, bor, borrowed, , of, , following aretimetheintervals and, examples of, 1975., , to, , wed by, library., students every, (ii) Total strength of, week in a, college for years 1980, college, a, , to, , 1987
Page 5 :
Tabulation, , 33, *, , The, , following, , table, , gives, , years 1990-91 to 1994-95., , the, , yearly production of a factory, , for the, , Table 6, , Production of a factory, Year, No. of units (in, 1000), 1990-91, 30, , 1991-92, 1992-93, 1993-94, 1994-95, , 35, 33, 37, 39, , Descriptive Characteristics, There are certain characteristics, which are not, capable of numerical, measurement, e.g, blindness, literacy and smartness., These are, descriptive characteristics. These are also called attributes. The, persons, who possess the characteristic are, placed in one class and those who, not possess it are placed in another class., , If, , we, , consider only, , classification,, classification., , do, , characteristic at a time, we have, i.e., if we consider only blindness we have simple, simple, But if more than one characteristics are, considered, one, , simultaneously, we have manifold classification. If we divide a group of, persons according to sex and age group in addition to blindness, we, have manifold classification., In this type of classification the classes should be, determined clearly., For example, if we are, considering literacy we should decide whether, we call a, literate, if he knows only how to, person, sign or should be able, to write and read, according to a certain standard. If there is no, , clarity, thepurpose of classification is not served., Numerical Characteristics, Certain characteristics can be measured, quantitatively. If we consider, the heights of 100 students, the, height can be measured numerically and, , it will vary from student to student. Therefore height is caled a variable., Other, examples of variables are marks, age, income, size of readymade, , garments, size of shoes, etc., , The variables are classified as discrete and continuous. The size of, shoes can be denoted by 5, 6, 7, etc. This variable cannot take a value, , between 5 and 6 or between 6 and 7. Such variables are called discrete, Variables. If we consider height in cms, it can take any value in a given, , range. Such variables are called continuous variables.
Page 6 :
Vipul' Busines Statistie, 34, , this type, , classification We, , ofclas, , studied, , already, , Shudents have, , below some examples, , as, , revision., , Table7, , Total, 8/Total, , Size of shoes, , No. of pairs, , 5 67, 15| 12, 13, 10, of, , 50, size is known as, different, , frequee, , o b s e r v a t i o n s over d, This table giving frequencies, of, number, of total, table. The distribution, distribution of, distribution abov, totaldistribution., l, an. The, The distribclasses is called frequency, an exampl, examnl, consider below an, discrete frequency distribution. We, continuous frequency distribution., , ibution aboy, , Table8, , Height in, , No. of, , Less than, , More than, , cms, , children, , cumulative, , cumulative, , frequency, , frequency, , 70-80, 80-90, 90-100, , 30, 12, , 25, 18, , 21, 27, , 100-110, 110-120, , 3, , Total, , 9, , 30, , 3, , 30, , Height is a, , the lower limitcontinuous variable. For the first, and 80 is the, , interval (70+80)+2 75, In, , class, limit. The interval 70-80, 70 is, upper, is, known as class mark. midpoint of the class, , column no. 3 we have less, , them by adding, , than, , successive frequenciescumulative, 5,5+77 frequencies. We obtain, we know, cms, that of frequencies, that, =12,5+7 +9 21,etc, 12 students, height of 5 =12,5+7+, et80, known 'less than' is less than 90 cms, and students is ess than, so on., less, cumulative, We can start, frequencies., Therefore these, th, 18,., and obtainadding from the last fred, irequency, as, 3,3+, the, height of 3 students figures in column 4., From these, , as, , «, , are, , as, , 100 cms and, so, , frequencies., , Table no., , 9, , than 110 cms,no. From theco, Therefore these are that of 9 studen, known, Nn, is more, , on., , given, , below gives an example of a, have 30 students, in statistics as, on the, well as marksdivided, basis of, in, Here, , we, , +6+9=, , now that, as, as 'm, ore than', thanore than, , Accountancy., , bivariate. cumulative, , variabldiests,ribmarutioion.xks
Page 7 :
TabulatlOn, , Table 9, , Marks in Accountancy, 20-30 30-4040-50 50-60 60-70 Total, , Marks in Statistics, , 4, , 20-30, , 2, , 6, , 30-40, , 2, , 40-50, , 1, , 2, , 1, , 5, , 50-60, , 2, , 6, , 3, , 11, , 5, , 6, , 9, , 30, , 2, , 60-70, , 3, , 4, , Total, , 9, , 5, , Simple and Complex Tables, , 4.3, , If one, , or more, , independent characteristics are tabulated, the table is, , consider the number of, , called simple table. 'This is a one-way table. If we, etc. we get a simple, students getting marks between 10-20, 20-30,, for imports and exports of different, table. Similarly, if we get the figures, Table no. 4 is an example of a, countries that also will be a simple table., .,, , simple table., , If we present two or more characteristics,, , which are, inter-related we, , If the number of students are further divided, we get a complex table. Here we are considering, marks and sex of the students. Therefore we get a, , complex table., according to their sex, , get, , a, , two characteristics,, , table. If we consider the incomes of the parents, two-way or second order, above characteristics we will get a, of the students in addition to the, We can have higher order table by, three-way or third order table., Table, number of characteristics simultaneously., , considering more, table., number 12, 18, 24 are examples of complex, , 4.4, , Particulars of Tables, , The data classified, bear in mind many, , to, be tabulated. While tabulating, we have, table interesting,, particulars, which make the, , are, , to, , effective and useful., Gi) Parts of the Table:, (1), , the subject and the scope of, clearly, should, title, convey, The, Title:, in the table. The title, the table. It should tell us what is represented, series of phrases rather than long, should be brief. It should be in, should be large enough and prominent, sentences. Th title lettering, in the table., , 2), , At the top of each column, we, Headings:, Captions, This column heading is, should write what the column represents., of measurement for the observations, known as 'Caption'. The unit, or, , Column
Page 8 :
vipul's Business Statistic, 36, should also, , be, , included in, , Caption',, tion',, , e.g., e.g,He, be sh, shown, may be, , captions, in the column, Rs.. The, crores of, in, The width of each, cms or Export, heading., the main, be represented, smaller letters than, number to, largest, decided by the, in that place, made to fit, should be, be, should, column and the caption, is designated., horizontal row, Headings: Each, column, , ch colun, , (3), , Stubs, , or Row, , designations, caption. The, column., , 4, , are, , known, , Thes, , also bea, umn also, be, the width of, items determines, , as Stubs'., , length of the stub, , in, , The stub, , ears, , artanged in son, Som, should be, be, compared, to, items, The, systematic order., consecutive columns. The order shows which items are to, , Arrangements: The captions and, , stubs should, , be, , emphasized. The totals of the columns are placed at the bottom, the columns and those of rows are placed in extreme right hani, column. The principal basis for arranging the items an, alphabetical, chronological, geographical, order of size, order of, , interest or emphasis and least according to custom., (5) Footnote: If any, in the table is not, , explanation, , complete, it is, footnote., The, table, as far as, give, possible should, be complete and should not need, any footnote., (6) Source: Source also should be, indicated at the bottom of the table., i, the user wishes to check the, data he can do so, from the original, Source., i) The following rules, should be observed while, (1) A table should be, preparing a table:, within, complete, itself., It, should not be, to read footnotes., necessary, advisable, , (2), , to, , it in, , a, , It should be a, logical unit, and, placed in the same table., , (3) The, , only, , data, , which, , are, , related, , arrangement of stubs and captions, emphasis is secured., be such that, (4) The title should be written at, the top of the, table which, clear and precise., (5) Captions and stubs should be brief and, added when necessary., , should, , d.., , desired, , clear. Fooms, , Footnotes may beb, , (6) The captions and stubs may be, grouped to indicate, , (7) Units of measurement should be, , be, , indicate relationship., , carefully stated., , r, , nip., , (8) Source should be stated., (9) The table should be accurate,, otherwise, people will losa, work as a whole. When tables, are transferred from, th in the, another they should be checked properly., e record, to
Page 9 :
Tabulation, , 37, , llustrative Examples, E. 1: Tabuiate the following, information., The total strength of a college in 2000-01, distributed as under, , was, , 1,100 students, , F.Y. Com. 400, Int. Com.-300, Jr. B. Com. -200, Sr. B. Com., -200., In 2001-02, there was a fall of 10% in the strength of each of the first, -, , three classes as compared to their strength in 2000-01, and Sr. B. Com., , class had strength of 200. In 2002-03 there was an increase of 10% in each, of the classes as compared to their strength in the previous year. In 2003-, , 04, the total strength of the college was 1,250. The number of the, students in Sr. B. Com. class was half of the number of students in F.Y., Com. class. The number of students in Jr. B.Com. class was 20 more than, , the number of students in Sr. B.Com. class. The number of students in, Int. Com. class was 330., , Solution:, Here we have a two-way table. The two characteristics to be, considered are year and class. Therefore, we first prepare a blank table,, to find the, Write down whatever facts are given and then proceed, , remaining unknown numbers as given, , below:, , Table 10, , Number of students, , Year, , F.Y.Com., , 2000-01, 2001-02, , Int.Com. Jr.B.Com., 200, , 300, , 400, , Total, Sr.B.Com., 200, , 1,100, , 2002-03, 2003-04, , first three classes are 10% less, for the year 2001-02 for the, , The figures, in 2000-01., than the corresponding figures, They will be:, , F.Y., , 400-10% of 400, 400-40, , I. Com., , 360, , 300-10% of 300, , 300 -30 =270, , Jr. B. Com., Sr. B. Com., Total, , 200-10% of 200, , 200-20, , 180, , 200 (given), 180 +, =360 + 270 +, , 200, , 1,010
Page 10 :
Vipul's Business Statis, , 38, , The, The figures, figures for the year 2002-03 for all the classes are, , hgures for 2001-02. They will be:, , istics, 10% abo, abovee, , FY.Com 360+ 10% of 360, 360 +36 = 396, , Int. Com., , 270+10%of 270, 270+27=297, , Jr. B. Com., , 180+10%of 180, =180+18=198, , Sr. B. Com., , 200+ 10% of 200, , 200+20 220, Total, , 396 + 297+ 198+ 220 1,111., For the, year 2003-04 total is, students in Sr. B. Com. class be given to be 1,250. Let the, x. Then the, numbers will be:, , number, , Sr.B.Com., Jr.B. Com, , * + 20, , Int.Com., , = 330, , FY.Com, x+X+, , 2x, , 20+330 +2x =1250, 4x + 350, , 4x =900, , x, , 1250, 225, , The number of, students in different, classes will be:, Sr. B. Comn., X=225, Jr. B. Com, X+ 20= 225+20245, Int. Com., 330, , F.Y.Com., , 2x, , =, , 2(225) =450, , Now get the, complete table as follows:, , Table 11, Year, , Strength of a Commerce College for, fours, iour years, , Number of students, Numbe, BCom. St.8.Com., , F.Y.Comn., , Int.Com., , 2000-01, , 400, , 300, , 2001-02, , 360, , 2002-03, , 396, , 2003-04, , 450, , 270, 297, 330, , Jr.B.Com. Sr R, 200, ,180, 198, 245, , Sr.B.Com., , Total, , 220, , 1,100, 1,010, , 200, 200, , 1,111, 1,250, , of
Page 11 :
39, , Tabulation, , Ex. 2: Represent the information given belouw by a table., The number of students in a college in the year 1981, was 510. Of, these 480 were boys and the rest girls. In 1991, the number of boys, , increased by 100% and that of girls increased by 300% as compared to, their strength in 1981. In 2001, the total number of students in the college, , was 1,200, the number of boys being double the number of girls., , Solution, There are two characteristics to be represented: Year and sex of the, student. We prepare a two-way blank table and write down the number, of students in 1981. In 1981, the total is 510, out of which 480 are bòys,, therefore, the remaining 30 are girls., , Table 12, , Strength of a college, , |, , Year, , Boys, , 1981, , 480, , 1991, , 960, , Girls, 30, 120, , Total, 510, 1080, , 800, 400, 1200, 2001, In 1991, the no. of boys increased by 100%, The no. of boys is 480+ 480 960, , The no. of girls increased by 300%, . Theno. of girls is 30+3(30) = 120., , The total in 1991 is 960+ 120 =1,080., In 2001 the total is 1200., , The no. of boys is double the no. of girls., ., , The ratio of boys to, , ie., No. of boys, No. of girls, , 800, , =, , 2/3(1200), , =, , 1/3 (1200) = 400., , Ex. 3:, A survey, , girls is 2:1., , was, , =, , is any relation, conducted to find whether there, , pairs of father, postgraduate degrees while the, and son were surveyed. 100 sons had, Fathers of 50 percent of the sons having, were only graduates., remaining, degrees themselves, while, postgraduate degrees had postgraduate, had postgraduate degrees., fathers of only one-third of the remaining, , between the education of father and, , Solution:, , son., , A total of 190, , to the, The 190 pairs are divided according, as, below:, So, we have a two-way table given, , degrees of father and son.
Page 12 :
Vipul'sM Business Statist, , 40, Table 13, , Father, , Postgraduate Total, Total, , Graduate, , Son, , Graduate, , Postgraduate, Total, We, , are, , given that there, , number of fathers, sons, , have, , as, , well, , 190, , are, , as, , postgraduate, , degrees., gTaduate degrees is 190-100=, 90., We write these, , numbers according figures, to the, Out of 100, , sons, , with, , pairs surveyed. So,, , we, , ha., , ave, 190. We write this in, in, the, table, tahl, So, the number of sons, , sons as, , havino, having, , in the last, , column. We have, , degree of the father., , to, , on, , divide th.the, , postgraduate, 50, degrees,, postgraduate, have fathe, ie.,, degrees,, here, the number is 50percent, 100-50 50 have, and, the, remainin, Write these fathers with only graduate degrees., figures in the, with, , degrees. One-third, i.e., % second row. 90 sons have, only gradua(90) 30 of them, postgraduate, 90 30 60, have, degrees., degrees., fathers wit, sons have, fathers, Write these, having graduat, in the first, figures, Aiso find, row., =, , the column, , totals., Now the final, table will be as, , follows:, , Relation between theTable 14, , education of father and, , Father, , atherGraduate PostPostggraduat, Graduate, raduatee Total, Son, , Postgraduate, , In the, , Total, , Total, , 60, , 50, 110, , son, , 30, 50, 80, , 90, , 100, nos. 1 and 2, example, we, not any, have, 190, meaning. The numbernotof calculated, includes some students, calculated, who are, studies in the, there, the studento, tsi incolumn totals,, for three, college, more, any given as, In ex. 3, the, previous, years., year, column, year, graduate and postgraduatetotals give us the number as the student, , they will, , e, , or, , we, , write column totals, degrees, which, also., , number, , of, , oa, , meaningful,fathers, and therefore, having
Page 13 :
41, , Tabulation, , Ex.4:, Out of the total number of 1807 women who were interviewed for, , employment in a textile factory of Mumbai, 512 were from, , textile areas, , and the rest from the non-textile areas. Amongst the married women, areas, 247 were experienced and 73, inexperienoced while for non-textile areas the corresponding figures were, , who belonged to, , textile, , A0 and 520. The total number of inexperienced women was 1341 of, whom 111 resided in textile areas and the number of experienced, wh, 16, unmarried women in the textile and non-textile areas was 154 and, respectively., , Solution, Here, , we have, , to exhibit three characteristics. Area, Marital status,, , Experience., Women, , Table 15, , employees in a, , status and, textile factory their area, marital, , experiences, , Experie, , Marr-, , | Unma-|, , ied, , rried, , nced, Inexper, , Total, , Marr-| Unma-| Total, , rried, , ied, , 154, , 401, , 49, , 73 3 838, , 111, , 520, , 247, , 16, , 320, , Total, , Here also, and the, , we, , Marr- | Unma-| Total, , ied, , ried, , 296, , 170, , 593, , 7481341, , 889, , 918, , 65, , 7101230, , ienced, , 192, , Total, , Non-textile Area, , Textile Area, , 726, , 512569, , 1295, , remaining figures, , married, , number of inexperiernced, subtraction, eg., the, inexperienced, , is 73. Therefore,, 111-73 38., , the, , 1807, , the figures, , write down, first prepare a blank table,, calculated by simple, can be, , number, , 466, , of, , given, , addition and, , women, , unmarried, , in textile, , women, , is, , area, , information in, following, the, Present, Ex. 5:, , form., , of, , a, , a, , factory, 1200, , suitable tabular, , were, , members, , of, , a, , which 175 did, was 200, of, employed, union members, number of, number of, frade union. The, the, 1990, the, union. In, the other hand, a trade, On, to, m, e, n, ., not belong, 1290 w e r e, 180 w e r e m e n ., of which, 208 of which, to, increased to 1580,, down, union and, members fell, to a trade, of non-union, who belonged, number, 1995, 300, employees, employees in, w e r e 1800, the, all, Of, In 1995 there, union., , In 1985,, , out, , of 1750, , workers, , women, , trade, , union., to a, to a trade, did not belong, not belong, did, 8, whom only, were w o m e n of, , 50 who
Page 14 :
Vipul'sM Business Statistis, , 42, , Solution:, We have the figures for three years. The workers, the union, aro, , are, , according to their sex and whether they are members of the unio, , divig, , We have a three-way table in this case:, In 1985 the total no. is 1750., , The no. of members is 1200., The no. of non-members is 550., The no. of women is 200., , The no. of non-members is 175., The no. of members is 25., Total no. of members is 1,200., . The no. of, male members is, , 1200-25= 1175., Table 16, Workers in factory, Non-members, , Union Members, Male, , Female, , Total, , Male, , 25, , 1200, , 375, , 1985, , 1175, , 1990, , 1290, , 290, , 1995, , 1580, , 1508, , 292, , 1800, , Out of the total no. of, 550, , Female, , 180, , Total, , Total, , 175, , 550, , 28, , 208, , 8, , 50, , 42, , given to be, In 1990 the no. of, members, No. of, male members, , 200, , 1550, 200, =, , No. of female, members, The no. of, non-members is, No. of male, is, No. of female, , 208, 180, , non-members, , is, Total no. of males is, 1290+ 180, Total no. of females is, , 28, , Total no. of workers is 1470+28, 318, find, +, , workers in, , 1580, , 1290, 290, , non-members, 290, , 318, 300, , 375, , ., , the no. of, , Female, , 1550, 1470, 1550, , non-members 175 are women, , Male non-members are, 500-175, Total no. of males is, 1175 + 375, and Total no. of, females is, , Similarly, we, , Male, , different, , 1470, 318, 1788, , categories inin 1995., 1995., , Tota, Tot, 1750, 1788, 1850
Page 15 :
43, , Tabulation, , Ex. 6:, , Tabulate the following information., , In a trip organised by a college there were 80 persons each of whom, aid Rs. 15.50, , on an, , average. There were 60 students each of whom pai1d, , 16. Members of the teaching staff were charged at a higher rate. The, number of servants was 6 (all males) and they were not charged, num, , anything. The number of ladies was 20% of the total of whom 1 was a, lady staff member., , Solution:, , have the data about the members of a trip, divided, considering, turo characteristics, status and sex of the member. In addition we have to, We, , tabulate the contribution of these members., , Table 17, Account of a, , trip organized by a college, , No. of persons, Status, , Male Female, , Contribution, in Rs. per, , Total, contribution, , head, , in Rs., , 960, 0, , Total, , Student, , 45, , 15, , 60, , Staff, , 13, , 1, , 14, , 16, 20, , 6, , 0, , 6, , 0, , 64, , 16, , 80, , Servants, , Total, , 280, 1240, , There are 80 members in all, , 16, , No. of ladies = 20% of (80), . No. of gents = 80-16, , 64, , No. of lady servants, No. of lady staff member, No. of lady students, , 15, , No. of servants, No. of students, , 60, 14, 6, , No. of staff members, , No. of male servants, , 13, , No. of male staff = 14-1, , 45, , y No. of male students, , Total amount collected is 15.50 x 80, Amount collected from students 60 x 16, =, , Amourit from servarnts, , Amount from staffis 1240 -960, Amount per staff member is 280+14, , =, , 1240, , 960, 0, 280, 20
Page 16 :
44, , Vipul'sM Business s, , Ex. 7: Arrange the following in suitable tabular, form., , Statist rs, , The Food-grain Inquiry Committee made the following, , Study, , following compa, , in Eastern U.P. and rest of U.P., , of size of holdings, , In 14 Eastern districts of U.P. holdings below.2 acres, tal area, of the area under all holdings comprising a total, area of fo1, (thousand acres), the corresponding figures ror tne rest of U p, , account, , and 29036 (thousand acres). Similarly,, , the proportion of, , of U.P., , area co, co are, area, , holdings exceeding 2 acres but not exceeding ) acres to the ar, , the, , all holdings is 29% in 14 districts and only 3% in the.rest of U.P.area ur, , Solution:, Table 18, , Report of Foodgrain Inquiry Committee aboutthe size of hola:., Rest of U.P., , Eastern U.P., , Size of, , holdings, , % to, , Area in, , total, , 1000 acres, , % to, Total, , 20, , 2456.0, , 11, , 29, , 3561.2, , 3, , 51, , 6262.8, , 86, , below 2 acres, , 2-5 acres, above 5 acres, , dingo, , Area in, , 1000 acres, 3193.96, 871.08, 24970.96, , Total, 100, 12280, 100, 29036, The holdings are divided, to, the, size and the two parts., according, U.P. for each one the, as, percentage well as actual area is to be tabulated, The total of 100 per cent is, distributed as 20, 29 and 51 in Eastern, U.I, Actual areas, to these, , corresponding, , are, , 20% of 12280 2456, 29% of 12280 3561.2, 51% of 12280 6262.8, In rest of UP. the, for different, =, , percentages, , Actual areas are, 11% of (29036), , 3% of, (29036) =, of, 86%, , =, , sizes are 11,3 and 86., , 3193.96, , 871.08, (29036), Ex.8: Tabulate, 24970.96, the, following, At, =, , examination,information., qualifying, interviewed, a, , competitive, , out-numbered girls 96., at, which 600, by, number those:, Those, ose failing to, students peared, boys, boys intervie was qualify by, boys, for, boy, were 25, 25 who, interview, 300 while 310. The, xceeded in, failed to qualify for among thenumber of science graduate, gradua, interview. arts graduate girls, there, girls the, , appeared,, exceedeu, , Altogether there wevere only
Page 17 :
45, , Tabulation, , 135 arts graduates and 33 among them failed to qualify. Boys who failed, quality numbered 18., to, , Solution:, , Table 19, , Graduates qualifying at a competitive examination, Science, Total, Arts, Category, , Boys Girls Total Boys Girls Total Boys Girls Total, , Qualifying, Non-qualifying, , 300, , 53, , 353, , 30, , 10, , 102, 155, , 112, , 8, , 465, , 38, , 310, , Total, , Let the number of girls be x., Then the number of boys is x, , +, , 72 1102 330, 25, , 97, , 125, 127, , 455, 145, , 135 | 348 252, , 600, , 33, , 18, , 96., , Total number of students is 600., X+X + 96 = 600., , r = 252., Number of girls is 252., Number of boys is 252, , +, , 96, , 348., , Let the number not qualifying for interview be y., Then the number qualifying is y, y+y+310 = 600., ., , +, , 310., , y=145., , The total number not qualifying is 145., The number qualifyingis 145 +310 =455., is 300., The number of science graduate boys qualifying, stream is 25., The number of girls failing to qualify from arts, 25 of them, There are 135 arts graduates, 33 failed to qualify,, , girls., , were, , 33-25 8, , boys from arts stream failed to qualify., them from arts stream., to qualify were 18, 8 of, failed, who, Boys, stream failed to qualify., Therefore, 10 boys from science, of them were from arts stream., 145 students failed to qualify, 33, failed toqualify., Therefore, 145-33 112 science graduates, the number of girls from science, 10 of these were boys. Therefore,, stream failing to qualify is 112-10, Total number of arts, , =, , graduates, , Therefore, the number qualifying, , 102., , to, is 135. 33 of these failed, , is 135 -33= 102., , qualify.
Page 18 :
Vipul's Business Stai, 46, The total number, , 455. Of these l0Z, qualiftying is, , are, , from, from aartssst, , qualitying is 455, to qualif, , - 102=, , science graduates failed, Therefore, the numberof, them, is 348. 18 of, Total number of boys, 330., qualiftying, thenumber of boys, 300, , boys from science, , of boys from arts stream, , is 348-18, , stream, , qualified, , qualifying, , Remaining figures, , is 330 -300, , be obtained, , can, , Theree, , The num, , for the interview. Th., =, , by, , 30., , proper addit., , ition a, , subtraction., , Ex. 9:, , is anv, any relatig, find whether there is, survey was, and son. A total of 190 pairs of c, father, of, education, between the, had postgraduate degrees while, and son were surveyed. 100, Fathers of 50% of the sons havino., remaining were only graduates., p, degrees them selves; while father, conducted to, , A, , fate, , ers, graduate degrees had postgraduate, only one third of the remaining had post-graduate degrees. Tabulate th, given information., , Solution:, In given data there are two characteristics., , ) father and son (i) postgraduate degree and graduate degrees, Thus it is two-way table., , Distribution, , Title:, , of father and, , son, , gualifications., , according, , to, , educational, , Postgraduate son, , Undergraduate son, , Total, , 50, , Undergraduate Father, , 30, , 80, , 50, , Total, , 60, , 110, , 100, , 90, , 190, , Postgraduate Father, , Working:, , (1) Total, , undergraduate sons, , (2) Number, 100 50, , (3), , (4), , =, , 190-100 90, =, , of postgraduate fathers, , having postgraduate sons 50, 100, , Number, of undergraduate fathers, 50 50, , Postgraduate fathers and, , Ex. 10:, , A well, , airhostesses,, , members, , known airlines, of, which, , of the staff, is, , one, , =, , having postgraduate sons, , undergraduate sons =x90, has, , fifth, in senior, , staff of 1000, are, , =, , 100-, , 30, , a, , and, flight pursers. flight, 7 out pursers, of, category, 3 out of 16 air every 40, hostesses are
Page 19 :
47, Tabulation, , senior group, 40% of senior airhostesses and 50% of the junior, also in the, pursers, airhostesses are from science stream whereas 40% of junior flight, of senior flight pursers are from commerce, an, , equal percentage, , and, , tream. Tabulate above data with appropriate title., stre, Solution:, , The data is divided according to 3 characteristics:, , GStaff type: Flight pursers and air hostesses., Senior and junior., Gi) Category:, Science and Commerce., iit) Stream:, , Thus it is 3 way table., Title: Distribution workers, , according type, category and stream., Grand Total, Flight Pursers, Airhostesses, Sci ComTotal, Com, Total Sci Com Total, Sci, 175, 15, , 10 25, , 105, , 70, , 175, , 120, , 80, , 200, , Senior, , Junior, , Total, , 325 325, , (1), , 75, , 100, , 650, , 430, , 395, , 800, , 505, , 495 1000, , 415, , 385, , Working:, , 150, , 90, , 60, , 1, , Number of flightpursers, , (2), , Number of Air hostesses, , (3), , Senior staff, , 4), , Senior Air hostesses, , =ax 1000, , =, , =, , =, , 200, x 1000, , 800, , 1000 -200, , 175, , 3, , =x800, , 150, , =, , 25, , 175- 150, , (5) Seniorflight pursers, 650, hostesses =800-150, Air, 6) Junior, 175, 200-25, (7) Junior flight pursers, 40, =, , =, , =, , (8), , Science, , =, , 100, , Science, Air hostesses from, , =, , 100, , from, Senior Air hostesses, , 9) Junior, , =, , 50, =, , (10) Senior flight, , Commerce, purser from, , =, , 11) Junior flight, , Commerce, purser from, , 60, , x, , 150, , x, , 650 =325, , =, , 40, 00x 25= 10, , 40, , 00x 175, , =, , 70, , 825