Notes of Forex Class, Forex Strategy Pullback strategy .pdf - Study Material
Page 1 :
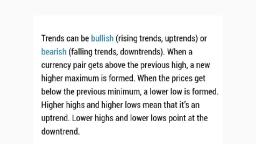
What Is pullback?, , The price never follows straight lines. Usually, price, movements can be described as so-called price, waves. During the strong trend, every next high must, be higher than the previous one and every next low, should be higher than the previous one as well., , ." Correction Wave ie, , % Correction Wave, , | \ it, \ Y, , PRIMARY UPTREND, , \, , Correction Wave, , In the picture above a perfect example of the bullish, trend is presented. As you can see there are three, correction waves, which allow traders to enter the, strong bullish market., , In this article, we will discuss how to pick the best, point to enter the market during the correction.
Page 2 :
John Heels trend line theory, , Trend lines are the best trading instrument of all, time. Even traders who swear off indicators draw, them., , Generally speaking, a weak pullback points to trend, strength. Vice versa, bigger pullback signals, upcoming trend reversal., , John Hill, a famous trading writer, created the trend, theory. This theory is simple, a trader needs to draw, only two trend signal lines to define the trend power., , First, you need to learn how to draw signal lines., , e Put 0 to an extremum point, e Put 1, 2, 3, 4 according to the picture below, Connect 0 and 4, 0 and 2., , 0-4 line below 0-2 line, (pullback is strong), , , , Don't buy this breakout, J of 0-4 line, , If during bullish trend the 0-4 line is steeper, the, pullback has power. Avoid trading this pullback.
Page 3 :
i, yt VI, , , , , , i buy this, breakout of the, 0-4 line, , I A 0-4 line above 0-2 line, (" : (pullback is weak), , If during a bullish trend the 0-2 line is steeper, the, pullback has no power. You might open a long trade, as presented in the picture (when price breaks, through the 0-4 line)., , You might use this example during downtrends as, well., , Breakout pullback, , Breakout pullback is one of the most popular, pullback strategies. This strategy is the most, effective at the market turning points. During the, strong trend, a price might consolidate in the channel, , and form support and resistance levels.
Page 4 :
In the picture, you can see that the price broke, through the first support level (upper blue line) and, retested it from the below (after a breakout, the price, usually returns to the level which has been broken, through). In the moment of retest, an aggressive, trader might open a short trade. In this case, the, potential reward/risk ratio is highest because the, price may get above the level and continue the, uptrend., , The conservative trader should wait until the price, continues the trend structure and breaks into a new, low (lower blue line breakthrough). That is the, second sell entry point. The conservative entry, happens later and, therefore, the potential, reward/risk ratio is also smaller., , NIN A meu, ral IN?, , IM, f mat |
Page 5 :
Horizontal steps, , During trend movement, the price always pulls back, to accumulate powers for the next moves. Usually,, the price returns to the previous high/low level and, tests it from above/below during a bullish/bearish, trend respectively. This pullback might be considered, as an opportunity to find an alternative entry point, for those who missed the initial entry opportunity., , hy, , , , | Entry point, , Furthermore, a trader could also choose to use the, stepping pattern to pull the stop loss behind the, trend in a safer way. In this case, the trader waits
 Learn better on this topic