Page 1 :
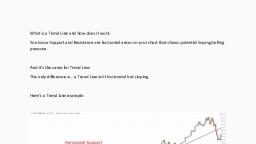
Trends can be bullish (rising trends, uptrends) or, bearish (falling trends, downtrends). When a, currency pair gets above the previous high, a new, higher maximum is formed. When the prices get, below the previous minimum, a lower low is formed., Higher highs and higher lows mean that it’s an, uptrend. Lower highs and lower lows point at the, downtrend., , Identifying market trends based on the naturally occurring swing points, in the market..., , Higher highs and higher lows Lower highs and lower lows, define an uptrending market define a downtrending market, , How to draw trend-lines correctly?, , Trendlines represent one of the most popular tools of, technical analysis. Don't disregard this instrument in, favor of more complicated tools, as trendlines can be, very helpful for your trading.
Page 2 :
The main benefit of drawing trendlines is that they, make the picture on the chart clearer. To succeed in, trading, you should be able to find useful information, on the chart, separate it from the useless info and, project it to future. Analyzing the trendline will help, to find other formations and, consequently, make, right trading decisions., , It's possible to draw many trendlines on one chart,, but too many lines will confuse you. The goal is to, choose the most evident lines and draw them. If a, trendline is obvious, then many traders, including, large speculators, will notice it. As a result, the odds, that such line will hold the movement of a currency, pair are higher., , A trendline has 2 characteristics:, , 1. Minimum 2 intersections with the price., , 2. Bias (the line is not horizontal)., The more times the price touches the trendline, the, stronger is this trend. Pay attention to the angle of, the trendline. If it's less than 30 degrees, a trend is, too steep and unstable. It's better when the trend’s, angle exceeds 45 degrees. In other words, the, second point through which we draw the trendline, should be 20-30 candles away from the first one., , Trendlines may be used on any timeframe, “Oo, better if the chart period is greater than M15.
Page 3 :
Trend channels, , Sometimes you can clone and move the trendline, so, that the cloned line is parallel to the first one and, limits the trend from the other side so that one line, going through the pair's highs and the other one, connects its lows. This is called a trend channel., , Note that the main line during an uptrend is the one, that connects the lows (support line), while in the, downtrend the focus is on the line, which connects, the price’s highs (resistance line). Channels help, traders to orient themselves inside the trend., , The logic of trend trading, , During the rising/falling trend, it's recommended to, open positions in direction of the trend. As traders, often say, a trend is your friend. In other words, if the, pair reaches support line during an uptrend, the odds, are that it will recoil upwards and run towards, resistance, so trendline support is a good place to, open bullish positions. Buying in uptrend and selling, in a downtrend is called trend trading., , The goal is to enter the trend at an early stage in, order to get the maximum profit from trading the, trend.
Page 4 :
Course of actions, , 1. Determine the trend with the help of price, action and technical indicators., , 2. Plan the entry — buying on the recoil from, support is less risky than buying on the break, of resistance., , 3. Limit losses - for example, put the stop below, the previous higher low., , 4. Determine the target — Take Profit should, exceed Stop Loss., , , , , , , , Recoil from support ina, uptrend is the best place, to Buy, , H'l |, , ,, yt", , Remember that trading counter the trend is riskier, and requires professional skills and a vast Forex, experience.
Page 5 :
How do we know that the trendline, , is broken?, , If the currency pair went below support line during an, uptrend, it will be better if the break is confirmed by, one of these conditions:, , 1. The price closes 1% below the trendline’s, broken support., , 2. The volume — if the data are available — is, above average., , 3. The following candles close below the line., , 4. After the break to the downside, there's a rally, on the intraday chart back to the broken line,, which is successfully playing the role of, resistance. Such rallies provide a stronger, selling signal if they are formed during a time, period when the volume is below average., , 5. The size of the break to the downside is, greater than the average ATR reading. ATR, indicator measures volatility during a certain, number of last candles.