Page 1 :
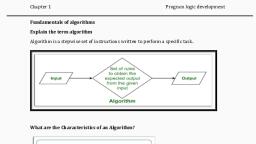
Chapter 3, Flow charts and programs, Notes, 1.Flowcharts are very important in computer programming ., 2.Flowcharts use standard symbols to represent input/ output processing, decision- making etc ., 3.The general direction of flow in any flowchart is from top to bottom or left to right ., 4. A program is a sequence of steps written in some programming language ., 5.Programs written in high- level languages are translated into machine language by compilers or interpreters., Answer the following questions, Q1. What is a flow chart ?, Ans- A flow chart is a dry diagrammatic representation of an algorithm, workflow or process . It shows the steps with the help of different symbols which are connected through arrows . It is used in analyzing designs documenting or managing a program., Q2. Why are flowchart useful?, Ans. Flowchart provides the graphical representation of an algorithm which makes it easy for project teams to identify different elements of a process and understand the interrelationship among various steps. It is also used in analyzing ,designing, documenting or managing a program., Q3. List the symbols used for flow charts., Ans. The symbols used for flowchart are:, Start /Stop symbol: It is represents the beginning and ending of a program ., Input /Output Symbol : It is represents the input from user and output concluded ., Processing Symbol - It represents process , action or operation ., Decision box : It represents some condition., Flow lines - It represents the flow of sequence., Connector : It connects one part of flowchart to another., Q4. Give the advantage and limitations of using flow charts., Ans. Advantages of using flow chart are –, It provides a better way of co0mmunicating a logic of a system to all concerned., Using flow chart, problem can be analyzed in an effective way., It serves as a good program documentation., The maintenance of operating system becomes easy with the help of flowchart ., Limitations of using Flow chart are-, The flowchart becomes complex and clumsy which becomes difficult to understand ., It alterations are required, we need to draw the flowchart again., Q5. Read the given flow chart and answer the following question., What does the ever flow chart decept?, Ans. This flowchart depicts the method of converting Celsius to Fahrenheit . 0, Write down the output for the following inputs two and 10 ., Ans. If input is 2, the output will be 35.6 . If input is 10 the output will be 50.