Page 1 :
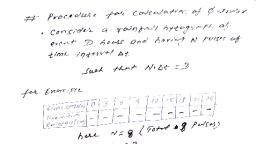
Example 3.11, , A Storm with 10 cm of precipitation produced a direct runoff of 5.8 cm. Ine, , duration of the rainfall was 16 hours and its time distribution is given below., , Estimate the p-index of the storm., , Timefrom start (h), , 0, , Cumulative rainfall(cm) 0, , 12 14 16, 10, 6, 8, 0.4 1.3 2.8 5.1 69 859.510.0, , 4, , 2, , Solution, Pulses of uniform time duration Ar = 2 h are considered. The pulses are numbercu, , sequentialy and intensity of rainfall in cach pulse is calculated as shown below., , Table 3.12 Calculations for Example 3.11, Pulse number, Time from start of rain (h), , Cumulative rainfall (cm), , 2, , 0.4, , 3, , 4, , 5, , 4, , 6, , 8, , 10, , 12, , 5.1, , 6.9, , 8.5, , 1.3 2.8, , 0.40 0.90, , Incremental rain (cm), , Intensity of rain () in cm/h. 0.20, , 7 8, , 2, , 1.50 2.30, , 0.45 0.75, , 1.80, , 14, , 1.60, , 1.15 0.90 0.80, , 16, , 9.5 10.0, 1.00, , 0.50, , 0.50 0.25, , Here, duration of rainfall D = 16 h, Ar = 2 h and N= 8., , Trial 1:, Assume M = 8, Ar = 2 h and hence t, = M. Al = 16 hours., , Since M=N, all the pulses are included., 8, , 8, , Runoff R =5.8 cm , - )At >1xAt- p(8 x 2), =, , =, , 5.8 {(0.20 x 2) + (0.45 x 2) + (0.75 x 2) + (1.15x 2)+ (0.90 x 2) + (0.80 x 2), , +(0.50 x 2) + (0.25 x2), 4.2/14 =0.263 cm/h, By inspection, , of, , row, , 5 of Table 3.12,, , 16 o= 10.0- 14, , -, , M,, , =, , number, , of pulses having 1, 2, , ,20.263 cm/h is 6., Thus, M, 6#M. Hence assumed M is not correct. Try, =, , a new, , value, , , that is, , of M <8 in the, , next trial., , Trial 2:, 14 hours., Select these 7 pules in decreasig order of 7. Pulse 1 is omitted., Assume M, , Runoff R, , =, , 5.8, , cm, , =, , =, , 7. At = 2h and hence 1,, , 2, , -, , p) Ar, , =, , 2, , =, , M At, , =, , A-o (7 x2), , 5.8= {(0.45 x 2) + (0.75 x 2) + (1.15 x 2) + (0.90 x 2), 14 o= 9.6 + (0.80x 2) + (0.50x 2) + (0.25 x 2), 3.8/14 =0.271 cm/h, -, , 14 p
Page 2 :
112 Engineering Hydrology, Time since, start of rain, , (h), , 8, , 6, , A, , 2, , 16, , 14, , 12, , 10, , 1.50, 1.25, , Rainfall excess, , 1.00, , 0.75, Loses, , 0.50, £, , 9= 0.275, 0.275 cm/h, cm/h, 0.275, P=, 0.275 0.275 0.250, , 0.25, , 0.200, , 0.00, , 0.275, , 2, , 3, , 4, , 0.275, , 5, , .200,, , Pulse number, , Initial losss, , Fig. 3.17, , 0.275, , 0.275, , Hyetograph, , By inspection of, , row, , and, , 8, , 7, , 6, , 2-hour duration), (pulse of, , Rainfall Excess of, , 5 of Table 3.12,, , ,20.271 cm/h is 6., M, Thus, M. 6#M. Hence, assumed, =, , M, , the Storm-Example, , number, , =, , is not O.K., , of pulses, , Try a, , new, , 3.11, , having 2, , value, , of M< 7, , p, that is, in the, , next, , trial., Trial 3:, , 12 hours., 6 At 2 h and hence 1, M. At, Pulse 1 and 8 are omitted., Select these 6 pulses in decreasing order of 1., Assume M, , =, , =, , =, , =, , cm = a, Runoff R= 5.85.8, {(0.45 x 2) + (0.75 x, , 2) + (1.15 x 2) + (0.90 x 2) + (0.80 x 2), , + (0.50 x 2)} - 12 0 = 9.1 -, , p, , 3.3/12 0.275 cm/h, 5 of Table 3.12,, , By inspection ofrow, , 12 o, , =, , M,, , =, , number of, , pulses having ,2 p,, , that is, , 20.275 cm/h is 6., , Thus, M, = 6 = M. Hence, assumed M is OK., The -index of the storm is 0.275 cm/h and the duration of rainfall excess = t, =, , 12 hours. The hyetograph of the storm, losses, the rainfall excess and the duration of rainfall, excess are shown in Fig. 3.17.
Page 3 :
Example 3.12, , The mas curve of, , rainfall of duration 180 minutes on a catchment is, given, initial, catchment, loss of 0.5 cm. The, index, of, is, the, catchment, to be, known, 0.4 cm/hour. Calculate the total surface runoff, from the catchment due to this storm., Time from start (min), 30, 60, 80, 100, 120, 150, 180, Cumulative rainfall (cm) 0, 0.6, 1.3, 2.6, 3.2, 3.3, 2.8 3.0, , below. The, , had, , an, , -, , Solution, Runoff in each time step is equal, the infiltration loss calculated as, , the incremental rainfall in that time, step minus, (¢. t). This number is always equal to or greater, than zero, as the runoff is, always a positive quantity. Note that the initial loss has, already been accounted for in the definition (and hence in the, calculation) of o index., As such, the initial loss is redundant, information in this problem. Calculations are, shown in Table 3.13., to, , =, , Table 3.13 Calculation of Runoff-Example 3.12., o-index 0.4 cm/hour. Time steps are as given in the data., Time from, Increment Cumulative Incremental Infiltration, start (Min) of time (At), rainfall, loss = o.At, rainfall, hours, (cm), (em), (em), =, , 0, , 0.000, , 0.00, , 30, , 0.500, 0.500, 0.333, 0.333, 0.333, 0.500, 0.500, , 0.60, , 60, , 80, 100, , 120, 150, 180, The total, , surface runoff due, , 1.30, , 2.00, 2.80, 3.00, , 3.20, 3.30, , 0.000, 0.600, , 0.700, 0.700, 0.800, , 0.200, 0.200, 0.100, , to the storm from the, , Runoff, (cm), , 0.000, 0.200, 0.200, 0.133, 0.133, 0.133, 0.200, , 0.000, 0.400, 0.500, , 0.567, , 0.200, , 0.667, 0.067, 0.000, 0.000, , Total =, , 2.200, , catchment is 2.20 cm.
Page 4 :
114 Engineering Hydrology, Example 3.13, Details related to an isolated 6-hour storm that occurred, runoff from the catchment due to the, , catchment, , over a, , storm., , are, , given. Estima, , Estimate the, , Rainfall (cm), , Areal Extent of, , Sub-, , sub area as %of, , area, , catchment, , 0.3, , 0.80, , 0.45, , 0.5, , 0.90, , 0.30, , 0.4, , 0.86, , 0.25, , A, , B, , d-index, , First 2-hours, , Third 2Second 2-hours Third hours, , 1.60, , 1.30, , 1.40, , 1.10, , 1.30, , 0.90, , Solution, ne, , and converted to depth of, separately, calculated, runotf from each sub-area is, to get the total depth, are in turn added, These depths, , unoir over the whole catchment. calculations, Or runotff over the catchment. The, , are, , performed, , in, , a tabular, , form, , as, , indicated in Table 3.14., , Table 3.14 Calculation of Runoff, , -, , Example 3.13, , Areal, , Intensity, , Extant of, , of, , Runoff, , Depth of depth, , Runoff, depth, , RainfallDu-rainfall Rainfall insub- over total, excess area catchment, (% of, Subofsub- intensity ration Excess, m) area (cm), h) (cm/h) (cm), area catchment) area (cm/h), , Sub-area -Index, , A, , B, , C, , 0.25, , 0.30, , 0.40, , 2.00, , 0.10, , 0.20, , 0.25, , 0.30, , 0.80, , 2.00, , 0.50, , 1.00, , 0.25, , 0.30, , 0.65, , 2.00 0.35, , 0.70, , 0.45, , 0.50, , 0.45, , 2.00, , 0.00, , 0.00, , 0.45, , 0.50, , 0.70, , 2.00, , 0.20, , 0.40, , 0.45, , 0.50, , 0.55, , 2.00, , 0.05, , 0.10, , 0.30, , 0.40, , 0.43, , 2.00 0.03, , 0.06, , 0.30, , 0.40, , 0.65, , 2.00 0.25, , 0.50, , 0.30, , 0.40, , 0.45, , 2.00 0.05, , 0.10, , 1.90, , 0.475, , 0.50, , 0.225, , 0.66, , 0.198, , Total, , 0.898, , The total depth of runoff over the catchment due to tne storm = 0.898 cm