Page 3 :
Syllabus, Quantity of water :Need to protect water, supplies, flow diagram of water supply scheme,, function of units, Demands of water, Factors, affecting rate of demand, Variations of water, demands, Forecasting of population, Methods of, forecasting of population, (Simple problems on, forecasting of population), Design period,, Estimating of quantity of water supply required for, city or town.
Page 4 :
Need to protect water supply, Water supplied to the community should be treated to make it fit, for drinking purpose for the following reasons :, , • The water in the rivers is often polluted by the people, inhabiting the watershed. This water carries bacteria. Some of, which are pathogenic and can cause water borne diseases, such as typhoid, dysentery (Amoebic and baciliary), cholera, etc. when such water is consumed by human beings there, may be epidemic outbreak of the diseases as mentioned, above., • Wastage from some of the industries is let off into rivers thus, rendering it unsafe for human consumption., • Surface runoff due to rainfall partly percolates into the ground, dissolving the salts and minerals present in the soil., Sometimes the groundwater causes such as fluorosis due to, presence of fluorides un the water
Page 5 :
Flow diagram of water supply scheme from source to consumer, Sources of Water, , Surface, , River, , Lakes, , Underground, , Springs, , Reservoir, , Wells, , Intake, Structure, , Treatment, Works, , Sedimentation, , Filtration, , Disinfection, , Distribution, system, To, Consumer, , Misc., Treatment, , Infiltration, galleries
Page 7 :
Coagulants, , Sources, , Intake, Well, , Jack Well, , Aeration, well, , Flash, Mixture, , Clariflocul, ator, , Chlorine, Elevated, Service, Reservoir, , Distribution, System, , Pumping, , Clear, Water, Supply, , Filter Unit
Page 8 :
Functions Of Parts Of Water Supply Project, 1) Intake Well : To collect the water from surface source and convey it to, treatment., 2) Jack Well : It is situated on the bank of source and main function is to, receive the water from intake well and discharge to the treatment, plant., 3) Aeration Unit : In this unit water area is exposed to atmospheric air, by spray or by keeping the surface of liquid constantly agitated., 4) Flash Mixer : The main function is the solution of coagulants is mixed, thoroughly in water by means of fan operated by electric motor., 5) Clariflocculator : This helps in forming a big size floc and increases, the efficiency of sedimentation., 6) Filter Unit : Very fine particles and colloidal matter which have, escaped extraction in sedimentation tanks are removed by filtration., 7) Elevated service reservoir (ESR) : To supply the water under gravity., They also supply water during emergency
Page 9 :
Demands of Water, Water is required for food production, farming, direct consumption,, plants, animals, generation of electric power, recreation,, transportation and industrial activities.
Page 10 :
Various types of Demands of Water, a), b), c), d), e), , Domestic Demand, Public and Industrial demand, Losses and Wastage, Fire demand, Commercial and Institutional demand
Page 11 :
a) Domestic Demand, , , , According IS 1172-1983, the minimum requirement of, water for domestic consumption is 135 litres., It includes domestic purposes such as drinking, bathing,, lawn sprinkling, sanitary purposes and air conditioning, etc., , Bathing, 55 litres/capita/, day, , Flushing, 30 litres/capita/, day, , Washing, Clothes, , 20, litres/capita/, day, , Washing Utensils, 10 litres/capita/, day
Page 13 :
b) Public and Industrial Needs, Public Needs, Quantity of water required public utility purposes such as, washing and sprinkling on road, cleaning of sewers, watering, of public parks, gardens, public fountains, swimming pools, etc come under public demand., To meet the water demand for public use , provision of 5% of, the total consumption is made while designing the water, works for a city., Industrial Needs, • If water is required from public water supply, then water, requirement is depends upon the type and size of industry, also depends on the factors such as cost of water, availability, of water., • 10 to 20% of total demand for fully developed city
Page 14 :
C) Losses and Wastages, • Quantity of water is wasted in the pipelines due to defective, pipe joints, cracked and broken pipes, faulty fittings and, valves., • Loss of water in water works is due to :, 1) Unauthorized water connection, 2) Motor and pump slippage., 3) Bad plumbing, 4) Leakages, • Generally, 15% of the total quantity of water is allowed to, compensate for losses, thefts and wastage of water.
Page 15 :
d) Fire Demand, • The quantity of water required for fire fighting purpose should be easily, available and always kept stored in the storage reservoir., • Following formula is recommended by GOI for the calculation of fire, demands in kilo litres/day. It is adopted for communities with population, larger than 50,000., , • 100 𝑷, • Where P = Population in thousands., • For population of 1 Lakh, the per capita demand would be, =100√100 kl/day, =100 x 10 x1000 l/day, 1000 ×1000, =, lit/capita/day, 100000, = 10 lit/capita/day, • The minimum pressure required at fire hydrants should be of the order, of 1 to 1/5 kg/cm2., • A moderate fire allowance of 0.9 to 1.4 litres per capita per day is, made in india.
Page 16 :
Some Empirical formulas for calculating Fire Demand, 1. Kuichling’s formula, , Q = 3,182 √P, , 2. Freeman’s formula, , P, Q = 1,136 ( + 10), 10, , 3. Buston’s formula, , Q = 5,663 √P, , 4. National board of fire under writers formula, Q = 4,637 √P ( 1- 0.01√𝑷), where, P<200,000., In above formula,, Q = Amount of water required in litres/minute., P = Population in thousands., • At least 2 hours standby storage is kept ready for fire fighting allowance using, these formulae.
Page 17 :
e) Commercial and Institutional Demand, • It includes water demand for offices, shopping centers, hotels,, cinema halls, schools, colleges, hostels, hospitals, railway and, bus stations and various industries., • As per I.S. 1172-1983, water requirements for buildings other than, residences are given below in the table. Approximate consumption may, be taken as 40-45 lit/capita/day.
Page 18 :
Factors affecting Rate of Demands, Rate of Water Demand, The rate of demand is the rate of water to be supplied per person per, day., For calculating this requires domestic consumption, normal industrial, needs, fire demands etc., Per capita demand is given by;, , Q, gallons or lit/capita/day, P×365, , (1 gallon = 3.785 lit), , Where, P = Population served,, Q = Quantity of water for whole city required per year in litres.
Page 19 :
Factors affecting Water Demand, 1) Size of City : Per capita demand of water is generally more for large cities,, since commercial and industrial developments takes place in them., 2) Habits of people : The use of water depends upon living standards of the, consumer. This depends upon economic status of the people., , 3) Climatic conditions : at places where summer are hot and dry, the, consumption of water is more as more quantity is used for bathing, air coolers,, sprinkling lawns and gardens., 4) Cost of water : If the cost of water is more, the consumption will be less and, vice versa., 5) Commerce and industry : Presence of industry increases per capita demand. It, also varies with the type of industry., , 6) Quality of water : If quality and taste of water is good, consumption will be, more.
Page 20 :
7). Efficiency of water supply system :If system is efficient, the pressure in, distribution pipes will be high, causing more consumption. Losses through, faulty plumbing will also more., , 8) System of sanitation : If underground drainage system is provided in the, town, more quantity of water is used in flushing water closet and urinals., 9) System o supply : The water supply to a city may be intermittent or, continuous. In general the consumption is less in intermittent system., 10) Metering of supply : Metering reduces the consumption since the people, know that they have to pay more for the losses and wastages caused by them.
Page 21 :
Variations of Water Demand, • This fluctuation or variation of water is called variation In rate of water, demand., • The variations of demand can be mainly classified Into three categories, (a) Seasonal variation,, (b) Monthly variation,, (c) Daily and hourly variations., (a) Seasonal Variation :, • The demand of water will be more in summer than in winter season., • Such variations are more in hot weather country than cold weather country., , (b) Monthly Variation :, • Such variations are indicated, if daily consumption Is recorded for one season., • In order to find out the demand per month, daily consumption is plotted for a, period of one month., • The average line drawn on the graph indicates the monthly average daily, demand., • Monthly average daily demand in January is least while it is maximum in June in, India.
Page 22 :
(c) Daily and Hourly Variations :, • Daily and hourly fluctuation depends on various factors such as consumers, type, of area i.e. Industrial or commercial area., • The consumption of water will be more on holidays or Sundays as compared to, other days., • The rate of demand of peak hour of the peak day of the maximum demand, season Is called the absolute maximum hourly demand., • Maximum hourly consumption of the day is 2.7 times the annual average hourly, demand., , Rate of Demand
Page 23 :
The variation in per capita demand in India is given below :
Page 24 :
Forecasting of Population, Why do we need to forecast the population ?, • A water supply scheme includes huge and costly structures which cannot, be replaced or increased in their capacity easily and conveniently., • For that purpose, the various components of water supply scheme are, purposely made larger by estimating the future population as accurately, as possible., • In this way, the complications in the expansion of water supply scheme, due to increase in population can be avoided by keenly considering the, population forecast in the design of water supply scheme., • The population of any town or city in any year can be obtained from, census records., • Finding probable population of a city at a future date, from census data, of previous decades is known as forecasting of population.
Page 25 :
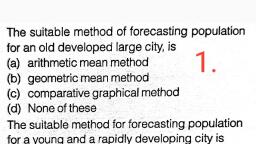
Methods of Forecasting of Population, •The following are methods by which future population is forecasted, , (a) Arithmetical increase method., (b) Geometrical increase method., (c) Incremental increase method., (d) Graphical method., (e) Graphical comparison method., (f) Declining growth method or decrease rate growth method., (g) The logistic curve method., , (a) Arithmetical Increase Method, • This method is suitable for forecasting the population of old, developed, and saturated cities. It gives low results as compared with other, methods., • In this method, the increase in population per unit time (decade) is, assumed to be constant.
Page 26 :
• The increase in the population is taken as the average increase in the, last two or three decades (1 decade = 10 years)., Thus, if the present population is P, the average increase d, then population, Pn, after n decades is given by, Pn = P + nd, Example 1.0 The population of 5 decades from 1930 to 1970 are given in table., Find out the population after one and six decades beyond the last known, decade by using arithmetic increase method., Year, , 1930, , 1940, , 1950, , 1960, , 1970, , Population, , 25,000, , 28,000, , 34,000, , 42,000, , 47,000
Page 27 :
Year, , Population, , 1930, , 25,000, , Increase in population, (d), , 3000, 1940, , 28,000, 6000, , 1950, , 34,000, 8000, , 1960, , 42,000, , 5000, 1970, , 47,000, Total =, , Average increase per decade (d) =, , 22,000, , 22000, = 5,500, 4
Page 28 :
a) Population after 1 decade beyond 1970, P1980 = P1970 + 1.d, = 47,000 + 5500, = 52,500, b) Population after six decades beyond 1970, P2030 = P1970 + 6.d, = 47,000 + 6 x 5500, = 80,000
Page 29 :
(b) Geometrical Increase Method or Uniform Increase, Method :, • This method is suitable for forecasting population of very young and fast, developing cities. It gives higher results. This method is suitable for, towns having large scope of expansion where a fairly-contained rate of, growth is expected., • In this method, it is assumed that the percentage increase per decade, will be constant. Thus, if the present population is P, and the rate of, growth per decade is r, then the population after n decades is given by ,, Pn = P (1 + r)n, Example 2.0, Forecast the population by means of geometrical increase method., Year, , 1940, , 1950, , 1960, , 1970, , Population, , 8,000, , 12,000, , 17,000, , 22,500
Page 30 :
Year, , Population, , Increase in, Population, , 1940, , 8,000, , -, , 1950, , 12,000, , 4000, , 1960, , 1970, , 17,000, , 22,500, , Average per, decade =, , %increase in, Population, , 4000, x100 = 50%, 8000, , 5000, , 5000, x100 = 41.7%, 12000, , 5500, , 5500, x100 = 32.4%, 17000, , Total=, , 124.1, , 50+41.7+32.4, 3, , =41.37
Page 31 :
The population at the end of various decades shall be as follows, Year, 1980, , 1990, , 2000, , Expected Population, 41.37, P1980 = 22500 +, x 22500, 100, = 31,808, 41.37, P1990 = 31808 +, x 31808, 100, = 44967, , 41.37, P2000 = 44967 +, x 44967, 100, = 63570
Page 32 :
(c) Incremental Increase Method :, • This method is a combination of the first and second methods., • In this method, first the average increase in population is worked out as, per arithmetic method and then the average of the incremental increase, is added to this., • This method is useful for cities where population is increasing or, decreasing at a progressive rate rather than at a constant rate., • 𝑷𝒏 = Po + nx+, , n(n+1), y, 2, , P„ = Population after n decades from present (i.e. last known census), x = Average increase of population of known decades., y = Average of incremental increase of the known decades., Po = Present population.
Page 33 :
Example 3.0 Population of town as obtained from the census data is as, follows., Census, Year, , 1970, , 1980, , 1990, , 2000, , 2010, , Population, , 38,284, , 49,909, , 67,105, , 92,367, , 1,12,405, , Estimate the population of the town for the year 2020 and 2030 by, incremental increase method., Ans :, Year, , Population, , Increase in, Population, , Incremental Increase i.e, increment on increase, , 1970, , 38284, , -, , -, , 1980, , 49909, , 11625, , -, , 1990, , 61705, , 17196, , +5571, , 2000, , 92367, , 25262, , +8066, , 2010, , 112405, , 20038, , -5224, , Total, , 74121, , 8413
Page 34 :
1, X = x 74121, 4, = 18530.25, Pn = Po + nx +, , 8413, Y=, 3, = 2804.33, n(n+1), 𝟐, , Y, , P2020 = 112405 + 1 x 18530.25 +, = 133739.58, P2030 = 112405 + 1 x 18530.25 +, = 153671.99, , (1+1), x 2804.33, 2, 2(2+1), x 2804.33, 2
Page 35 :
(d) Graphical Method :, • In this method, graph of population increase against past decades is, plotted as shown in Fig., • The graph is then extended by considering tendencies of the curve, plotted to know the population at a given year. This method may be used, to get an Idea about future population.
Page 36 :
Design Period for Water Supply Scheme, DESIGN PERIOD, The complete water supply project includes huge and costly, constructions such as dams, reservoir, treatment works and, network of distribution pipe lines. These all works cannot be, replaced easily. Similarly their capacities cannot be increased, easily and conveniently for future expansions., As the extensions or expansions in the water works, network of, pipe lines etc. is not easy work, while designing and constructing, these works, they should have sufficient capacity to meet the future, demand of the town for number of years., The number of year for which the designs of the water works have, been done is known as design period., The number of years for which a provision is made in designing the, capacities of the various components of water supply scheme is, known as design period., This period should neither be too short nor too long. Mostly water, works are designed for design periods of 20-30 years, which is, fairly good period.
Page 37 :
To avoid complications at the time of future expansion, various, components of water works are purposely made large to satisfy the, community need for a reasonable number of years to come., This future period or the designing the capacities of the various, components of the water supply scheme is known as design period., The common design period adopted for, a. Distribution system 20 to 25 years, b. Filter plants : 20 to 25 years, c. Pipes more than 300 mm diameter : 20 to 30 years
Page 38 :
Factors Affecting Design Period, a) Funds available for the completion of the project. If more funds are, available the design period will shall be less., , b) Life of the pipe and other structural materials used in the water supply, scheme. Design period in no case should have more life than the, components and materials used in the scheme., c) As far as possible the design period should be nearly equal to the, materials used in the water supply works., , d) Rate of interest on the loans taken to complete the project if rate of, interest is less, it will be good to keep design period more. But if the, interest rate is very high, the design period shall be small., e) Anticipated expansion rate of the town.