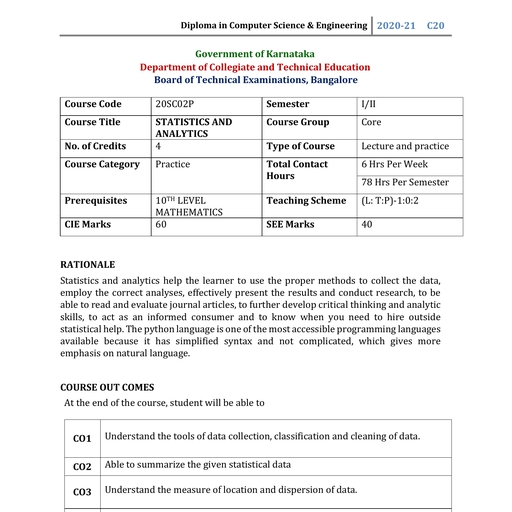
Notes of 1 SEM EC 22-23, Statistics And Analytics SAA unit 3 notes - Study Material
Page 1 :
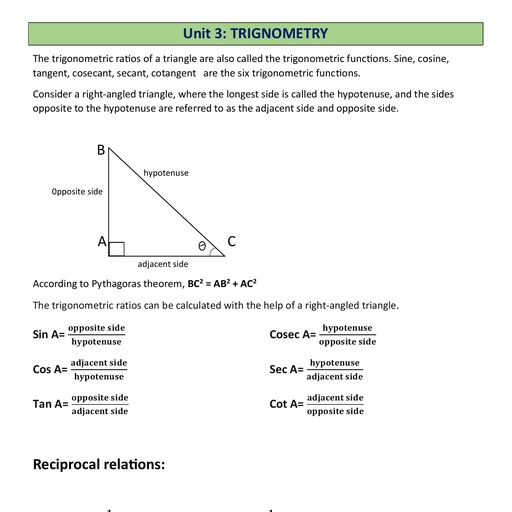
Statistics and Analytics, , UNIT 3: MEASURE OF LOCATION AND DISPERSION, , In statistics dispersion is used commonly to mean scatter, deviation, fluctuation,, spread or variability of data., The degree to which the individual values of the variant scatter away from the, average or the central value is called a Dispersion., Measures of location describe the central tendency of the data. Central tendency is, a descriptive summary of a dataset through a single value that reflects the centre of, the data distribution. Along with the variability (dispersion) of a dataset, central, tendency is a branch of descriptive statistics. It does not provide info, information, regarding the individual values in the dataset, it delivers a comprehensive, summary of the whole dataset. The central tendency of the dataset can be found, out using the three important measures namely mean, median and mode., , \, , Mean, The mean or arithmetic mean represents the average value of the dataset. It can be, calculated as the sum of all the values in the dataset divided by the number of, values., The formula to calculate the mean value is given as, , Government Polytechnic, Udupi, , Page 1
Page 2 :
Statistics and Analytics, In symmetric data distribution, the mean value is located accurately at the centre., But in the skewed continuous data distribution, the extreme values in the extended, tail pull the mean value away from the centre. So it is recommended that the mean, can be used for the symmetric distributions., Example: Uncle Bob wants to know the average age at the party, to choose an, activity., There will be 6 kids aged 13, and also 5 babies aged 1., Add up all the ages, and divide by 11 (because there are 11 numbers):, (13+13+13+13+13+13+1+1+1+1+1) / 11 = 7.5..., Therefore the mean age is about 7½., , Median, Median is the middle number of a given data set when it is arranged in either a, descending order or in ascending order., If there is an odd amount of numbers, the median value is the number that is in the, middle whereas if there is an even amount of numbers, the median is the simple, average of the middle pair in the dataset., Median is much more effective than a mean because it eliminates the outliers., Example:, For ODD data set, In his end of year exams, Joe scored the following:, Science 34%, English 90%, History 87%, Math 34%, Geography 55%, To find the median, first arrange the scores in ascending or descending order:, English 90%, Government Polytechnic, Udupi, , Page 2
Page 3 :
Statistics and Analytics, History 87%, Geography 55%, Math 34%, Science 34%, The median is the middle one, which was 55% for Geography., For EVEN data set, , First arrange the temperatures in order:, 38, 39, 42, 43, 44, 46, 51, 52, 57, 58, 62, 62, There are two temperatures in the middle: 46°F and 51°F, So the median is the mean of them, = (46 + 51) ÷ 2, = 48.5°F, Mode, The mode represents the frequently occurring value in the dataset. Sometimes the, dataset may contain multiple modes and in some cases, it does not contain any, mode at all., Example: Consider the given dataset 5, 4, 2, 3, 2, 1, 5, 4, 5, Since the mode represents the most common value. Hence, the most frequently, repeated value in the given dataset is 5., , Government Polytechnic, Udupi, , Page 3
Page 4 :
Statistics and Analytics, , Relationship between Mean, Median, and Mode:, We will understand the empirical relationship between mean, median, and mode, by means of a frequency distribution graph. We can divide the relationship into, four different cases:, 1. In the case of a moderately skewed distribution, i.e. in general, the difference, between mean and mode is equal to three times the difference between the mean, and median., Thus, the empirical relationship, nship as, Mean – Mode = 3 (Mean – Median), 2. In the case of a frequency distribution that has a symmetrical frequency curve, the, empirical relation states that mean = median = mode, mode., , 3. In the case of a positively skewed frequency distribution curve, mean > median >, mode., , Government Polytechnic, Udupi, , Page 4
Page 5 :
Statistics and Analytics, , 4. In the case of negatively skewed frequency distribution mean < median < mode., mode, , Bimodal, Trimodal &, &Multimodal, Multimodal (More than one mode):, When there are two modes in a data set, then the set is called bimodal, For example, the mode of Set A = {2,2,2,3,4,4,5,5,5} is 2 and 5, because both 2, and 5 is repeated three times in the given set., When there are three modes in a data set, then the set is called trimodal., trimodal, When there are four or more modes in a data set, then the set is called multimodal, , Five number summary:, summary, The five-number summary is a set of descriptivestatistics that provides, information about a dataset. It consists of the five most important, sample percentiles:, 1. the sampleminimum (smallest observation), 2. the lower quartile or first quartileQ, quartile 1, 3. the median (the middle value) Q2, 4. the upper quartile or third quartileQ, quartile 3, 5. the sample maximum (largest observation), Government Polytechnic, Udupi, , Page 5
Page 6 :
Statistics and Analytics, , Quartiles:, Quartiles divide the entire set into four equal parts. So, there are three quartiles,, first, second and third represented by Q1, Q2 and Q3, respectively. Q2 is nothing, but the median, since it indicates the position of the item in the list and thus, is a, positional average. To find quartiles of a group of data, we have to arrange the, data in ascending order., Example: 5, 7, 4, 4, 6, 2, 8, Put them in order: 2, 4, 4, 5, 6, 7, 8, Cut the list into quarters:, , , , Quartile 1 (Q1) = 4, Quartile 2 (Q2), which is also the Median = 5, Quartile 3 (Q3) = 7, , , , Interquartile Range:, , , , , The "Interquartile Range" is from Q1 to Q3 that is the range between the, third quartile and the first quartile is known as the inter-quartile range., , Government Polytechnic, Udupi, , Page 6
Page 7 :
Statistics and Analytics, , Example:, , The Interquartile Range is:, Q3 − Q1 = 7 − 4 = 3, , Absolute Measure of Dispersion:, An absolute measure of dispersion contains the same unit as the original data set., Absolute dispersion method expresses the variations in terms of the average of, deviations of observations like standard or mean deviations. It includes, range, standard deviation,, quartile deviation, etc., A measure of absolute dispersion tell whether the variation is large or small., The types of absolute measures of dispersion are:, 1. Range, A range is the most common and easily understandable measure of dispersion. It is, the difference between two extreme observations of the data set. If X max and, X min are the two extreme observations then, Government Polytechnic, Udupi, , Page 7
Page 8 :
Statistics and Analytics, Range = X max – X min, 2. Variance: Variance is a measure of how data points differ from the mean., According to Layman, a variance is a measure of how far a set of data, (numbers) are spread out from their mean (average) value., To find variance deduct, educt the mean from each data in the set then squaring, each of them and adding each square and finally dividing them by the total, no of values in the data set is the variance., Variance (σ2)=∑(X−μ)2/N, 3. Standard Deviation: Standard deviation is a nnumber, umber that describes how, spread out the values are. A low standard deviation means that most of the, numbers are close to the mean (average) value. A high standard deviation, means that the values are spread out over a wider range., The square root of the var, variance, iance is known as the standard deviation, i.e. S.D. = √σ., , 4. Quartiles and Quartile Deviation, Deviation: The quartiles are values that divide a list, of numbers into quarters. The quartile deviation is half of the distance, between the third and the first quartile., Quartile deviation or semi, semi-inter-quartile deviation is, Q = ½ × (Q3 – Q1), 5. Mean and Mean Deviation: The average of numbers is known as the mean, or arithmetic mean., Government Polytechnic, Udupi, , Page 8
Page 9 :
Statistics and Analytics, The, he arithmetic mean of the absolute deviations of the observations from a, measure of central tendency is known as the mean deviation (also called, mean absolute deviation)., , Skewness:, , It is the degree of distortion or twisting from the symmetrical bell curve or the, normal distribution. It measures the lack of symmetry in data distribution., It differentiates extreme values in one versus the other tail. A symmetrical, distribution will have a skewness of 0., There are two types of Skewness: Positive and Negative, , Government Polytechnic, Udupi, , Page 9
Page 10 :
Statistics and Analytics, Negative SkewNo SkewPositive Skew, , Positive Skewness means when the tail on the right side of the distribution is, longer or fatter. The mean and median will be greater than the mode., Negative Skewness is when the tail of the left side of the distribution is longer or, fatter than the tail on the right side. The mean and median will be less than the, mode., So, when is the skewness too much?, The rule of thumb seems to be:, , , If the skewness is between -0.5 and 0.5, the data are fairly symmetrical., , , , If the skewness is between -1 and -0.5(negatively skewed) or between 0.5 and, 1(positively skewed), the data are moderately skewed., , , , If the skewness is less than -1(negatively skewed) or greater than 1(positively, skewed), the data are highly skewed., , Kurtosis:, Kurtosis is all about the tails of the distribution — not the peakedness or flatness. It, is used to describe the extreme values in one versus the other tail. It is actually, the measure of outliers present in the distribution., High kurtosis in a data set is an indicator that data has heavy tails or outliers. If, there is a high kurtosis, then, we need to investigate why we have so many outliers., It indicates a lot of things, maybe wrong data entry or other things., Low kurtosis in a data set is an indicator that data has light tails or lack of outliers., If we get low kurtosis (too good to be true), then also we need to investigate and, trim the dataset of unwanted results., Government Polytechnic, Udupi, , Page 10
Page 11 :
Statistics and Analytics, , Mesokurtic:: This distribution has kurtosis statistic similar to that of the normal, distribution. It means that the extreme values of the distribution are similar to that, of a normal distribution characteristic., Leptokurtic (Kurtosis > 3): Distribution is longer, tails are fatter. Peak is higher, and sharper than Mesokurtic, w, which means that data are heavy-tailed, tailed or profusion, of outliers., Platykurtic: (Kurtosis < 3): Distribution is shorter, tails are thinner than the, normal distribution. The peak is lower and broader than Mesokurtic, which means, that data are light-tailed or lack of outliers., The reason for this is because the extreme values are less than that of the normal, distribution., , Government Polytechnic, Udupi, , Page 11
 Learn better on this topic