Notes of 2 SEM CS, Statistics and Analytics UNIT 1 - Study Material
Page 1 :
Statistics and Analytics 20SC01P, , UNIT:1 STATISTICAL DATA COLLECTION AND TYPES, , Statistics:, Statistics is the study of the collection, analysis, interpretation, presentation, and, organization of data. In other words, it is a mathematical discipline to collect,, summarize data., According to statistician Sir Arthur Lyon Bowley, statistics is defined as, “Numerical statements of facts in any department of inquiry placed in relation to, each other”., Government polytechnic, Udupi, , Page 1
Page 2 :
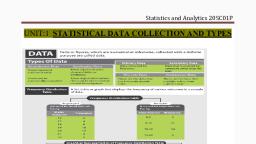
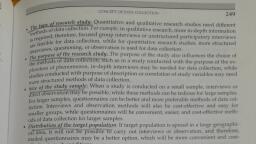
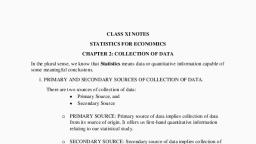
Statistics and Analytics 20SC01P, Data analysis is the process of filtering, transforming, and modelling data to, discover useful information., Example: before planning a business plan, analysis of budget, resource and target, sets the perfect example for data analysis., Scope:, Statistics is used in many sectors such as psychology, geology, sociology, weather, forecasting, probability and much more. The goal of statistics is to gain, understanding from the data, it focuses on applications, and hence, it is distinctively, considered as a mathematical science., Methods:, The methods involve collecting, summarizing, analyzing, and interpreting variable, numerical data. Here some of the methods are provided below., , , Data collection, , , , Data summarization, , , , Statistical analysis, , Data:, Data is a collection of facts, such as numbers, words, measurements, observations, etc. Data can be defined as a systematic record of a particular quantity. It is the, different values of that quantity represented together in a set. It is a collection of, facts and figures to be used for a specific purpose such as a survey or analysis., When arranged in an organized form, can be called information., , Types of Data:, Depending on the type of data, the data collection method, Data is divided into two, categories namely,, ➢ Primary Data or primary data collection methods -Primary data or raw data is a, type of information that is obtained directly from the first-hand source through, experiments, surveys, or observations., Government polytechnic, Udupi, , Page 2
Page 3 :
Statistics and Analytics 20SC01P, ➢ Secondary Data or Secondary data collection methods-Secondary data is the, data which has been already collected and analysed by someone other than the, actual user., The primary data is further classified into two types., Qualitative data- it is descriptive data. They represent some characteristics, or attributes. They depict descriptions that may be observed but cannot be, computed or calculated. For example, data on attributes such as intelligence,, honesty, wisdom, cleanliness, and creativity collected using the students of, your class a sample would be classified as qualitative., , , Example- She can run fast, He is thin., , Quantitative data- it is numerical information. These can be measured and, not simply observed. They can be numerically represented and calculations, can be performed on them. For example, data on the number of students, playing different sports from your class gives an estimate of how many of the, total students play which sport. This information is numerical and can be, classified as quantitative., , , Example- an Octopus is an Eight legged creature., , Types of quantitative data:, 1. Discrete data- It has a particular fixed value. It can be counted. These are, data that can take only certain specific values rather than a range of values., For example, data on the blood group of a certain population or on their, genders is termed as discrete data. A usual way to represent this is by using, bar charts., 2. Continuous data- It is not fixed but has a range of data. It can be measured., These are data that can take values between a certain range with the highest, and lowest values. The difference between the highest and lowest value is, called the range of data., Government polytechnic, Udupi, , Page 3
Page 4 :
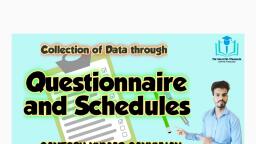
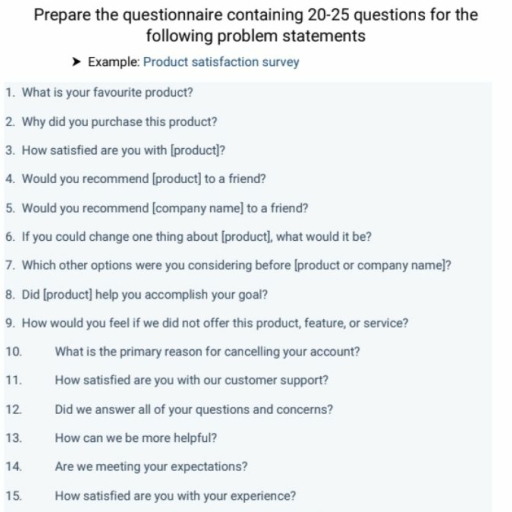
Statistics and Analytics 20SC01P, For example, the case of the height and weights of the students of your, school. These are classified as continuous data. Continuous data can be, tabulated in what is called a frequency distribution. They can be graphically, represented using histograms., , Data collection tools:, Data collection is a process of gathering information from all the relevant, sources to find a solution to the research problem. It helps to evaluate the, outcome of the problem. The data collection methods allow a person to, conclude an answer to the relevant question., Most of the organizations use data collection methods to make assumptions, about future probabilities and trends. Once the data is collected, it is necessary, to undergo the data organization process., 1. QUESTIONNAIRES, This is the process of collecting data through an instrument consisting of a series of, questions and prompts to receive a response from individuals it is administered to., Questionnaires are designed to collect data from a group., For clarity, it is important to note that a questionnaire isn't a survey, rather it forms, a part of it. A survey is a process of data gathering involving a variety of data, collection methods, including a questionnaire., 2. SURVEY, A survey is a data collection tool for gathering information from a sample, population, with the intention of generalizing the results to a larger population., Surveys have a variety of purposes and can be carried out in many ways depending, on the objectives to be achieved., , Government polytechnic, Udupi, , Page 4
Page 5 :
Statistics and Analytics 20SC01P, 3. INTERVIEW, An interview is a face-to-face conversation between two individuals with the sole, purpose of collecting relevant information to satisfy a research purpose. Interviews, are of different types namely; Structured, Semi-structured and unstructured with, each having a slight variation from the other., 4. FOCUS GROUP DISCUSSION, The opposite of quantitative research which involves numerical based data, this, data collection method focuses more on qualitative research. It falls under the, primary category for data based on the feelings and opinions of the respondents., This research involves asking open-ended questions to a group of individuals, usually ranging from 6-10 people, to provide feedback., , DATA CLEANING:, Data cleaning is the process of fixing or removing incorrect, corrupted, incorrectly, formatted, duplicate, or incomplete data within a dataset. When combining multiple, data sources, there are many opportunities for data to be duplicated or mislabelled., Data cleaning is the process that removes data that does not belong to your dataset., , Characteristics of quality data:, 1. Validity. The degree to which your data conforms to defined business rules or, constraints., 2. Accuracy. Ensure your data is close to the true values., 3. Completeness. The degree to which all required data is known., 4. Consistency. Ensure your data is consistent within the same dataset and/or, across multiple data sets., 5. Uniformity. The degree to which the data is specified using the same unit of, measure., , Government polytechnic, Udupi, , Page 5
 Learn better on this topic