Page 1 :
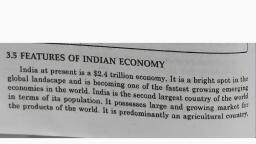
Q.1) Explain the basic characteristics of Indian economy., , World economy has been divided into developed and underdeveloped countries. The industrial, countries like USA, Canada, Australia and Western European countries are considered as developed, countries with high per capita income due to their economic development., Basically, world economy has been divided in two categories; one is developed countries and second is, underdeveloped countries. Those countries been achieved high growth, considered as developed, countries like USA, Aus, Canada, western European countries. Whereas, those countries with per capita, income less than 25 percent of USA are included among underdeveloped countries But now, as per U.N., consideration It is called developing economies instead of underdeveloped countries. Which means a, country which has god potential for arguing development projects with more available of natural, resources Its support to percent population on higher level of living., WORLD DEVELOPEMNT REPORTS, 2008 CLASSIFED THE VARIOUS CONTRIES ON THE BASIS OF Gross, national income (GNI) per capita dollars given below., a. Low income countries with 8906 and below GNI per Capita, b. Middle income countries with ranging between 8906 and 811115, 1) Lower middle income with per capita income 8905 to 83595, 2) Upper middle income with per capita income 83596 to 811115, c. The high income countries with per capita income of 811116 and above, Indian Economy:, India with a per capita GNI of 83100 continues to be in the group of lower middle income, economies India will very soon enter the group of upper middle income India considered developing as, per GDP rats, but as per following characteristics Indian economy indicates underdeveloped country., , , Basic characteristics of Indian Economy :, Broadly, it classified into three section I.e. 1) economic features 2) Demographic, features 3) cultural and social features., 1) Low per capita income :, As per capita income India is ranked quite at bottom in the series of countries arranged in a, descending order, of some of the underdeveloped countries like Pakistan, Thailand etc have, more per capita than India, In comparison, that the per capita income of the USA is about 67 time higher, that of Canada, about 57 times higher that of Switzerland about 75 times higher, that of Germany about 48, times and Japans about 116 times higher than that of India in 2004. Such low per capita income, in India is the outcome of slow growth of Gross Domestic Product due to improper utilization of, our natural resources., 2) Low rate of capital formation :The insufficient amount of physical capital is the basic hurdle of India’s economic, development. The capital flows are extremely lower and also capital formation is low, In, India, the rate of saving and investment is comparatively very small., 3) Unemployment., Indian economy is characterized by the existence of unemployment and, underemployment, surplus manpower has been the problem of our country. It can be
Page 2 :
noted that there considerable regional variations in employment. Due to unskilled, manpower it has extremely difficult to provide gainful employment. After 1991, India, achieves jobless growth., 4) Poverty, A large number of Indians are suffering from poverty. Due to inequality of wealth and, income sources poverty are much wider. Majority of people in India are employed to activities, which do not yield sufficient income to meet the basic needs. At the time independence India’s, with 36.1 core population among them 50% below poverty line. It means 18 crore people, suffering from poverty, in 2006-07, 22 crore people suffering from poverty. It indicates that, number of people under B.P.L has been increased., 5) Agri-based economy., In India 65% population depends upon agriculture for its livelihood. In developed, countries the dependence on agriculture is very low, for instance, in the U.K. population, depend on agriculture is 2%, in the USA it is 21% and Canada 5%. This shows that there, is a great pressure of population on land in India., 6) Industrial backwardness., The industrial development in India has been very slow. Hardly 10% of the total, population is yet engaged in industry. Industry in India is still confined largely to the, production of consumer goods like textiles, sugar, etc, there is need to develop capital, goods industry., 7) Under utilization of Natural Resources :Most of the natural resources like water resources, forest resources and mineral, resources remain very largely unutilized in India. Due to lack of capital the natural, resource the left utilized., 8) Poor economy organization, Indian economy suffers from poor economic organization. Some of the institutes like, banks marketing system, etc, Which are required in the development of the economy public sector doesn’t properly, working. Lack of managerial skills:Less number of industrial family monopolized commercial and industrial enterprises,, Due to this monopoly small industries could not stand in competition with big, industries. Rate of industrial growth remain slow., 9) Predominance of primary exports :India exports row material and food products and imports machinery. Due to, predominance of primary sector Indian economy depends on imports of capital goods., Accordingly, India’s balance of payment remains imbalance., 10) Unequal distribution of Income :There is unequal distribution of personal income majority people stands at a much, lower level of than all India average, according to one estimate 50% of the population, gets only 20% of people at the top of Income level gets 20% of the national income. Due, to unequal distribution of income majority people live below poverty Line., 11) Low level of technology :-
Page 3 :
Indian economy is comparatively backward in technology development. Agriculture,, which is the biggest sector suffer from low productivity, our agriculture methods of, production is very traditional. This is because of lack of research and low expenditure of, education., B. Demographic Features:1. Rapid growth of population, In India population has been growing with high rate of 2.11 % p.a It has risen from 36% crores in, 1951 to 115 core in 2011 over population is the main problem of Indian economy Itf it is transform to, skilled manpower it could be helpful to economic development, 2. Nutrition:Nutrition standards in India are generally very poor on account of poverty and backwardness., Poverty is the main cause of malnutrition. It means most people under the bad cycle, of poverty. Due to, mal nutrition Indian people having less efficiency., C. Cultural and Social features., 1. Less mobility:Due illiteracy Indian people lacking their mobility they prefer to stay near their relatives. There, are so many hurdles like religion, caste, language, and also culture., 2. Illiteracy:Indian people are uneducated or illiterate; illiteracy ration is comparatively low in rural areas after 60, years of independent 30 to 40% population remain uneducated., , Q.2) Explain the main factors of economic development., in understanding development, the first thing is to be clear about what it implies how to represent the, development underdeveloped and developing economies characterized by poverty circle and all type of, backwardness. Economic development should primarily aim at raising the incomes of people., Definition: According to Meier, Economic development as the process whereby the real income, of country increases over a long period of time and same time absolute poverty line does not increase as, well as distribution of income does not became more unequal., Factors determining Economic development as Follows, 1. Natural resources :India has sufficient natural resources, How to utilized these available natural resources I the key, problem India having various type of climate, soil , minerals, rainfall, sources of power and energy. It is, needed some resources can be renewed with proper conservation practices, some resources can be, added, increases the quality of resources etc.
Page 4 :
2. Human Resources :The size and quality of labour are of Vitol importance in determining productive, capacity. Growing size of productive sector should be helpful to development Quality of, population depend upon its health, education training, moral behavior, etc. then, provision of pure drinking water, medical facilities, education and training opportunities, etc, these facilities should improve mom skill and machine skills. Therefore, economic, development depends upon human resource development., 3. Capital formation :The capital stock of a country determines in a large measure of productive capacity, Real, capital per worker shows its output capacity. As such capital stock is important to, increase growth rate., When rate of income, saving and investment increasing size it should be helpful, to increase growth rate; Initial stage of economic development, there are need to, increase rate of capital formation then policy measure adopt to develop financial, market mechanism., 4. Technological progress :Technological progress turning out the better product at the same cost or lower cost, contributes to increase in output. New and high techniques of production method such, as new machines and equipment are gainful to producing more goods and services., Technical knowledge is an independent factor there is no doubt the fact that, capital formation and technical progress are closely related development process., 5. Ensuring capacity utilization :, Beside the four factors namely natural resumes human resources, capital formative and, technological progress it is needed to ensure that the existing capacity fully utilized. To, avoid under utilization of capacity, it is necessary to maintain aggregate demand at the, level of full employment of productive capacity. For the capacity utilization it is require, to match that the expenditure on consumer goods and supply of consumer goods, that, will be better to balanced growth., 6. Efficient production :- (Proper allocution of Resources), Another consideration is to ensure efficient production through proper allocation of, resources. This involves two steps, one is related to the allocation of resources on the, production side of the development process, when, country is growing. The second step, concerns the arrange in the economic structure to suit the changing pattern of, consuming with rise in income that growth make possible, 7. Appropriate environment :The attitudes of the people towards economic activities and business leadership labor, leadership can promote growth. A good government can frame suitable policies,, prepare right kind of plans, create opportunities for entrepreneur for entrepreneurial, ability, it can also make production relations by changing land tenure system,, undertaking creation of inform structural facilities etc It can help development process, of a country., Economic development requires factors like natural and human resources, capital, formation and technological progress, It is also necessary that the production capacity is, fully utilized, production is efficient and the agencies and people’s aphides are progrowth., 1.3 National income In India Trends & limitation of National income estimation.
Page 5 :
Q1) Explain method of national income and its limitation in & estimation, , National income is the flow of goods and services which becomes available to a nation during an, accounting period, generally one year. Thus, total of national income measured the flow of goods and, services in an economy. National income is a flow not a stock., The national income data is useful in following ways, 1. Data help to understand the performance of the economy at a particular period of time., 2. National income presents the economic position of a country with all aspect and structure of the, economy., 3. Data indicates the economic welfare the people., 4. National income data is useful in formulation of economic planting., National income estimate, thus measure the volume of commodities and services turned out, during a given period, counted without duplication, National income cannot be measured and, calculated accurately and exactly, as it is impossible to add up the value of all the produces, goods and services in a year. Hence, national income is generally estimated following the, methods of statistics. So, they are estimate only., , , Methods of estimation of N.I. in India., o The Central Statistical Organization (CSO) adopted the flowing procedure in estimating, India’s national income, , 4) Sectoral division of Economy., The CSO estimates have divided the domestic economy into 13 sectors, are grouped under main, 1) Primary sector included i) agriculture ii) forestry iii) fishing iv) Mining, 2) Secondary sector included i) Manufacturing ii) construction iii) Electricity, gas and water supply, 3) Service sector included i) Transport, communication and Trade ii) fiannnce and real estate iii), community and personal services, 4) Foreign sectors NQI, PDI, FII MNC, debt etc., Method of estimate, National income estimation in India is not possible by using a single method. Both the, output and income method have been used., 1) Output method – output method is used to estimate the income from six sectors i.e., agriculture, animal husbandry, forestry, fishing, mining and factory establishment., 2) Income method census of income method is used to estimate the income from, remaining serves sectors i.e. small enterprises, banking & insurance, trade and, transport, public sector and house property., , National Income Trends in India
Page 6 :
There has been improvement in India’s Net national product under the five year plans of, economic development following trends shows after independence., , , N.N.P Net National Product :, o NNP of India has increase more than nine times by 2003-04. The Net National product of, 1993-94 prices is Rs. 132379/- crore in 1950-57 and it reached to Rs. 23,93,671 crore in, 2004-2005, o The Net National product has grown of a modest rate of 4 percent per annum, but, during 1980-81 to 2000-01 the rate of increase to the Net National product has been 55, percent per annum, o Except during first and seventh plans, the targets of growth rates of National income has, not been achieved, o Net national product factor cost at current prices is Rs. 15, 89,672 crores in 1999-2000, and during 2006-07 of is 33, 25,817 crores., Since the country’s population has been growing fast over these period, per capital, income has become double during the five decades of the plan period., Limitation difficulties of National Income Estimation in India-, , 1. Lack of reliable statistics: - correct statistical information regarding agriculture and allied, occupation not available. There is also no information available regarding consumption, expenditure and savings of either rural or urban population. The data supplied by the village, officers on the basis of guesswork, 2. Difficulty of estimating the output: A considerable portion of the agricultural output does, not come to the market for sale; nut is either consumed by the produces themselves or is, bartered away with other producers in exchange for then goods and services. Hence, the, imputed value of the producers of the non-monetized sector is being added to the value of the, monetized sector., 3. Lack of accounting habit: Illiteracy of the people leads for the absence of the practice of, keeping accounts they are not habituated in maintaining the account books. Hence, the data, available is made guess and unreliable., 4. Inability to estimate : Most of the Indian producers are not capable of providing the correct, values of their product An element of guesswork, therefore, invariably enters into the, assessment of output produced in agriculture and in household enterprises, 5. Unorganized producing units: for the most part, product in agricultural and industrial sectors is, unorganized scattered. It is not easy to calculate the value the product., 6. Lack of proper classification: - the major part of the Indian economy consists of household, enterprises and it is difficult to calculate as they perform function belonging to the different, occupational categories. That is particular so because farmers in India in mass of the cases, prepare just one crop in the whole year and in their freedom have a tendency to accept, alternative work in the unorganized sector. This fact poses a real problem in determining the, occupations of such people, 7. Unreported illegal income: - In India a sizable part of the economy of creates as a black economy, productive activities this sector are under reported and as a result the income generated in it, reports either entirely unreported or is only partly reported. It is rather difficult to estimate this, income correctly, 8. Regional disparities: - India is sub continent with rage geographical and economic disparities., Information based or samples taken from certain districts in a particular state may or may not
Page 7 :
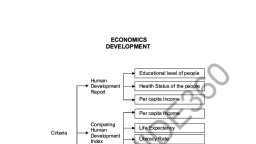
be valid for the whole state or the region to which these districts belong. If the required, information is to be abstained through sample surveys. Special care would be needed in using, this technique., 9. Limitation of inclusion of certain services: the Basic conceptual problem which still remains, unresolved is whether services are to be included in national income or not Services which are, monetarily measurable are included in the national income in India. The exclusion of services of, housewife driving one’s own car, etc. make national income estimates an imperfect measure of, economic activity as most housewives do not work for wages., 10. Lack of common denominator: - There is the universal academic difficulty of reducing the, numerous economic activities of the millions of people to common measurable denominator., For example, how to add to gather the services of manual labour and the scientists., , 1.4 human developments in India, Concept, measurement & progress, , Introduction, In modern era, human development is the most important concept which indicates the, real development of a nation human resources considered as the one of consequent factor of Economic, development the study of human development is vital form the point of view of economic welfare. It is, particularly important because human beings are not only instruments of production but also ends in, themselves., Definition: - According to Human Development Report (1997), It as the process of widening people choices and the level of well being they achieve are at the core of, the notional of human development., , Human development required three essential choices for people are to lead a long and healthy, life, to acquire knowledge and to have access to the resources needed for a decent standard of living., Human development does not and there, however otter choices highly valued by many people,, range from political, economic and social freedom to opportunities for being creative and productive, and enjoying self-respect and guaranteed human rights. (Mehbub oll-hack), Three measures have been developed. They are –, Human Development Index (HDI), GENDER Related Development Index (GDI) and, HUMAN POVERLY INDEX (HDI, A. Human Development Index (HDI)
Page 8 :
HDI measures the average achievement in three basic dimensions of human, development., 1) A long and healthy life as measured by life expectancy at birth., 2) Knowledge as measured by the adult literacy rate nods the combined primary,, secondary and tertiary gross enrolment ratio., 3) A decent standard of living as measured by GDP per capita., Before calculating HDI, an index for each of three dimensions is created. For this, propose maximum & minimum values are chosen for each indicator which given, below., Maximum & minimum values for calculating HDI., , Indicator, 1. Life expectancy at, birth`, 2. Adult literacy rate, 3. Gross enrolment ratio, 4. GDP per capita [s], Dimension Index =, , Maximum value, 85, , Minimum value, 25, , 100, , 0, , 40,000, , 100, , Actual value – minimum value, Maximum value – minimum value, , Graphical presentation of DHI, Long & healthy life, , B. Gender Related Development Index [GDI], The gander related index adjusts the average achievement to reflect the inequalities’, between men & women the three components used for the purpose are:, i), ii), iii), , Female life expectancy, Female adult literacy and gross enrolment ratio, and, Female per capital income if gender inequality do not exists, the value of GDI &, HDI, , Would be the same but if gender inequality exists, the value of GDI would be lower than that of HDI., The grater the difference between HDI &GDI the grater is the gender inequality., According to human Development Report 2009 it may be noted that near gender equality exists, in Norway, Canada, United States, United Kingdom, Japan, Mexico, Malaysia, Venezuela, Philippines,, Silence, China, Vietnam and Indonesia.
Page 9 :
Countries which indicate gender inequality are Saudi Arabia, Pakistan, Iran, India, Egypt, & Nigeria. However, there is greater awareness in the world about gender inequality and efforts are, being made to reduce gender inequality by promoting education of females and giving them a better, status in the family., C) Human Poverty Index (HPI), HD Report 1997 introduced the concept of HPI, which concentrates on deprivation in three, essential elements of human life already reflected in HDI – longevity, knowledge and a decent living, standard., 1. The first deprivation is related to life expectancy and it is measured by percentage of people die, before age 40., 2. The second deprivation is related to knowledge and is measured by the percentage of adults, who are illiterate, 3. The third deprivation relates to decent standard of living. This is represented by a composite of, three variables – the percentage of people with access to a) health services b) to safe water c), the percentage of malnourished children under five., It would be relevant to understand why income does not figure in Human Poverty index (HPI)., According to HDI (1997), the logic underlying the construction of economic provisioning is that the, GNP included in the HPI is actually a combination of private and public facilities, since public services, are paid out of aggregate national income., HPI decided to use the prevalence of malnutrition of children which is relatively easier to measure, and for which data are more readily available along with access to health services and safe water., United Nations Millennium Declaration for 2015, 1., 2., 3., 4., 5., 6., 7., , To halve the proportion of the world’s people living on less than & 1 a day., To halve the proportion of the worlds people suffering from hunger, To halve the proportion of world’s people from without access to safe drinking water., To achieve gender equality in access to education., To reduce maternal mortality ratios by three quarters, To reduce under give motility rates by two –thirds., To Holt and begin to reverse the spread of HIV/AIDS, Malaria and other major diseases., , Progress of Human Development in India
Page 10 :
The basic purpose of planning in India is to widen People’s choices and improve the well being, of the people, In this context, human development was the key issue so that, people could lead a long, and healthy life, they could acquire knowledge so as to have better vertical mobility in life. To achieve a, decent standard of living of all. It would be, therefore, appropriate to examined the progress of human, development in India., 1) General Indicators., India has been categorized by the Human Developed Report 2007-08 as a median human, development country. The HDP has risen gradually from 0.406 in 1975 to 0.510 in 1990 and, stands of 0.619 in 2005. In fact it can take quite long for India to cross the mark of 0.8 in HDI to, join the rank of high HDI countries, , , For the purpose of improvement in HDI of India, it is expected that growth rate of population, during 2000-2015 will come down to 1.3% this would provide a welcome addict to push forward, the process of human development., , The share of urban population which was 27.8% in 2001 it would reach the level at 32.2% by till, 2015 It would be also quite useful to consideration factor related with the education that are likely, to promote human development. The most important factor is adult literacy rate, which was 61.0%, in 2005. The share of India in the world’s illiterate population is 33.3%, The combined Gross Enrolment Ratio, which was only 61.0% in 2005 in India. There is, need increase public expenditure on education so far as youth literacy rate is concerned, it, 76.4% in 2005, Health Indicators, Life expectancy –, Life expectancy of birth has shown a continues improvement from 50.7 years during, 1970-75 to 66.0 years surviving to age 40 is 15.5% in 2005-10. India has to improve health facilities as, well as nutrition levels so that it can reduce the probability at birth not surviving to age 40., Children’s Health:, In this context, it would be relevant that 45% of children under five were underweight in 200006. The country should support a programme, of improving nutrition in poor families to reduce this, massive number of underweight children., Drinking water:Population not using improved water sources was 11% in 2006. Similarly, improved sanitation, facilities were not available to 33% of the population in 2004.
Page 11 :
Medical coverage:It is fact that 49% of the Indian population did not have access to essential drugs in 1999., The proportion of under-nourished people in India in 2004 was 20% this under – nourishment is, primarily due to the existence of poverty. There is need to strengthen poverty eradication strategies to, reduce under nourishment.