Notes of XII, Sociology Chapter-2 Study Notes (1) - Study Material
Page 1 :
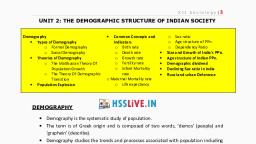
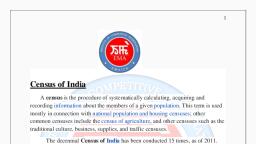
2. Demographic Structure of Indian Society, Demography is the systematic study of population. The term “Demography” is, derived from two Greek words, ‘demos’ (people) and ‘graphein’ (describe) meaning, the, description of people. Demography studies the trends and processes associated with, population including – changes in population size; patterns of births, deaths, and migration;, and the structure and composition of population, such as the relative proportions of women,, men and different age groups., Demography, can be classified into two:- Formal demography and Social, demography. Formal demography is primarily concerned with the measurement and, analysis of the components of population change. It focused on quantitative analysis for, which it developed mathematical formula. Population studies or Social demography, on, the other hand, deals with the causes and consequences of population structures and change., It enquires the social reasons behind population trends. It focuses on the social, economic or, political aspects of populations., All demographic studies are based on processes of counting or enumeration –, such as the census or the survey – which involve the systematic collection of data on the, people residing within a specified territory. Demography is much important in sociology., Two different processes happened in eighteenth century Europe, which responsible for the, emergence of demography are– the formation of nation-states and the beginnings of, statistics., The American census of 1790 was probably the first modern census of the, world. In India, the First ten yearly or(decennial) censuses conducted since 1881during the, reign of Lord Rippon. The First census after independent was in 1951,and the last censuses, was in 2011., Demographic data are important for the planning and implementation of state, policies, specially those for economic development and general public welfare., SOME THEORIES AND CONCEPTS IN DEMOGRAPHY, 1.MALTHUSIAN THEORY OF POPULATION GROWTH:This theory was propounded by famous English political economist, Thomas Robert Malthus in his ‘Essay on Population’ published in 1798. He argued that, population increases much faster rate than the means of human subsistence (specially food,, clothing ) or food production. Therefore humanity is condemned to live in poverty forever, because the growth of agricultural production will always be low when comparing to, population growth. While population rises in geometric progression (i.e., like 2, 4, 8, 16, 32, etc.), agricultural production only grows in arithmetic progression (i.e., like 2, 4, 6, 8, 10, etc.). To eradicate poverty and increase prosperity, it is necessary to control the growth of, population. Unfortunately, humanity has only a limited ability to reduce the growth of, population through ‘Preventive checks’ such as postponing marriage or practising sexual, abstinence or celibacy). So Malthus believed in ‘Positive checks’ in the form of famines, and diseases – which are inevitable because they are the natural way of controlling, population explosion.
Page 2 :
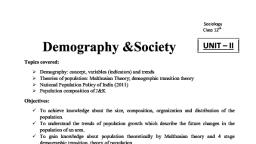
Criticisms, a) This theory was challenged by theorists who claimed that economic growth could, overcome population growth., b) European experience of nineteenth and twentieth century refute this theory. Birth rates, had declined, and outbreaks of epidemic diseases were being controlled. Malthus’s, predictions were proved false because both food production and standards of living, continued to rise despite the rapid growth of population., c) Malthus was also criticised by liberal and Marxist Scholars for asserting that poverty was, caused by population growth. They argued that poverty was caused by unequal distribution, of economic resources rather than by population growth., THEORY OF DEMOGRAPHIC TRANSITION, This theory advocated by Kingsley Davis, an American Sociologist, suggests that, population growth is linked to overall economic development and that every society follows, a typical pattern of development-related population growth. There are three basic stages of, population growth., STAGES, I, , II, , III, , FEATURES, , RESULT, , .Society is underdeveloped, .Technologically backward, .High birth rate and Death, rate, , Low growth rate, , .Society is developing, .Technologically advancing, .High birth rate and Low, Death rate, , High growth rate, , .Society is developed, .Technologically advanced, .Low birth rate and Death, rate, , Low growth rate, , Second stages is a transitional stage of movement from a backward to an advanced, stage, and this stage is characterised by a very high rates of growth of population. This, ‘population explosion’ happens because death rates are brought down relatively quickly, through advanced methods of disease control, public health, and better nutrition. However,, it takes longer time for society to alter its reproductive behaviour. It is a socio-cultural, phenomenon which related to various factors like illiteracy, poverty, religious belief, low, status of women etc:COMMON CONCEPTS AND INDICATORS, 1.Birth rate:- It is the total number of live births in a particular area during a specified, period (usually a year) divided by the total population of that area in thousands. In other, words, the birth rate is the number of live births per 1000 population.
Page 3 :
2.The death rate:- It is the total number of deaths in a given area during a given time per, 1000 population., 3.Infant Mortality Rate:-(IMR) It is the total number of infants (below one year of age), death per thousand live birth., 4.Maternal Mortality Rate:-(MMR) It is the total number of mother’s death at the time of, delivery per thousand live birth., 5.Growth rate of population refers to the difference between the birth rate and the death, rate. When this difference is zero (or, in practice, very small) then we say that the population, has ‘stabilised’or has reached the ‘replacement level’, which is the rate of growth required, for new generations to replace the older ones that are dying out. Sometimes, societies can, experience a negative growth rate – when their fertility levels reach below the replacement, level or the difference between the birth rate and the death rate become below zero., 6.The fertility rate refers to the number of live births per 1000 women in the child-bearing, age group of 15 to 49 years., 7.The total fertility rate refers to the total number of live births that a hypothetical woman, would have if she lived through the reproductive age group of 15 to 49, and had the average, number of babies in each segment of this age group as determined by the age-specific, fertility rates for that area., 8.Life expectancy refers to the estimated number of years that an average person is, expected to survive., 9.The sex ratio refers to the number of females per 1000 males in a given area, at a specified time period., Historically, all over the world it has been found that there are slightly more females, than males in most countries. This is despite the fact that slightly more male babies are born, than female ones; nature seems to produce roughly 943 to 952 female babies for every 1000, males. If despite this fact the sex ratio is somewhat in favour of females, this seems to be, due to two reasons. First, girl babies have more resistance to disease in infancy. Second, women have tended to outlive men in most societies, so that there are more, older women than men., However, it has been found that the sex ratio has been declining in some, countries like China, South Korea and specially India. This phenomenon has been linked to, prevailing social norms that tend to value males much more than females, which leads to, ‘son preference’ and the relative neglect of girl babies., 10.The age structure of the population refers to the proportion of persons in different age, groups relative to the total population or the distribution of population in to different age, category. When smaller proportions of the population are found in the younger age groups, and larger proportions in the older age groups. This is referred to as the Ageing of the, population.
Page 4 :
11.The dependency ratio is equal to the population below 15 or above 64, divided by, population in the 15-64 age group; the ratio is usually expressed as a percentage. A rising, dependency ratio is a cause for worry as the working-age people may carry the burden of, providing for a relatively larger proportion of dependents. It will adversely affect our, savings, investment, economic growth, standard of living and development. On the other, hand, a falling dependency ratio can be a source of economic growth and prosperity due to, the larger proportion of workers relative to non-workers. This is sometimes referred to as, the ‘demographic dividend’, or benefit., SIZE AND GROWTH OF INDIA'S POPULATION, India is the second largest populous country in the world after China, with a total, population of 121 corers (121093422 of which 62.31% Male and 58.74% Female).India, constitute 2.5% of the total world area but contain 17.6% total world population., Between 1901–1951 the average annual growth rate did not exceed 1.33%., Between 1911 and 1921 there was a negative rate of growth of – 0.03%. This was because, of the influenza epidemic during 1918–19 which killed about 12.5 million persons or 5% of, the total population of the country. After 1921 the growth rate of population substantially, increased., Before 1931, both death rates and birth rates are high. After 1931 the death, rates fall sharply due to following factors;, -control over famine and epidemic diseases, -improved medical facilities, -mass vaccination programme, -total sanitation programme, -modern technology, Famines were also a major source of increased mortality. High levels of, continuing poverty and malnutrition, variations in rainfall, Lack of adequate means of, transportation and communication as well as inadequate efforts on the part of the, state were some of the factors responsible for famines., Amartya Sen says that famines were not necessarily due to food shortage but, also caused by a ‘failure of entitlements’, or the inability of people to buy or otherwise, obtain food. National Rural Employment Guarantee Programme (NREP)is the latest state, initiative to tackle the problem of hunger and starvation in rural areas., Unlike the death rate, the birth rate has not registered a sharp fall. This is because, the birth rate is a sociocultural phenomenon that is relatively slow to change. Total fertility, rates (TFR) across India is 2.4, while it is 2.1 in Tamil Nadu and 1.7 in Kerala which is, below the ‘replacement level.’ TFR of Bihar, Madhya Pradesh, Rajasthan and Uttar, Pradesh, were 3.9, 3.3, 3.3 and 3.7, respectively.
Page 5 :
AGE STRUCTURE OF THE INDIAN POPULATION, India has a very young population – that is, the majority of Indians tend to be, young, and it is also less than that for most other countries. The share of the under 15 age, group in the total population has come down from 42% in 1971 to 35% in 2001. The share, of the 15-60 age group has increased slightly from 53% to 59%, while the share of the 60+, age group is very small but it has begun to increase (from 5% to 7%). But the age, composition of the Indian population is expected to change significantly in the next two, decades., In 2020, the average Indian will be only 29 years old, compared with an average, age of 37 in China and the United States, 45 in Western Europe, and 48 in Japan. This, implies a large and growing labour force, which can deliver unexpected benefits in terms of, growth and prosperity., , Population Pyramid, It is a histogram which shows the percentage of male and female belongs to, different age category on both sides of a vertical line. The diagrammatic representation of, age-sex composition is called Population Pyramid., As more and more people begin to live to an older age, the top of the pyramid grows, wider. As relatively fewer new births take place, the bottom of the pyramid grows narrower., The middle of the pyramid grows wider and wider as its share of the total population, increases. This creates a ‘bulge’ in the middle age groups that is clearly visible in the, pyramid for 2026. This is what is referred to as the ‘demographic dividend’., Projection:The pyramid shows the estimated future size of the relevant age groups based, on data on the past rates of growth of each age group. Such estimates are also called, ‘projections’., THE DECLINING SEX – RATIO IN I NDIA, The sex ratio is an important indicator of gender balance in the population. As, mentioned in the section on concepts earlier, historically, the sex ratio has been slightly in, favour of females, that is, the number of females per 1000 males has generally been, somewhat higher than 1000. However, India has had a declining sex-ratio for more than a, century. Sex ratio has declined to 933 in 2001. The trends of the last four decades have been, particularly worrying – from 941 in 1961 the sex ratio had fallen to an all-time low of 927 in, 1991. And now it is 940 females per 1000 males., But child sex ratio is falling deeply. It was 976 in 1961 declined to 914 in, 2011.Punjab is the worst with an incredibly low child sex ratio of 793 (the only state below, 800), followed by Haryana, Chandigarh, Delhi, Gujarat and Himachal Pradesh., Factors for declining child sex ratio, 1. health factors, 2. maternal mortality
Page 6 :
3. neglect of girl child, 4. female infanticide, 5. foeticide, 6. dowry system, 7. availability of sonogram, 8. illiteracy, 9. abortion, LITERACY, A person aged seven or above, who can both read and write with understanding in any, Indian language is called a literate person. India's literacy as per 2011 census is 74.04%, (Male:82.14,Female:65.46).Deference between Male Female literacy is 16.7%..State with, highest literacy is Kerala 94.0% followed by Mizoram. Least literate states are Bihar and, Jharkhand., Merit of literacy, a) an instrument of empowerment., b) career options,, c) can participate in the knowledge economy., d) lead to health awareness., e) fuller participation in the cultural and economic well being of the community, Demerit of literacy, * may lead to poverty, * unemployment, * low standard of living, * low status of women, * population explosion, * superstitious belief, RURAL -URBAN Differences, Majority of the population of India live in the rural areas. According to 2011 Census 68.8%, population lives in rural areas while 31.2% people live in urban areas. Mass media and, communication channels are now bringing images of urban life styles and patterns of, consumption into the rural areas. Consequently, urban norms and standards are becoming, well known even in the remote villages, creating new desires and aspirations for, consumption. Mass transit and mass communication are bridging the gap between the rural, and urban areas., Rural-to-Urban migration – causes, - employ mental opportunities, - continuous decline of common property resources like ponds, forests and grazing lands., - relative anonymity in cities
Page 7 :
- medical facilities, - educational opportunities, - unemployment, POPULATION POLICY IN INDIA, India was perhaps the first country which launched a population policy in 1952,, which was known as the National Family Planning Programme., Objectives:- try to influence the rate and pattern of population growth in socially desirable directions., - slow down the rate of population growth through the promotion of various birth control, methods,, - improve public health standards., - increase public awareness about population and health issues., The National Family Planning Programme was renamed as the National Family Welfare, Programme after the Emergency., Demographic Goals-2010, Make school education free and compulsory up to the age of 14 years and reduce, dropouts at primary and secondary school levels to below 20 per cent for both boys, and girls., Reduce infant mortality rate to below 30 per 1000 live births., Reduce maternal mortality ratio to below 100 per 100,000 live births., Achieve universal immunisation of children, Promote delayed marriage for girls, not earlier than age 18, Achieve 80 per cent institutional deliveries and 100 per cent deliveries by trained, persons., Achieve 100 per cent registration of births, deaths, marriage, Prevent and control communicable diseases., India's Demographic Achievements, * Reduced crude birth rate from 40.8 to 24.1, * Reduced Infant Mortality rate from 146/1000 live birth to 58/1000, * Reduced crude death rate from 25 to 7.5, * Life expectancy increased from 37 to 62 years, * Reduced total fertility rate from 6.0 to 3.0, * Increased awareness regarding family planning measures., , ***************
 Learn better on this topic