Notes of 12 Physics Practicals, Physics 12th Phy Term 2 Record - Study Material
Page 1 :
EXPERIMENT 1, AIM, , To find the value ofv for different values of, , mirror by plottinggraphs,, , between, , u, , and, , v, , u, , in, , case, , of concave mirror and to find the focal, , length f of the, , concave, , and, , and also between, u, , U, , Saraswati Lab Manual Physics-XIl59
Page 2 :
YOUNEED, pucal bench, 6. A metre scale., , with three, , uprights, , 4. Two needles 5., 2. Concave mirror 3. One mirror holder, , THEORY, The mirror formula gives the relation between object distance u,, , the image distance, , v, , and the focal, , A knitting needle, , lengthfofa concave, , mirror, as, , flU, , or, , u+U, , HOW TO Do, First of all determine the rough focal length of, , the given concave mirror by the following, -Image, , method:, , 1. Mount the concave mirror in the mirror, holder and go out in the open and face the, mirror towards the distant object like tree, or building. Obtain the image of the tree, or the building on a white paper or white, painted wall and move the mirror forward, and backward to get a sharp and clear, image on the wall or white paper. Now, measure the distance between the mirror, and the wall with the help of the metre, , scale. This distance is the rough focal1, , --Image, , Object needle, , needle, , M2, , Fig. 1.10 Ray diagram for the focal length ofthe concave mirror, , length of the mirror., 2. Clamp the holder with mirror in the fixed upright keeping mirror face towards other end of the bench and mirror, surface perpendicular to the length of the bench. Place this upright near zero end of the optical bench and two, other uprights near the other end. Make mirror surface vertical using levelling screws of the optical bench so that, the principal axis of the mirror must be horizontal and parallel to the optical bench. Now note the position of the, index mark on the base of mirror upright., , Mount the two needles on the two uprights and adjust their heights in such a way so that the tips of the two, needles and the pole, i.e., the centre of the mirror lie in the same straight line parallel to the length of the optical, bench. Mark O to the thin object needle and I to the thick image needle. Now determine the index corrections for, u and v for both of the needles as explained earlier., 4. Move the object needle upright and clamp it at a distance nearly 1.5 times the obtained rough focal length of the, , mirror. Since object is situated between focal point F and radius of curvature C, hence a real and inverted image, of object needle will be formed beyond C as shown in Fig. 1.10. You can see this inverted image in the mirror by, closing one eye and keeping the other eye open along the optical bench at the height of the pole of the mirror., , 5. Now move the thick image needle at the position I of the image of the ohject needle and adjust the height of the, , image needle sothat its tip is seen in the line with the tip of the image when seen right through open eye. Now, move the eye towards right, the tips will get separated. The image tip and image needle tip have parallax., Remove the parallax between the image needle and the image I of the object needle as explained earlier. In the, position of no parallax, the image needle locates the position of the image of the object needle., 6. Note and record the positions of the mirror, the thin object needle and the image needle on the bench scale., 7. Repeat the above steps for five different positions of object needle and record the observations in the table., , OBSERVATIONS, 1. Rough focal length of the given concave mirror = ... cm, 2. Actual length of the knitting needle = * = ... cm, , 3. Observed distance between the mirror and the object needle when the knitting needle is placed in between them, y, , =, , . . . Cm, , 60 SaraswatiLab Manual Physics-XII
Page 3 :
4. Observed distance between the mirror and the image needle when knitting needle is placed in between n, Z * . . . CIm., , Index correction for the object distance u =(t - y) = .. cm, Index correction for the image distance v = (x -z) =.. cm, , Tableforu, v, and, Position of, S, , No., , Concave, mirror, P, (cm), , Object, , Observed distance, , Image, , needle, , needle, , (cm), , (cm), , u = PO, , U=PI, , (cm), , (cm), , 20, , - 60, , 25, , - 31.5, , Corrected distance, , 1, , 1, , (cm), , (cm), , I, , 1., , 2, 3., , (cm), , (cm), , 0. 03, , 4., -, , 30, , (cm), , 0.05 . oIL-15, 0.04 0.026-5, - 14.9, , -32.3, , -2, , f, , 0. 036, , 0.033 0.033, , 3, , M e a n f = . . . Cm, , -, , 14.996, , CALCULATIONS, 1. Graphbetween u andu. Choose a suitable scale to represent, u along X-axis and v along Y-axis. The scale should be same for, X-axis as well as for Y-axis. In this case according to signconvention both u and v are negative. Plot the graph betweenu, and u for the different sets of values of u and . The graph will be, a rectangular hyperbola as shown in Fig. 1.1., Determination of focal length from the graph. Draw a line, OC which bisect the angle X'OY' and meet the graph at point C., , The co-ordinates of this point C are (-2f, -2f. Draw perpendiculars from Con OX' and OY axes which meet at A on OX' and, , 2f, , - u (cm), , 45, , ^, , (-2f,-2)C, Scale used on:, X-axis, 1 big square =... cm ofu, Y-axis, 1 big square, , -2f, B, , v (cm), , . . cm ofv, , B on OY axes. The distance AO = OB=-2f. Hence half ofthese, distances will give the focal length of the concave mirror., , Thus, , f, , OB cm, , Fig. 1.11 Graph between u and vfor a concave mirror, , 2, , Take the mean of these two values off., , Explanation. The value of u and v will be same for point C, sothe co-ordinates of point C must be (-2f,-2/ because, for a concave mirror u and v are equal only when object is placed at the centre of curvature, hence, u, , = U = R =-2f, , From the mirror formula,, , and, , For u = U,, , fO, , For the point C, we have, u, , = U = OA = OB, , Hence, Saraswati, , Lab Manual Physics-Xil61
Page 4 :
2. Graph betweenand.Choose a suitable but the same scale to representalong X -axis and, , -axis. In this case, , and, , both are negative. Plot a graph betweenand, , alono, , for the numbers of observations taken, , axes, X and Y at an angle of 45, graph will be a straight line as shown in Fig. 1.12. The straight line cuts the two, The, at pointsA and B, and making equal intercepts on the two axes. Measure OA and OB. We have the focal length,, , f=-A, Explanation. The graph between, , 1. If, , =0 ie.,, , u, , =, , OB, , cm, , andis expected to be a straight line as per mirror formula, , o then, , Thus interoept OB =, , =, , - 1/u (cm), , or intercept on Y-axis would be the, X, , measure of ., Scale used on:, , As OB is, , 2. If =, , negative, hencef =, , 1, , X-axis, 1 big square =... cm, , OB, , Y-axis, 1 big square..Cm, , -1, , 0 ie., v = o, then, , Thusintercept OA, Hencef, , -, , - a s 0A is negative., OA, , Fig.1.12 Graphbetweenandfora, concave mirror, , RESULT, 1. Mean value of focal length of concave mirror by computation from the table =.. em., 2. Focal length of the concave mirror as determined from the graph between u and u = . . cm., , 3. Focal length ofthe concave mirror as determined from the graph between, , and=.... cm., , TAKE CARE, 1. All the uprights should be vertical and principal axis of the mirror should be horizontal., , 2. Tip to tip parallax should be removed between needle and the image of the object needle., 3. Tips of the needles and the pole of the mirror should be at the same height as that of the pole of the mirror., , 4. Index correction for u and v should be properly determined and must be applied., 5. "To locate the position of the image, the eye should be at least 30 cm away from the needle., , SOURCES OF ERRORS, 1. The uprights may not be vertical., 2. The parallax removal may not be perfect., , 62 Saraswati Lab Manual Physics-XIl
Page 5 :
CHAPTER, , 2, REFRACTION, The phenomenon of bending of ray of light when it passes from one medium to another is called refraction of hght,, , REFRACTIVE INDEX, The ratio of speed of light in vacuum to the speed of light in a medium is called the refractive index of that medium., , Speed oflight in vacuum, , Refractive index of a medium, , Speed of light in medium, , SNELL'S LAW, Let i is the angle ofincidence in first medium andris the angle ofrefraction in second medium, then according to Snell's, aw,, , =, , Sin i, sin, , r, , EXPERIMENT 5, AIM, ) To determine the angle of minimum deviation for a given glass prism by plotting a graph between the angle of, incidence and angle of deviation., (ii) To determine the refractive index of the material of the prism., , yOUNEED, 1. A drawing board 2. A, 8. A protractor., , glass prism 3. A white, , sheet of paper 4., , N2, , NA, , PA, , X, , Drawing pins, , 5. A, , Na, , pencil, , 6. A scale 7. A, , N4, , P, o, , AB, , Q, , 45, , O4 A, , X, -, , Ea, , R2, Fig. 2.1 Refraction through prism at different angle of incidence and studying angle of deviation, , THEORY, The refractive index (p) of the material of the prism is given by:, , sin4+, where A is the, , sin, , A, , angle of the prism and D, , 74 Saraswati Lab Manual Physics-XIl, , is the, , angle of minimum deviation., , graph paper
Page 6 :
HOW, TO Do, , With the help of drawing pins, fix a, , white sheet of paper, , on, , the drawing, , board., , 9. Draw a straight lne XX° nearly at the centre of the paper and parallel to the length ot tne pape, , 3. Mark points, , N,Og, NgO3, 4., , NO, , O2 Og.. on the line XX at the suitable distances (about 5 or 6 cm) and draw normals j, , on points O, O2, Og.. as shown in Fig. 2.1., , Draw straght lines T,O1, T,0, T,0 ... making angles of 30°, 35, 40°, . . 60° with the normals NjO, 2, , N,Og. respectively., , Ma, , 5. Place the prism with one of its refracting surfaces on the line Xx and point O, in the middle of the prism. a, , the boundary of the prism ABC as shown in, Fig. 2.1., 6. Fix two pins P and Q vertically on the line T.O. Gincident rav line). The distance between the pins shoula D, about8 to 10 cm. Now view the images of P, and Q, throughtheface AC of the prism. Keeping one eye closed, , bring open eye in the line of the two images ofP, and . . . Fix two pins R, and S, on the paper vertically ana abo, 8 to 10 cm apart such that the tips of these pins and the tips of the images of the incident ray pinsPj ana d i a, , lie on the same straight line., 7. Remove the pins P1,, , and R, S and encircle their pin pricks on the paper., , 8. Join the points (pin pricks) R, and S, and produce it backwards to meet the incident ray T,0, produced (as shown, to, by dotted line in Fig.2.1). R,S, is the emergent ray corresponding to the incident ray T,O,. Mark arrow heaas, show the direction of incident and, , emergent rays., 9. Measure the angle E,F,S, with the help of the protractor. This gives the angle of deviation LD, , 10. Repeat the steps 5 to 9 for different values of angle of incident and measure the corresponding angle of devianon., , Take the values of angle of incidence ranging from 30°, 35°, 40°, 45°, 50°, 55° and 60°., , 11. Measure angle BAC in the boundary of the prism. This gives angle of the prism A., , 12. Record all the observations in the table., , OBSERVATIONS, 1. Angle of prism 'A' =., Table for angle of incidence and angle of deviation, , S.No., , Angle of deviation D, , Angle of incidence i, , 5°, , 30, 2, , 35, , 3., , 40°, , CALCULATIONS, , 38, , S2, , 60, , 7., , 48, , Plot a graph between angle of incidence i and angle, , of deviation D, taking i along X-axis and D along, Y-axis. The, , om37, , 38, , graph comes to be a, , curve as, , shown in, , Fig. 2.2., , 46, 44, , 42, , From this graph, determine the value of angle of, minimum deviation D, corresponding to the lowest, point of the graph, as shown in the Fig. 2.2., The value of angle of minimum deviation from, substitute the values of Aand, bne graph =D,,, m in the formula to compute the value of u:, =, , 40, 38, O-O, , 36, , Scale used on:, X-axis, 1 big square., Y-axis, 1 big square., , . . . ., , (A+L, , 34, , 32, , sin*a, , -, , 2, , 20, , 30, , 40, 50, 60, Angle of incidence () (in degree)+, , 70, , Fig. 2.2 Graph between angle of incidence and angle of deviation, , Saraswati Lab Manual Physics-XIl, , 75
Page 7 :
RESULT, , graph between i and D ndicates that as angle of incidence i increases, angle of deviation D first, decreases,, attains a minimum value D, and then again starts, increasing for further increase in angle of incidence., , 1. The, , 2. The angle of minimum deviation, D = ,, refractive index of the material of the, , 3. The, , prism (glass) 'p' is, , TAKECARE, 1. The pin should be fixed vertical., 2. Encircle the pin pricks after, they are removed., 3. Pins must be at a distance of, about 8 to 10 cm., 4. The angle of incidence should, lie between 30 to 60°., , 5. The same angle of, prism should be used for all the, 6. Draw the arrow to indicate the, 7., , observations., , incidence, the refracted and the emergent rays., The curve should be free hand, and smooth which should, pass through as many points as possible., , SOURCES OF ERROR, 1. Measurement of the, angle may be wrong., 2. Pin, , pricks may be thick., 3. The incident ray pins and, , emergent ray pins may not be along the same straight line., , EXPERIMENT 6, AlM, , To determine the refractive index of a, , glass slab, using a travelling microscope., , YoUNEED, 1. A, , glass slab 2. A marker 3. Travelling microscope 4. Lycopodium powder, , M, Eye, N, , H, , M, , DHM, , M, , ,R, , - R, , -R2, , R, , is, , L, (a), Fig. 2.3 Real and apparent thickness of the glass slab, , (b), , (c), , Fig. 2.4 Measurement of real and apparent thickness, of the glass slab by travelling microscope, , THEORY, In Fig. 2.3, a section ABCD of a glass slab of thickness Pis shown. IfP is a cross mark at the bottom of the slab. Aray of light, PQ from Pis incident at the top at the point Q at an angle of incidence i and refracts along QR at an angle of refraction r. It, appears to come from Pi which is the virtual image of real object of cross-mark P formed on normal PSN., , 76 Saraswati Lab Manual Physics-XIl
Page 8 :
Real thickness of the, glass slab, Apparent thickness of the glass slab, The refractive index of the, glass slab, , Hence,, , =, , =PS, PS, , Real thickness of slab, , =, , Apparent thickness of slab, , pR-R, , is the reading of real, depth at the bottom of the slab,, the, reading at cross-mark due to the, R is, refraction and, R is the reading at the top of the glass slab., , where R,, , HOW TO Do, the, , 1 .Place, , travelling microscope on the table near the window so that sufficient amount of light falls on 1t. ake, , by adjusting the levelingserews, alsoadjust the positionofeyepiece, the, pase, OTmeroscope, cross, wires, are clearly horizontal, visible., , so, , that the, , 2. Notethe number of divisions of Vernier scale which coincide with number of main scale divisions. Find the least, , count of microscope scale (1, 3., , M,S.D, -1 V.S.D.), , Make, ablack-ink cross mark the baseofthe microscope. This mark will act point R, [Fig. 2.4(a)]. Now make, the microscope vertical and move it very gently. Using the screw, focus the eyepiece on crosS-mark and bring the, on, , as, , eross-markin focus so that the cross of the cross wires of eyepiece coincides with the black cross mark on the base, , of the microscope. Note the main scale and vernier scale readings on vertical scale. This gives reading R, the given glass slab on the black cross-mark. It is observed that the cross-mark appears to be raised. Now, , 4. Place, , move the microscope gradually and gently upward to bring the cross-mark in focus on the cross wires of the, , eyepiece. Note this reading [Fig. 2.4(6)] on the vertical scale of travelling microscope and record it as Rq, 5. Sprinkle a very small quantity of lycopodium powder on the glass slab and raise the microscope further upward till, the powder particles come into focus. Note this reading on the verticle scale again [Fig. 2.4(c)] and record it as Ra., , 6. Repeat steps 3 to 5 for more than two observations., 7. Difference of the readings R and R gives the real thickness of the slab whereas Rg, , R, gives the apparent, , thickness of the slab., 8. Record all the observations in the table., , OBSERVATIONS, 1. Least count of travelling microscope:, 50 Vernier Scale Divisions, , 49 Main Scale Divisions, , 1V.S.D.=, , M.S.D., 50, , Least count, , 1 M.S.D., , =, , -, , 1 .S.D., , =1 M.S.D.., , 4 M.S.D. = LM.S.D., 50, , 50, , Value of 1 M.S.D. = m m = 0.5 mm = 0.05 cm., , x 0 . 5 mm =0.01 mm =0.001 cm., , Least count, , 50, [Vernier scale and main scale may differ from instrument to instrument and least count may also differ.], , Tablefor R, R, and R3, S. Main Scale, No. Reading, a, , Vernier, , Division, , Coinciding, , (cm), , R, , an, , 3.5, , Vernier, , R =b+, , Main Scale, , Vernier, , Reading, , Division, , n x L.C., , Reading, , Division, , b, , Coinciding, (cm), , (cm), , LC., , (cm), 4, , 3, , 3, , T.4, , 3-68 17, , top of the slab, , Main Scale|, , (cm), , 46, , Powder sprinkled on the, , Cross-mark with slab, placed on it, , Cross-mark without slab, , 8, , 36, 3.4, , 33, .9, , O 5, , Rg =e +, n x LC., , Coinciding, (cm), , A 833, , 3.619, 3-705, , 3., , Saraswati Lab Manual Physics-XIl, , 77
Page 9 :
Mean R, , ., , em, Mean R, =.., , cm, Mean R, = .., , cm, , CALCULATIONS, Real thickness of the glass slab = R3-R, =., Apparent thickness of the glass slab = Rg-R, = ., , Refractive index,, , =, , Cm, CIm, , 3) 3, , 46, , Real thickness of slab R-R, Apparent thickness of slab R R z, Avg=, , RESULT, , (.51, , The refractive index of the material (glass) of the slab is ... by using travelling microscope., , TAKE CARE, 1. The, , microscope tube should be vertical, , 2. Microscope once focussed on the cross-mark, the focussing should not be disturbed throughout the experiment,, , Only rack and pinion serew should be used to raise the microscope upward., 3. Eyepiece should be adjusted so that cross-wires are distinctly seen., , 4. Only a thin layer of lyeopodium powder should be spread on the top of the slab., 5. As far as possible, the rack and pinion serew should be moved in one direction only to avoid backlash error., , 6., , Microscope should not be shaky., , SOURCES OF ERROR, 1. Microscope tube may not be vertical., 2. Microscope may be shaky.
Page 10 :
EXPERIMENT 8, AIM, , To draw I-V characteristic curve of a p-n junction diode in forward bias and reverse bias., , YOU NEED, variable, 2. A milliammeter of range 0-50 mA, 3. Amicroammeter of range 0-500 uA, 4. Two, wires., (0-3 V and 0-15 V), 5. Two voltmeters of ranges 0-3 V and 0-15 V, 6. Connecting, , 1. A semiconductor, power, , supplies, , diode,, , GIRCUIT DIAGRAM, , WA, , P, R, , wwww, , -wwww.-, , K, , Battery, , Fig., , 3.5, , (a), , Key, , Forward bias circuit, , Battery, , Fig., , 3.5, , Key, , (b) Reverse bias circuit, , of p-n junction diode, , of p-n junction diode, , THEORY, , terminal of the source of e.m.f., , (battery, Ap-n junction is said to be forward biased when p-region is, or cell and n-region is connected to-ve terminal as shown in Fig. 3.5 (a). The forward bias characteristics of p-n junction, connected, , to the, , +ve, , diodeshows that forward current increases with increase in forward bias voltage. But this increase is not proportional, Ap-njunction diode is said to be reverse biased when its p-region is connected to -ve terminal ofthe source of e.m.., , and n-region connected to the +ve terminal as shown in Fig. 3.5 (6). Reverse bias characteristics ofp-n junetion diode, shows that a very small current of the order of uA flows through the circuit due to the drift of minority charge carrier., , HOWTODo, (a) For forward bias characteristics, 1. Make a neat labelled circuit diagram as shown in Fig. 3.5 (a)., , 2. Make all the connections neat, clean and tight according to the circuit diagram [Fig. 3.5 (a)]., 3. Record the least count and zero error if any of milliammeter and voltmeter V, of range 0-3 V., , 86, , SaraswatiLab Manual Physics-XIl
Page 11 :
4., , Adjust the, , initial position of voltmeter V, at zero and then increase the forward bias voltage Vp in step or, ., Note, values of forward bias voltage Vp and corresponding forward current Ip. It, milliammeter reading will start increasing from zero, should be notea, value only when Vp crosses the limit of potent1al, Dai, Now plot a graph between Vp, the, , 5., , along X-axis and Ip along Y-axis., , (h) For reverse bias characteristics, &, , Make a, , neat labelled circuit, , diagram as shown in Fig. 3.5 (6)., Make all the connections neat, clean, and tight according to the circuit diagram in Fig. 3.5 (b)., 8. Record the least count and zero, error if any of, microammeter and voltmeter V2 of range l o, 9. Adjust the initial position of, voltmeter V, at zero and then increase the reverse bias voltage Vp in the step or, 2V. Note the values of, reverse bias voltage Vp and corresponding current, ip, 10. Plot a graph between reverse bias, voltage, -ve X-axis and reverse, Vp, along, current Ip along -ve I*aAi3 O, same graph paper on which, forward characteristic was plotted., 7., , Y., , 1, , br, , OBSERVATIONS, Least count of, V, (0-3 V), Least count of voltmeter, V, (0-15 V), Least count of milliammeter, Least count of microammeter, , voltmeter, , ..V, , =, , =, , .., , =, , ..., , ., , Zero error of voltmeter, V, Zero error of voltmeter V2 =, Zero error of milliammeter, Zero error of microammeter, =, , =, , =, , ..., , V, mA, LA, , V, V, , ..., , . ., , mA, , uA, , Table for Forward and Reverse Bias Characteristics, For forward biasing, , S.No., , Forward bias, , Forward current, , voltage V, V, 1., 2., 3., , 5., 6., , 7., B., , 9., 10., , (mA), , Be, , bOX, , For reverse biasing, , Reverse bias, , Reverse current, , voltage Vr, , pAmA), , 0.05, , 3, , X, , 22.5 X 10, , 0.25, 0. 35, , 24x 03, , 0.575, , x 10, , O.625, , Lu x 10-2, , 0.65, 0., 0. 725, , O. T5, , 2, , 15, 32, , 3, , S6x 10, , 86x1o, max, , CALCULATIONS, 1. Plot a graph between Vp and Ip taking Vy along X-axis and I, along Y-axis for the forward bias characteristics, , ofp-n junction diode, as shown in Fig., , 3.6., , 2. Plot the graph between Vp and Ip taking Vp along -ve X-axis and Ip along -ve Y-axis on the same graph paper on, which forward characteristic was plotted. This graph will give the reverse bias characteristics of given p-n junction, , diode, as shown in Fig. 3.6., , Saraswati Lab Manual Physics-XIl 87
Page 12 :
Scale used on:, , -X-axis, cm. V, , -Y-axis, 1 cm = ... pA, , Scale used on:, X-axis, 1 cm =...V, mA, Y-axis, 1 cm, . ., , Forward bias, characteristics, , VRV), Reverse blas, , X, , VE (V), , characteristics, , Fig., , 3.6 Forward and reverse bias characteristics of p-n, , junction, , diode, , RESULT, The forward bias and reverse bias characteristics of the given p-n junction diode are shown on the graph paper., , TAKE CARE, 1. All connections should be neat, clean and tight., 2. Voltmeters and ammeters of appropriate least count and ranges should be selected., 3. The voltage applied should not exceed the maximum allowed limit of the given diode., 4. Terminals of voltmeters and ammeter should be connected to the battery in the right manner
Page 13 :
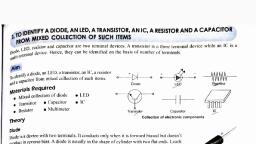
ACTIVITIES, ACTIVITY 1, AIM, , mo identify a diode, a LED, a transistor, an IC (integrated circuit), a resistor and a capacitor from a mixed collection Or, , such items., , YOU NEED, , LA mixed collection of LED 2. A diode 3. A transistor 4. An I.C. 5. Aresistor 6. A capacitor., THEORY, , Diode, LED, Resistor, Capacitor are two terminal devices, while a transistor has three terminals and an 1C 1s a, multiterminal device (which has minimum of eight terminals). Generally an IC has flat back., From the mixture of diode, LED, transistor, IC,, one can, the, , resistor, capacitor, , easily identify, , transistor being a, , three, terminal device and an IC being multiterminal, i.e., at least eight terminal device simply by looking at the various, components., , Remaining two terminal devices, i.e., diode, LED, capacitor and resistor one can utilize the characteristics of the, components., , Capacitor. It does not conduct when connected with d.c. circuit., Resistor. It gives the constant current when connected with d.c. circuit., Diode. It conducts when forward biased and it does not conduct when it is reverse biased. It does not emit light, , while conducting., ALED. It conducts when forward biased and does not conduct when reverse biased. It emits light while conducting., , HOWTO DO, 1. Look at the mixture of components, if the item has more than three terminals (or three legs) and has form of a, chip, it is an IC., , transistor, , 2. The, , component with three terminals (three legs) is a, 3. Use a multimeter with selector switch at the position R to check the continuity., The probe metal ends are inserted in terminals marked on the multimeter as common and P (+ve) in such a way, that black one is in common and red probe is in P (+ve). On touching the two ends of the device to the two other, , ends of the probes, if, (a) There is continuity in both the directions (directly connected and reversed), the meter needle shows a definite, deflection, the component is resistor, as it conducts both reverse and forward biasing., , (6) Ifthere is only one direction flow of current, i.e., when probes are connected in such a way so that the metal, tip of black probe is connected to the terminal of deflection device marked +ve and that of red probe to the, common terminal, current flows, but no current flows on reversing the polarity, then the component device, is a diode as it conducts in forward biased and it does not conduct in reverse biased., (c) Observe if the diode while conducting emits light, if it does not, it is simply a diode. If it emits ight while, conducting, it is LED (light emitting diode)., d) When the component on connecting to probes of multimeter shows a full scale deflection initially but it, decays to zero with the passage of time, i.e., component has very high or infinite resistance, the component, , is a capacitor., , OBSERVATIONS, No. of terminals legs), , Component, , ., , More than three legs, , IC (integrated circuit), , 2., , Three legs, , Transistor, , 8., , Two legs, , Resistor, Capacitor, Diode or LED, , S.No., , swati Lab Manual, , Physics-XI, , 101
Page 14 :
S.No., , Component, , Possibility of current flow, Current flows in, , one, , Current fows in, , one, , direction and emits, , no, , light, , direction and emits, , light, Current flows in both direction and it is steady, Initially high current but decays to zero, , Diode, LED, , Resistor, , Capacitor, , ACTIVITY 2, AIM, Use of multimeter to, (i) identify base of transistor, ( ) distinguish between n-p-n and p-n-p type transistors, (ii) see the unidirectional flow of current in case of a diode and a LED, iv) check whether a given electronic component (e.g., diode, transistor or I.C.) is in working order., , YOU NEED, 1. Given transistor 2. Diode 3. LED 4. Multimeter 5. I.C., THEORY, Multimeter is an instrument used for measuring current in amperes, voltage in volts and resistance in ohms. Therefore,, it is also known as an AvO meter. Ditferent ranges for measurement of different parameters can be selected by, , arrangement of a rotatory switch. Multimeter has two leads, black and red, each lead has a metallic end. On plugging, one end into the multimeter in the required range, second end is used for testing or measuring the required parameter., Also, it can be done by plugging the black lead in common terminal and red end in positive terminal of multimeter and, range is selected by rotatory switch., , HOW TO DO
Page 15 :
(C) To see the unidirectional flow of current in case of a diode and LED, 7. Repeat the steps 1 and 2 to set the, (a) For Diode, 8., , multimeter as, , an, , ohmmeter., , Connect thetwo leads of the multimeter to the two terminal of the junction diode and note whether the resistance, , Or Junction diode is low or high. Now interchange the two leads of multimeter to the two terminals of the di0de, , and again note whether the resistance of the, junction diode is low, , or, , high., , 9. t is observed that, if the resistance of the diode is high in the first case, it will be low in the second case and vice, , It gives the, (6) For LED, versa., , 10., , unidirectional, , flow of current in, , a, , diode., , LED is high, Now replace the junction diode to LED and proceed in step 8. It is observed that if the resistanceitsofresistance, is, vice, when, versa., Also, LED, will, glow by emitting light,, nlow.rst, case,it, low in second flow, case of, andcurrent in LED., It gives, theisunidirectional, as, , D) To check whether the given diode or transistor is in working orderr, (a) Forjunction diode, 11. Repeat the steps 1 and 2 to set the multimeter as an, ohmmeter., 12., , Now touch the two leads to thetwo, terminals of the diode and note vwhether the resistance of the diode is low high., of the multimeter and again note whether the resistance of the diode is low, high., ow interchange the two leads, 13., in, and low in other case, the diode is in working order. If the, of the diode, ifresistance, the resistance, is high, of the junction, diode is low in both the, diode is, or, , or, , one case, , cases,, , damaged one., , (b) For transistor, 14. Set the multimeter as an ohmmeter., 15. Find out the resistance of the transistor with the, help of multimeter between base and emitter and then between, base and collector. If the resistances of base emitter, junction and collector junction are low in one direction and, , high in other direction, then the given transistor is in working order., , 16. Ifit shows low resistance in both the, , directions,, , then the transistor is, , a, , damaged one., , FAKECARE, 1. Observations should be taken by setting the multimeter in ohm, range., 2. The transistor should be first checked for its base., 3. Before measuring the resistance, the zero ohm switch should be adjusted.
Page 16 :
ACTIVITY 7, AIM, To study the nature and size of the image formed by a concave mirror, on a sereen by using a candle and screen (., different distances of the candle from the mirror)., , YOUNEED, 1.Aconcave mirror with holder 2. An optical bench with three uprights 3. Meter scale 4. Candle 5. A cardboardscTe, 6. A matchbox., , From, , infinity, , (a) Object at infinity, , (b) Object beyond C, , (c) Object at C, , (d) Object between C and F, , C, , P, I m a g ea ti n f i n i t y, , (e) Object at F, , Fig., , 7, , Ray diagrams, , (f) Object between Fand P, for, , image formation, , for different, , positions, , of, , object, , THEORY, The position, nature and the relative size of the image of an object formed, by a concave mirror, the, position of the object with respect to the pole of the mirror. It is shown by the ray diagrams in Fig. 7.depends upon, , 108 Saraswati Lab Manual Physics-X
Page 17 :
HOWTODo, , 1., , Find rough, , focal, , length of the mirror., , Mount concave mirror in the holder in the first upright and place it at, 2 mirror, face inward., , the cardboard, , 3. Mount, screen, mirror from first upright., , on, , the second, , one, , optical bench. Keep the, , end of the, , upright and place it at a distance equal, , to, , rough focal length of the, , 4. Mount the burning candle on the third upright and place it near to the other end of the optical bench., the upright carrying candle laterally (i.e., perpendicular to the scale) such that theline joining the pole of, 5. Adjust, the mirror and tip of the candle flame is parallel to the length of the optical bench., 6. Find out the approximate position of centre of curvature C using the relation R = 2/. C lies at a distance R from, , the pole of mirror., , 7. Place the candle upright at a distance so that it lies beyond C (Fig. 76) and adjust the position of the screen and, heights of the uprights so that an inverted image of erect flame of burning candle is formed on the screen. Move, , the screen to make image sharp which is formed between F and C., , 8. Now displace the candle upright towards the pole of the mirror so that it lies between the focus F and centre of, curvature C of the mirror., , 9. Locate the position of image of the candle flame and adjust the position of screen and the height of the screen and, candle so that a sharp real inverted image of candle flame is obtained on the sereen. The real, inverted and, , magnified image would be formed beyond C., 10. Repeat the experiment for two more different positions of the candle flame and observe the position, nature and, size of the image. Record the observations in the table given below., OBSERVATIONS, Table for the position and nature, size of the image formed by concave mirror., Position of, , Object, , Image, , (Candle), , (Screen), , S.No., , Nature of Image, , At infinity, , At F, , Real, inverted, highly diminished, , 2., , Beyond C, , Between F and C, , Real, inverted, diminished, , 3., , At C, , At C, , Real, inverted, same size, , 4., , Between F and C, , Beyond C, , Real, inverted, magnified, , ., , At F, , At infinity, , Real, inverted, magnified but, , 6., , Between F and P, , Behind the, , Virtual (cannot be taken on screen),, , mirror, , erect, highly magnified., , 1, , blurred, , CONCLUSION, The, , change in position, nature and, , size of the, , image is according to the, , theoretical, , predictions., , Saraswati Lab Manual, , Physics-Xil 109
 Learn better on this topic