Notes of 12, IP Class XII IP student supporting material-Final.pdf - Study Material
Page 3 :
आर सेन्दिल कुमार, , उपायुक्त, , R. Senthil Kumar, , dsUnzh; fo|ky; laxBu], {ks=h; dk;kZy;] ,j.kkdqye, KENDRIYA VIDYALAYA SANGATHAN, REGIONAL OFFICE,, ERNAKULAM,, KOCHI – 682 020, Ph. No.0484- 2205111(DC), 2203091(Fax)), Website: www.roernakulam.kvs.gov.in, Email :
[email protected], , F.31/Acad/KVS(EKM), , Dated: 01.11.2021, Message, , I feel immense pleasure to publish the study material for class XII Informatics Practices, , (065)., , This support material is prepared incorporating all the recent changes in curriculum, , and assessment process made by CBSE. I am sure it will definitely be of great help to class XII, students of all Kendriya Vidyalayas., Getting acquainted with the latest changes will help students to prepare well for the, board examination and enable students to face case based and Multiple-Choice Questions with, confidence. This support material has been prepared by a team of dedicated and veteran, teachers with expertise in their respective subjects., The Support material contains all the important aspects required by the students- the, design of question paper, term wise split up syllabus, summary of all the chapters, important, formulas, Sample question papers, problem solving and Case study questions., I hope that this Support Material will be used by students and teachers as well and will, prove to be a good tool for quick revision., I would like to express my sincere gratitude to the In- charge principal and all the, teachers who have relentlessly worked for the preparation of this study material. Their, enormous contribution in making this project successful is praiseworthy., Meticulous planning blended with hard work, effective time management and sincerity, will help the students to reach the pinnacle of success., , Wish you all the best, ( R Senthil Kumar ), Sh. Jyothimohan N V, Principal, Kendriya Vidyalaya, SAP Peroorkada
Page 9 :
Class XII Informatics Practices, , Term –I Study Material, Contents, Page No, 1-38, , 1., , Data Handling using Series, , 2., , Data Handling using Data Frames, , 39-70, , 3., , Data Visualization, , 71-94, , 4., , Societal Impacts, , 95-103, , (Based on latest CBSE Exam Pattern for the Session 2021-22)
Page 10 :
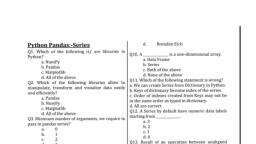
UNIT-1, Data Handling using Pandas –I, Python Pandas, , , , , , , , , Python library developed by Wes McKinney, Derived its name from “PANel DAta System”, Two basic data structures- Series and Dataframe, Series is one-dimensional, Dataframe is two-dimensional, installed using the command, pip install pandas, imported to a python program using the command, import pandas, or, import pandas as pd, (where pd is an alias name for pandas), , Comparison between Series and Dataframes, Series, , Dataframe, , One-dimensional, , Two-dimensional, , Homogenous data i.e. all elements, are of same type, , Heterogeneous data i.e. elements of, different datatypes, , Value mutable i.e. element’s value, can be changed, , Value mutable i.e. element’s value can, be changed, , Size immutable i.e. once created, size, of series cannot be changed, , Size mutable i.e. size can be changed, after creation, , Series Datastructure, , , Creating empty Series, <series object>=pandas.Series(), eg: s1=pandas.Series(), , 1
Page 11 :
, , Creating Series from a List/Tuple, <series object>=pandas.Series(<list/tuple>,index=<python sequence>), Note: index argument is optional. If not given, index is taken as 0,1,2,3,--- by, default, eg:, import pandas as pd, s1=pd.Series([12,10,14,16]), s2=pd.Series([12,10,14,16],index=[‘a’,’b’,’c’,’d’]), print(“Series object with default index”), print(s1), print(“Series object with specified index”), print(s2), , Output:, Series object with default index, 0, 12, 1, 10, 2, 14, 3, 16, Series object with specified index, a, 12, b, 10, c, 14, d, 16, , , , Creating Series from an ndarray, <series object>=pandas.Series(<ndarray>, index=<python sequence>), Note: index argument is optional. If not given, index is taken as 0,1,2,3,--- by, default, eg:, import pandas as pd, import numpy as np, ar1=np.arange(10,20,3), ar2=np.array([20,25,30]), 2
Page 12 :
s1=pd.Series(ar1), s2=pd.Series(ar2,index=('Mark1','Mark2','Mark3')), print('Series object from ndarray with default index'), print(s1), print('Series object from ndarray with specified index'), print(s2), , Output:, Series object from ndarray with default index, 0 10, 1 13, 2 16, 3 19, Series object from ndarray with specified index, Mark1 20, Mark2 25, Mark3 30, , , , Creating series from a Python dictionary, <series object>=pandas.Series(<dictionary>,index=<Python sequence>), Note: index argument is optional. If not given, keys of the dictionary becomes, the index values, eg:, import pandas as pd, dict1={"Name":"Rajeev","Age":17,"Class":"XII"}, s1=pd.Series(dict1), print('Series object from dictionary with keys as index'), print(s1), Output:, Series object from dictionary with keys as index, Name Rajeev, Age, 17, Class, XII, , 3
Page 13 :
, , Creating Series from a scalar value, <series object>=pandas.Series(<scalar value>,index=<Python sequence>), Note: While creating a Series from a scalar value, Index argument is, mandatory, eg:, import pandas as pd, s1=pd.Series(15,index=['Mark1','Mark2','Mark3']), print('Series object from scalar value'), print(s1), Output:, Series object from scalar value, Mark1 15, Mark2 15, Mark3 15, MCQ questions, Section A, 1, , Which of the following command is used to install python pandas?, a), b), c), d), , 2, , Ans: d, Pandas Series is a -----------------------------array, a), b), c), d), , 3, , install pandas, pandas install python, python install pandas, pip install pandas, , one dimensional, two dimensional, three dimensional, None of the above, , Ans: a, Which of the following is the purpose of Python Pandas?, a) To create a GUI programming, b) To create a database, 4
Page 14 :
c) To create a High level array, d) All the above, 4, , Ans: c, Identify the correct statement, a), b), c), d), , 5, , 6, , Ans: c, Minimum number of arguments required to pass in pandas Series, function for creating a non-empty series----------------a) 0, b) 1, c) 2, d) 3, Ans: b, Pandas is a/an -------------------python library, a), b), c), d), , 7, , Series values are mutable, Series data is homogenous, Series is a 1-D array, Series is size mutable, , Ans: d, The label associated with a particular data value in Series is, called…………, a), b), c), d), , 9, , proprietary, open source, shareware, None of the above, , Ans: b, Which of the following is not a feature of pandas series?, a), b), c), d), , 8, , Standard marker for missing data in Pandas is NaN, Series act in a way similar to that of an array, Both of the above, None of the above, , Item, Index, Column, Values, , Ans: b, Tabular data can be processed using-------------------, , 5
Page 15 :
a), b), c), d), , Numpy, Pandas, Matplotlib, All of these, , Ans: b, 10 Which of the following datatype can be given as data in a pandas Series, function?, a), b), c), d), , a python dictionary, an ndarray, a scalar value, All the above, , Ans: d, 11 Pandas series is a combination of________, a), b), c), d), , Records arranged in row and column, Collection of one dimensional data and associated index, Collection of tabular data in two-dimension, None of the above, , Ans: b, 12 Which of the following is correct statement for creating empty series?, (Assume that pandas library is already imported as pd), a), b), c), d), , ser = pd.Series(NaN), ser = pd.Series, ser = pd.Series(), None of the above, , Ans: c, 13 Which of the following condition raise a ValueError while creating a, series?, a), b), c), d), , Data values are provides without indexes, Scalar value is given as data, Number of data values are not same as number of indexes, All of the above, , Ans: c, 14 How many values will be there in array1, if given code is not returning any, error?, >>> series4 = pd.Series(array1, index = [“Jan”, “Feb”, “Mar”, “Apr”]), a) 1, b) 2, 6
Page 16 :
c) 3, d) 4, Ans: d, 15 When we create a series from dictionary then the keys of dictionary, become ________________, a), b), c), d), , Index of the series, Value of the series, Caption of the series, None of the series, , Ans: a, Section B, 1, , For creating the below series, S1, which of the following command(s) can, be used?, Series(S1), 0 10, 1 12, 2 14, a), b), c), d), , S1=pandas.Series([10,12,14]), S1=pandas.Series([10,12,14],index=[0,1,2]), S1=pandas.Series(index=[0,1,2],data=[10,12,14]), All of the above, , Ans: d, 2, , Write the output of the following :, >>> S1=pandas.Series(“Hello”, index = ['One', 'Two', 'Three']), >>> print(S1), a), One Hello, Two Hello, Three Hello, b), One, , Hello, , c) Error, d) None of the above, , 7
Page 17 :
Ans: a, 3, , Choose correct option :, import pandas as p1 #line1, Lst = [11,12,13,14] #line2, s1=p1.Series(Lst , index = ('a’,’b’,’c')) #line3, print(s1), #line4, Which line of above code will generate error?, a), b), c), d), , line1, line2, line3, line4, , Ans: line3, 4, , Which of the following code will generate the following output?, January 31, February 28, March, 31, a) import pandas as pd, S1 = pd.Series(data = [31,28,31],, index=["January","February","March"]), print(S1), b) import pandas as pd, S1 = pd.Series([31,28,31], index=["January","February","March"]), print(S1), c) Both of the above, d) None of the above, , 5, , Ans: c, Read the statements given below and identify the right option, Statement 1: Series is a one-dimensional labeled array capable of, holding any data type, Statement 2: If data is an ndarray, index must be the same length as, data., , a), b), c), d), , Statement 1 is correct, statement 2 is wrong, Statement 1 is wrong, Statement 2 is correct, Both statement 1 and statement 2 are correct, Both statements are incorrect, , 8
Page 18 :
6, , Ans: c, Read the statements given below and identify the right option, Assertion (A): You need to install the pandas library using the pip install, command., Reason (R): You can also access pandas without installation., a), b), c), d), , 7, , Both A and R are true and R is the correct explanation of A, Both A and R are true but R is not the correct explanation of A, A is true but R is false, A is false but R is true, , Ans: c, Read the statements given below and identify the right option, Assertion (A): We cannot modify the values of Series elements once, created., Reason (R): Series is an immutable object., a), b), c), d), , 8, , Both A and R are true and R is the correct explanation of A., Both A and R are true and R is not the correct explanation of A., A is true but R is false., Both A and R are false, , Ans: d, Ananya wants to store her Term-I mark in a Series which is already stored, in a NumPy array. Choose the statement which will create the series with, Subjects as indexes and Marks as elements., import pandas as pd, import numpy as np, Marks =np.array([30,32,34,28,30]), subjects = ['English','Maths','Chemistry','Physics','IP'], Series1= _______________________________, a), b), c), d), , pd.Series(Marks,index=subjects), pd.Series(np.Marks,index=subjects), pd.Series(index=Marks, subjects), pd.Series(Marks,index), , Ans: a, 9, , Write the output of the following:, import pandas as pd, S1 = pd.Series(data = range(31, 2, -6), index = [x for x in "aeiou"]), print(S1), a) a 31, , 9
Page 19 :
e 25, i 19, o 13, u7, dtype: int64, b) a 31, e 25, i 19, o 13, dtype: int64, c) Error, d) None of the above, Ans: a, 10 Tushar is a new learner for the python pandas series. He learned some of, the concepts of python in class 11 with NumPy module. He wants to, create a series with the following code. The index should be from 20 to 30, and data value is obtained by multiplying each index value by 7. Help him, to create series by following code:, import pandas as pd, import numpy as np, s=np.arange(20,30), Choose the correct code to fill in the blank above:, a), b), c), d), , sm7= pd.Series(s, index=s*7), sm7=pd.Series(s*7,index=s), sm7=pd.Series([s*7],index=s), All of the above, , Ans: b, Section C, 1, , Ms. Priya is a python developer and she created a series using the, following code, but she missed some of the lines given as blank. Fill the, blanks and help her to complete the code:, import pandas as ________ #statement 1, import ________ as np, #statement2, s1=pd.Series([3,4,_____,44,67]) #statement 3, print(________) #statement 4, Output:, , 10
Page 20 :
03, 14, 2 NaN, 3 44, 4 67, i), , Identify the missing code in statement 1, a), b), c), d), , ii), , iii), , p, pd, pandas, pdy, , Ans: b, Name the library to be imported in statement2 for the code to execute, correctly, a), numpy, b), pandas, c), matplotlib, d), pyplot, Ans: a, Complete statement 3 to obtain the output shown in the code, a), b), c), d), , NaN, np.NaN, np.None, none of the above, , Ans: b, iv) Fill the missing code to display the Series, a), np, b), pd, c), s1, d), Series, Ans: c, , Mathematical Operations on Series, a) Vector operations on Series objects, , 11
Page 21 :
Any operation on Series object will be applied to each item of the Series. This is, known as Vector Operation, eg: Consider the Series S1, 0, 1, 2, 3, , 5, 10, 11, 25, , All the following examples are based on the Series S1, Operation, , Output, , >>> S1+3, , 0, 1, 2, 3, , 8, 13, 14, 28, , >>> S1*2, , 0, 1, 2, 3, , 10, 20, 22, 50, , >>> S1/2, , 0, 1, 2, 3, , 2.5, 5.0, 5.5, 12.5, , >>> S1%2, , 0, 1, 2, 3, , 1, 0, 1, 1, , b) Arithmetic on Series Objects, All arithmetic operations like addition, subtraction, multiplication, division etc. can, be done on Series objects, The arithmetic operation is performed only on matching indexes. If the, indexes are not matching, NaN will be produced as output., Eg;, , 12
Page 23 :
Division, , /, , or, , div, , >>> s1/s2 or >>>s1.div(s2), Output, A 1.5, B 2.0, C NaN, D NaN, , Modulus, , %, , or, , mod, , >>> s1 % s2 or >>> s1.mod(s2), Output, A 5.0, B 0.0, C NaN, D NaN, , MCQ, Section A, 1, , 2, , 3, , 4, , The result of an operation between unaligned Series will have the -----------of the indexes involved, a) intersection, b) union, c) total, d) all of the above, Ans: b, We can perform _____________ on two series in Pandas, a) Addition, b) Subtraction, c) Multiplication, d) All of the above, Ans: d, Which of the following method is used to add two series?, a) sum( ), b) addition( ), c) add( ), d) None of the above, Ans: c, Which of the following statement will display the difference of two Series, ‘A’ and ‘B’?, a) A – B, b) A.sub(B), c) Both a and b, d) None of the above, , 14
Page 24 :
Ans: c, 5, , Which of the following are valid operations on Series ‘S1’?, a) S1 + 2, b) S1 ** 2, c) S1 * 2, All of the above, Ans: d, , 6, , Which of the following function is used for basic mathematical operations, in Series?, a) add( ), b) mul( ), c) div( ), d) All of the above, Ans: d, Section B, , 1, , Consider the following two series objects S1 , S2, Series - S1, 0 10, 1 18, Series - S2, a5, b6, What will be the output of S1+S2, a) 0 NaN, 1 NaN, a NaN, b NaN, b) 0 10, 1 18, a5, b6, c) 0 15, 1 24, d) a 15, b 24, , 2, , Ans: a, Choose the correct option:, Assertion (A): We can add two series objects using addition operator (+), or calling explicit function add() ., 15
Page 25 :
Reason (R): While adding two series objects index matching is, implemented and missing values are filled with NaN by default., a), b), c), d), 3, , Both A and R are true and R is the correct explanation of A., Both A and R are true and R is not the correct explanation of A., A is true but R is false., A is false but R is true., , Ans: a, Assume there is a series S1 having data elements as 11, 12, and 13, respectively. Programmer ‘Ravi’ wrote print(s1*2) in his python program., Statement 1: A series will data elements as 22, 24, 26 will get printed., Statement 2: Series supports vectorized operation., a) Only Statement 1 is true., b) Only Statement 2 is true., c) Both Statement 1 and 2 are true, Statement 2 is not correct, reasoning of Statement 1., d) Both Statement 1 and 2 are true, Statement 2 is correct reasoning, of Statement 1., Ans: d, , 4, , Identify the correct option, Assertion (A): We can perform mathematical operations on two series, objects of different size but not on two 1 D arrays of different size., Reason (R) : if two series are not aligned NaN are generated but in case, of arrays no concept of NaN and hence operations fail to perform., a), b), c), d), , Both A and R are true and R is the correct explanation of A., Both A and R are true and R is not the correct explanation of A., A is true but R is false., A is false but R is true., , Ans: a, 5, , Assuming the given series, named Salary, which command will be used, to increase 2000 in every employee’s salary?, Om 35000, Vinay 35000, , 16
Page 26 :
Simi 50000, Nitin 54000, Nandi 60000, dtype: int64, a), b), c), d), 6, , Salary*2000, Salary.add(2000), Salary+2000, Salary.count(), , Ans: c, Write the output of the given program:, import pandas as pd, S1=pd.Series([3,6,9,12],index=['a','b','c','e']), S2=pd.Series([2,4,6,8],index=['c','d','b','f']), print(S1*S2), a) a 6.0, b 24.0, c 54.0, d 96.0, e NaN, f NaN, dtype: float64, b) a NaN, b 36.0, c 18.0, d NaN, e NaN, f NaN, dtype: float64, c) a 6.0, b 36.0, c 18.0, d 24.0, e NaN, f NaN, dtype: float64, d) Error, , 7, , Ans: b, Predict the output of the following code:, import pandas as pd, stationary=['pencils','notebooks','scales','erasers'], , 17
Page 27 :
S1=pd.Series([20,33,52,10],index=stationary), S2=pd.Series([17,13,31,32],index=stationary), S1=S1+S2, print(S1+S2), a) pencils, 37, notebooks 46, scales, 83, erasers, 42, dtype: int64, b) pencils, 54, notebooks 59, scales, 114, erasers, 74, dtype: int64, c) pencils, 20, notebooks 33, scales, 52, erasers, 10, dtype: int64, d) Error, Ans: b, 8, , Write the output of the following:, import pandas as pd, S1 = pd.Series(data = (31, 2, -6)), print(S1*2), a) 0 31, 12, 2 -6, 3 31, 42, dtype: int64, b) 0 31, 12, 2 -6, dtype: int64, c) 0 62, 1 4, 2 -12, dtype: int64, , 18
Page 28 :
9, , d) Error, Ans: c, Write the output of the following :, import pandas as pd, S1=pd.Series([1,2,3,4]), S2=pd.Series([7,8,9,10]), S2.index=['a','b','c','d'], print((S1+S2).count()), a), b), c), d), , 10, , 8, 4, 0, 6, , Ans: c, What will be the output of the following code?, import pandas as pd, s1=pd.Series([4,5,7,8,9],index=['a','b','c','d','e']), s2=pd.Series([1,3,6,4,2],index=['a','p','c','d','e']), print(s1-s2), a) a 3.0, b0, c 1.0, d 4.0, e 7.0, p0, dtype: float64, b) a 3.0, b NaN, c 1.0, d 4.0, e 7.0, p NaN, dtype: float64, c) a 3.0, c 1.0, d 4.0, e 7.0, dtype: float64, d) a 3.0, b–, c 1.0, d 4.0, e 7.0, 19
Page 30 :
football 5, swimming 3, chess, 6, football 5, b), , chess, True, football True, kho kho, False, skating, False, swimming True, , c) chess, 10.0, football 10.0, kho kho, NaN, skating, NaN, swimming 13.0, d) Error, iv), , Ans: c, Which method is to be used in statement4 to produce the following, output?, chess, 24.0, football 25.0, kho kho, NaN, skating, NaN, swimming 30.0, a), b), c), d), , add, sub, div, mul, , Ans: d, , TOPIC-Attributes of Pandas Series, EXAMPLES ARE BASED ON THE GIVEN SERIES., >>> seriesCapCntry, India, NewDelhi, USA, WashingtonDC, UK, London, France Paris, dtype: object, , 21
Page 31 :
Attribute, Name, name, , Purpose, , Syntax, , assigns a, name to, the Series, , <Seriesname>.name, =<”name”>, , assigns a, name to, the index, of the, series, , values, , prints a list, of the, values in, the series, prints the, <Seriesname>.size, number of, values in, the Series, object, prints True <Seriesname>.empty, if the, series is, empty, and, False, otherwise, prints the, <Seriesname>.ndim, dimension, of the, Series, object, , empty, , ndim, , shape, , shape, property, returns a, tuple, (n,), containing, a single, element, , seriesCapCntry.name = ‘Capitals’, , >>> print(seriesCapCntry), India NewDelhi, USA WashingtonDC, UK, London, France Paris, Name: Capitals, dtype: object, <Seriesname>.index., >>>seriesCapCntry.index.name =, name=<”name”>, ‘Countries’, >>> print(seriesCapCntry), Countries, India, NewDelhi, USA, WashingtonDC, UK, London, France Paris, Name: Capitals, dtype: object, <Seriesname>.values >>> print(seriesCapCntry.values), [‘NewDelhi’ ‘WashingtonDC’, ‘London’,‘Paris’], , index.name, , size, , Example, , <Seriesname>.shape, , >>> print(seriesCapCntry.size), 4, , >>> seriesCapCntry.empty, False, # Create an empty series, seriesEmpt=pd.Series(), >>> seriesEmpt.empty, True, d1={'a':9, 'b':1, 'c':7, 'd':2}, s1=pd.Series(d1), print(s1.ndim), o/p:, 1, d1={'a':9, 'b':1, 'c':7, 'd':2}, s1=pd.Series(d1), print(s1.shape), o/p:, (4,), , 22
Page 32 :
which is, the, number of, elements, in the, Series, object., MCQ TYPE QUESTIONS, 1, , 2, , 3, , 4, , SECTION A, Which of the following is not an attribute of pandas Series?, a.name, b.size, c.shape, d.Series.T, Ans.d, …………………..attribute will display the total number of elements in a given Series., a.shape, b.size, c.values, d.ndim, Ans c, Which of the following attribute is used to assigns a name to the index of the Series., a.name, b.index, c.index.name, d.All of the above, Ans c, ……………………………property returns a tuple (n,) containing a single element which, is the number of elements in the Series object., a.size, b.shape, c.values, d.dim, Ans shape, , 5, , Choose the correct syntax to get the dimension of series named SR:, a.SR.dimension, b.SR.ndim, c.SR.dim, d.SR.ndimension, Ans b, SECTION B, , 23
Page 33 :
1, , Assuming the given series, named stud, which command will be used to print 5 as, output?, Amit, 90, Ramesh 100, Mahesh 50, John, 67, Abdul, 89, Name: Student, dtype: int64, a. stud.index, b. stud.length, c. stud.values, d. stud.size, , 2, , Ans d, What will be the output f the following code given:, import pandas as pd, seriesEmpt=pd.Series(), >>> seriesEmpt.empty, a.Error, b.0, c.True, d.False, , 3, , Ans c, Assuming the given series,named ‘capital’,which command will be used to print the, following output?, [‘NewDelhi’ ‘WashingtonDC’ ‘London’,‘Paris’], India, USA, UK, France, , NewDelhi, WashingtonDC, London, Paris, , a.capital.index, b.capital.elements, c.capital.values, d.capital.size, 4, , Ans c, Choose the correct name of Series from the given python code., import pandas as pd, dict1 = {'India': 'NewDelhi', 'UK':'London', 'Japan': 'Tokyo'}, series8 = pd.Series(dict1), print(series8) #Display the series, series8.name=’capital’, a.dict1, 24
Page 34 :
b.series8, c.capital, d.name, Ans.c, 5, , Write the correct python statement to assign name to the index of the given series to, ‘State’., import pandas as pd, dict1 = {'India': 'NewDelhi', 'UK':'London', 'Japan': 'Tokyo'}, series8 = pd.Series(dict1), print(series8), series8. _______________ =’state’, a.series8.index, b.series8.index.name, c.series8.name.index, d All of the above., Ans.b, ASSERTION AND REASONING TYPE, , 6, , Choose correct option :, import pandas as p1, import numpy as np, a1=np.arange(2,11,2), s1=p1.Series(a1,index=list(‘ABCDE’)), print(s1.ndim), Statement 1: Above code will give output as 1., Statement 2: Series is a one dimensional data structure., a) Only Statement 1 is True, b) Only Statement 2 is True, c) Both Statement 1 and 2 are true, but Statement 2 is not correct reasoning of, Statement 1., d) Both Statement 1 and 2 are true, but Statement 2 is correct reasoning of Statement, 1., Ans:d, , 25
Page 35 :
SECTION C, 1 Nidhi has created Series S1 as following , help her to perform following tasks and write, the code to help her to, S1, India, NewDelhi, USA, WashingtonDC, UK, London, France Paris, dtype: object, a Display the number of values in the series s1, i.print(S1.shape), ii.print(S1.size), iii.print(S1.values), iv.print(S1.number), b. Returns True/Flase if the Series S1 is empty, i.print(S1.empty()), ii.print(S1.empty), iii.print(S1.null), iv.print(S1.nan), c Displays the list of values in the series S1, i.print(S1.values), ii.print(S1.value), iii.print(S1.values()), iv.All of the above, d Display the ouput as (1,), i.print(S1.ndim), ii.print(S1.shape), iii.print(S1.size), iv.print(S1.ndim()), e The command which will change the name of Series S1 to States., i.S1.name=’state’, ii.name.S1=’state’, iii.S1.name(state), iv.Al of the above., TOPIC:Methods of Series, Head and Tail functions, LET US CONSIDER THE FOLLOWING EXAMPLE., >>> seriesTenTwenty=pd.Series(np.arange( 10, 20, 1 )), >>> print(seriesTenTwenty), 0 10, 1 11, 2 12, 3 13, 4 14, 5 15, 6 16, , 26
Page 36 :
7 17, 8 18, 9 19, dtype: int32, Method, Explanation, head(n) Returns the first n members of the series. If, the value for n is not passed, then by default, n takes 5 and the first five members are, displayed., , count(), tail(n), , 1, , 2, , Returns the number of non-NaN values in, the Series, Returns the last n members of the series. If, the value for n is not passed, then by default, n takes 5 and the last five members are, displayed., , Example, >>> seriesTenTwenty.head(2), 0 10, 1 11, dtype: int32, >>> seriesTenTwenty.head(), 0 10, 1 11, 2 12, 3 13, 4 14, dtype: int32, >>> seriesTenTwenty.count(), 10, >>> seriesTenTwenty.tail(2), 8 18, 9 19, dtype: int32, >>> seriesTenTwenty.tail(), 5 15, 6 16, 7 17, 8 18, 9 19, dtype: int32, , MCQ TYPE QUESTIONS, SECTION A, Which of the following statement shows first five values of Series ‘S1’?, a. S1.head( ), b. S1.head( 5 ), c. Both of the above, d. None of the above, Ans c, Which of the following returns number of non-NaN values of Series?, a. count, b. size, c. index, d. values, , 27
Page 37 :
3, , 4, , 5, , Ans a, Which of following statement will return 10 values from the end of the Series ‘S1’?, a. S1.tail( ), b. S1.tail(10), c. S1.head(10), d. S1(10), Ans b, Function to display the first n rows in the Series:, a. tail (n), b. head (n), c. top (n), d. first (n), Ans b, To get bottom three rows of a Series, you may use _________ function: 1, a. tail(), b. bottom(3), c. bottom(3), d. tail(3), Ans d, SECTION B, , 1, , 2, , 3, , Write the output of the following:, import pandas as pd, S1=pd.Series([1,2,3,4]), S2=pd.Series([7,8]), print((S1+S2).count()), a. 6, b. 4, c. 2, d. 0, Ans b, Which of the following returns number of non-NaN values of Series?, a. count, b. size, c. index, d. values, Ans a, Write the output of the following:, import pandas as pd, S1=pd.Series([1,2,3,4]), S2=pd.Series([7,8]), S3=S1+S2, print(S3.head(3)), a 0 8.0, 1 10.0, 28
Page 38 :
4, , 2, , NaN, , b. 0, 1, 2, , 1.0, 2.0, NaN, , c. 0, 1, 2, , 7.0, 8.0, NaN, , d 0, 1, 2, , 1.0, 7.0, NaN, , Ans a, Write the output of the following:, import pandas as pd, S1=pd.Series([1,2,3,4]), S2=pd.Series([7,8]), print((S1+S2).tail(2)), a 2 NaN, 3 NaN, b 0 8.0, 1 10.0, c, , 2 3, 3 4, , d, , 0 7, 1 8, , Ans a, Indexing/Slicing a Series objectThe index [] operator can be used to perform indexing and slicing operations on a, Series object. The index[] operator can accept eithera) Index/labels, b) Integer index positions, a) Using the index operator with labels-, , The index operator can be used in the following waysi) Using a single label inside the square brackets- Using a single, label/index inside the square brackets will return only the corresponding, element referred to by that label/index., , 29
Page 39 :
# indexing a Series object single label import, pandas as pd, d={'a':101, 'b':102, 'c':103, 'd':104, 'e':105, 'f':106}, s=pd.Series(d), t=s['b'], print(t), o/p: 102, ii) Using multiple labels- We can pass multiple labels in any order that is, present in the Series object. The multiple labels must be passed as a list i.e., the multiple labels must be separated by commas and enclosed in double, square brackets. Passing a label is passed that is not present in the Series, object, should be avoided as it right now gives NaN as the value but in future, will be considered as an error by Python., # indexing a Series object, multiple labels import, pandas as pd, d={'a':101, 'b':102, 'c':103, 'd':104, 'e':105, 'f':106}, s=pd.Series, (d) u=s[['b',, 'a', 'f']], print(u), o/p:, b, 102, a, 101, f, 106, dtype: int64, iii) Using slice notation startlabel:endlabel- Inside the index operator we, can pass startlabel:endlabel. Here contrary to the slice concept all the items, from startlabel values till the endlabel values including the endlabel values is, returned back., # indexing a Series object using, startlabel:endlabel import pandas as, pd, d={'a':101, 'b':102, 'c':103, 'd':104, 'e':105, 'f':106}, s=pd.Series(d), u=s['b':'e’], print(u), , 30
Page 40 :
Output, b 102, c 103, d 104, e 105, dtype: int64, b) Slicing a Series object using Integer Index positions-, , The concept of slicing a Series object is similar to that of slicing python lists, strings, etc. Even though the data type of the labels can be anything each element of the, Series object is associated with two integer numbers:, In forward indexing method the elements are numbered from 0,1,2,3, …, with 0 being assigned to the first element, 1 being assigned to the second, element and so on., In backward indexing method the elements are numbered from -1,-2, -3,, … with -1 being assigned to the last element, -2 being assigned to the, second last element and so on., For example consider the following Series objectd={'a':101, 'b':102, 'c':103, 'd':104, 'e':105, 'f':106}, s=pd.Series(d), The Series object is having the following integer index positionsforward, indexing--->, , 0, , 1, , 2, , 3, , 4, , 5, , a, , b, , c, , d, , e, , f, , 101, , 111, , 121, , 131, , 141, , 151, , -6, , -5, , -4, , -3, , -2, , -1, , < ---- backward, indexing, , Slice conceptThe basic concept of slicing using integer index positions are common to Python, object such as strings, list, tuples, Series, Dataframe etc. Slice creates a new object, using elements of an existing object. It is created as: ExistingObjectName[start : stop, : step] where start, stop , step are integers, # Slicing a Series object import pandas as pd, d={'a':101, 'b':111, 'c':121, 'd':131, 'e':141, 'f':151}, s=pd.Series(d), x=s[1: :2], print('x=\n', x), y=s[-1: :-1], 31
Page 41 :
print('y=\n', y), z=s[1: -2: 2], print('z=\n', z), o/p:, x=, b 111 d 131 f 151, dtype: int64, y=, f 151 e 141 d 131 c 121 b 111 a 101, dtype: int64, z=, b 111 d 131, Modifying elements of Series objectThe elements of a Series object can be modified using any of the following methodsa. Using index [] operator to modify single/multiple values, __________________________________________________________________, # Modifying a Series object index [] method import pandas as pd, d={'a':101, 'b':111, 'c':121, 'd':131, 'e':141, 'f':151}, s=pd.Series(d), s['c'] = 555, s[['f','a']] = [666,777], print('s=\n', s), s['b':'d']=[0,1,2], print('s=\n', s), Output, s=, a 777, b 111, c 555, d 131, e 141, f 666, dtype: int64, s=, a 777, b, 0, c, 1, d, 2, e 141, f 666, dtype: int64, b. sing at/iat property to modify a single value, # Modifying a Series object at iat property import pandas as pd, d={'a':101, 'b':111, 'c':121, 'd':131, 'e':141, 'f':151}, 32
Page 42 :
s=pd.Series(d), s.at['d'] = 999, s.iat[-1] = 777, print('s=\n', s), Output, s=, a 101, b 111, c 121, d 999, e 141, f 777, dtype: int64, c. Using loc, iloc property to modify single /multiple values, #Modifying a Series object loc iloc property import pandas as pd, d={'a':101, 'b':111, 'c':121, 'd':131, 'e':141, 'f':151}, s=pd.Series(d), s.loc['b'] = 9, s.loc['e':'f'] = [8,7], print('s=\n', s), s.iloc[1: :2] = [33,44,55], print('s=\n', s), Output, s=, a 101, b, 9, c 121, d 131, e, 8, f, 7, dtype: int64, s=, a 101, b 33, c 121, d 44, e, 8, f 55, dtype: int64, c. Using slice method to modify multiple values, , 33
Page 43 :
# Modifying a Series object slice method, import pandas as pd, d={'a':101, 'b':111, 'c':121, 'd':131, 'e':141, 'f':151}, s=pd.Series(d), s[1: :2] = [1,2,3], print('s=\n', s), Output, s=, a 101, b, 1, c 121, d, 2, e 141, f, 3, dtype: int64, Changing indexes of Series objectThe index property can be used to change the indexes of a Series object, import pandas as pd, # Changing indexes of Series object import pandas as pd, d={'a':101, 'b':111, 'c':121, 'd':131}, s=pd.Series(d), s.index = ['have','a','nice', 'day'], print('s=\n', s), Output, s=, have 101, a, 111, nice 121, day 131, dtype: int64, , MCQ, 1, , What will be the output of the given code?, import pandas as pd, s = pd.Series([1,2,3,4,5],, index=['akram','brijesh','charu','deepika','era']), print(s['charu']), a. 1, b. 2, 34
Page 44 :
2, , c. 3, d. 4, Ans C, Consider the following series named animal:, L, Lion, B, Bear, E, Elephant, T, Tiger, W, Wolf, dtype: object, Write the output of the command:, print(animal[::-3]), a L Lion, T Tiger, dtype: object, b. B, Bear, E Elephant, dtype: object, c. W Wolf, B Bear, dtype: object, d. W Wolf, T Tiger, dtype: object, , 3, , Ans C, Write the output for the following Python code., import pandas as pd, s=pd.Series([1,2,3,4,5,6],index=['A','B','C','D','E','F']), print(s[s%2==0]), a. B 2, D 4, F 6, b. A 1, C 3, E 5, c. B 2, D 4, F 5, d. B 3, D 4, F 6, Ans a, 35
Page 45 :
4, , Write the output of the following code ?, import pandas as pd, seriesMnths=pd.Series([2,3,4],index=['Feb','Mar','Apr']), print(seriesMnths[1]), a., b., c., d., , 5, , 2, Mar, Feb, 3, , Ans d, Choose the correct output of the following code?, import pandas as pd, seriesCapCntry=pd.Series(['New Delhi','WashingtonDC','London','Paris'],index=, ['India','USA','UK','France']), print(seriesCapCntry[[3,2]]), a. France, Paris, France, Paris, b. USA, WashingtonDC, France, Paris, c. France Paris, UK, London, d. USA, WashingtonDC, UK, London, Ans c, , 6, , 7, , 8, , Assertion (A) : We cannot access more than one element of Series without slicing ., Reason (R) :More than one element of series can be accessed using a list of positional, index or labeled index., (A) Both A and R are true and R is the correct explanation of A., (B) Both A and R are true and R is not the correct explanation of A., (C) A is true but R is false., (D) A is false but R is true., (E) Both A and R are false., Ans D, Assertion (A) : Elements of Series can be accessed using positional index., Reason (R) : positional index values ranges from 1 to n if n is the size of the series., (A) Both A and R are true and R is the correct explanation of A., (B) Both A and R are true and R is not the correct explanation of A., (C) A is true but R is false., (D) A is false but R is true., (E) Both A and R are false, Ans A, Answer the following based on the series given below., , 36
Page 46 :
import pandas as pd, list1=[1,2,3,4,5,6,7,8], list2=['swimming','tt','skating','kho kho','bb','chess','football','cricket'], school=pd.Series(list1,index=list2), school.name=("little"), print(school*2), # statement 1, print(school.tail(3)) # statement 2, print(school['tt']), # statement 3, print(school[2:4]), i, , ii, , iii, , 9, , Choose the correct name of the Series, a) list1, b) list2, c) school, d) little, Ans: c, Choose the correct output of the statement, print(school.tail(3)) # statement 2, a. swimming 1, tt, 2, skating 3, b. chess, 6, football 7, cricket 8, c. 4, d. kho kho 4, bb, 5, chess, 6, football 7, cricket 8, Ans b, Choose the correct output of the statement, print(school['tt']), # statement 3, a. 2, b. 3, c. tt 2, d. true, Ans c, Write the output of the following:, import pandas as pd, S1 = pd.Series(['NewDelhi', 'WashingtonDC', 'London', 'Paris'],, index=['India', 'USA', 'UK', 'France']), print(S1['India', 'UK']), a., India NewDelhi, UK London, dtype: object, 37
Page 47 :
b., India NewDelhi, UK Washington, dtype: object, c. Error, d. None of the above, Ans a, 10 What will ne the output of the above given code?, import pandas as pd, s=pd.Series([1,2,3,4,5],index=["ajay", "pankaj","deepti","rajesh","ritika"]), print(s["rajesh"]), a) 1, b) 2, c) 3, d) 4, Ans 4, , 38
Page 48 :
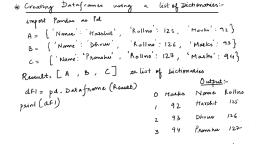
UNIT I- DATA FRAMES, DataFrame Data Structure, It is two dimensional (tabular) heterogeneous data labeled array., It has two indices or two axes : a row index (axis=0) and a column index (axis=1), The row index is known as index and the column index is called the column name., The indices can be of any data type., It is both value mutable and size mutable., We can perform arithmetic operations on rows and columns., Creating and Displaying a DataFrame, To create a DataFrame object, we can use the syntax:, <dataframe object> = pandas.DataFrame( <a 2D datastructure> , [columns=<column, sequence>] , [index=<index sequence>] ), where the 2D data structure passed to it, contains the data values., Empty DataFrame, import pandas as pd, df=pd.DataFrame(), print(df), DataFrame from 2D dictionary, A 2D dictionary is a dictionary having items as (key : value) where value part is a data, structure of any type : a list, a series, a dictionary etc. But the value parts of all the keys, should have similar structure and equal lengths., Creating a DataFrame from 2D dictionary having values as lists:, dict1={'Students':['Neha','Maya','Reena'],, 'Marks':[20,40,30],, 'Sports':['Cricket', 'Football','Badminton']}, df1=pd.DataFrame(dict1), print(df1), , , The keys of the dictionary has become columns., , , , The columns are placed in sorted order., 39
Page 49 :
, , The index is assigned automatically (0 onwards)., , We can specify our own index too by using the index argument., df2=pd.DataFrame(dict1,index=['I','II','III']), print(df2), , , The number of indexes given in the index, sequence must match the length of the dictionary’s values, otherwise Python will, give error., , Creating a DataFrame from 2D dictionary having values as Series objects., , , DataFrames are two dimensional representation of series., , smarks=pd.Series({'Neha':80,'Maya':90,'Reena':70}), sage=pd.Series({'Neha':25,'Maya':30,'Reena':29}), dict={'Marks':smarks,'Age':sage}, df3=pd.DataFrame(dict), print(df3), or, smarks=pd.Series([80,90,70],index=['Neha','Maya','Reena']), sage=pd.Series([25,30,29],index=['Neha','Maya','Reena']), dict={'Marks':smarks,'Age':sage}, df3=pd.DataFrame(dict), print(df3), DataFrame object created has columns assigned from the keys of the, dictionary object and its index assigned from the indexes of the Series, object which are the values of the dictionary object., , Creating a DataFrame from list of dictionaries, student=[{'Neha':50,'Manu':40},{'Neha':60,'Maya':45}], df4=pd.DataFrame(student,index=['term1','term2']), print(df4), NaN is automatically added in missing places., 40
Page 50 :
Selecting or Accessing Data, import pandas as pd, dict={'BS':[80,98,100,65,72],'ACC':[88,67,93,50,90],, 'ECO':[100,75,89,40,96],'IP':[100,98,92,80,86]}, df5=pd.DataFrame(dict,index=['Ammu','Achu','Manu','Anu','Abu']), print(df5), Selecting / Accessing a column, Syntax :, <dataframe object>[<column name>] Or <dataframe object>.<column name>, , , In the dot notation make sure not to put any quotation marks around the column, name., , print(df5.BS), or, print(df5['BS']), Selecting / Accessing multiple columns, Syntax :, <dataframe object>[[<column name>,<column name>,…….]], , , Columns appear in the order of column names given in the list inside square, brackets., , print(df5[['BS','IP']]), Selecting / Accessing a subset from a DataFrame using Row/Column names, <dataframe object>.loc[<start row>:<end row>,<start column>:<end column>], To access a row:, <dataframe object>.loc[<row label>, : ], , , Make sure not to miss the colon after comma., , print(df5.loc['Ammu', :]), , 41
Page 51 :
To access multiple rows:, <dataframe object>.loc[<start row>:<end row> , : ], , , Python will return all rows falling between start row and end row; along with, start row and end row., print(df5.loc['Ammu':'Manu', : ]), , , , Make sure not to miss the colon after comma., , To access selective columns:, <dataframe object>.loc[ : , <start column> : <end column>], , , Lists all columns falling between start and end column., , print(df5.loc[:,'ACC':'IP']), , , , Make sure not to miss the colon before comma., , To access range of columns from a range of rows:, <dataframe object>.loc[<start row> : <end row>,, <start column> : <end column>], print(df5.loc['Manu':'Abu','ACC':'ECO']), , Selecting / Accessing a subset from a DataFrame using Row/Column numeric, index/position, Sometimes our dataframe object does not contain row or column labels or even we may not, remember, then to extract subset from dataframe we can use iloc., <dataframe object>.iloc[<start row index> : <end row index>,, [<start column index> : <end column index>], , , When we use iloc, then end index is excluded., 42
Page 52 :
print(df5.iloc[1:3,1:3]), , Selecting / Accessing individual value, (i), , Either give name of row or numeric index in square bracket of column, name, <dataframe object>.<column>[<row name or row numeric index>], print(df5.ACC['Achu']), , 67, , or, print(df5.ACC[1]), (ii), , Using at or iat, <dataframe object>.at[<row label>,<column label>], Or, <dataframeobject>.iat[<numeric row index>,, <numeric column index>], print(df5.at['Achu','ACC']) 67, or, print(df5.iat[1,1]), , Assigning / Modifying Data Values in DataFrame, To change or add a column, <dataframe object>[<column name>]=<new value>, , , If the given column name does not exist in dataframe then a new column with, the name is added., df5['ENG']=60, print(df5), , , , If you want to add a column that has different values for all its rows, then we, can assign the data values for each row of the column in the form of a list., df5[‘ENG’]=[50,60,40,30,70], , , , There are some other ways for adding a column to a database., <dataframe object>.at[ : , <column name>]=value, 43
Page 55 :
Iterating over a DataFrame, Using pandas.iterrows() Function, , , The method <DF>.iterrows() views a dataframe in the form of horizontal subset, ie row-wise., , , , Each horizontal subset is in the form of (row-index, Series) where Series, contains all column values for that row –index., , , , We can iterate over a Series object just as we iterate over other sequences., , import pandas as pd, dict={'BS':[80,98],'ACC':[88,67]}, df5=pd.DataFrame(dict,index=['Ammu','Achu']), print(df5,"\n"), for (row,rowseries) in df5.iterrows():, print("Row index:",row), print("containing"), i=0, for val in rowseries:, print("At position ",i,":",val), i=i+1, print(), Using pandas.iteritems() Function, , , The method <DF>.iteritem() views a dataframe in the form of vertical subset ie, column-wise., , , , Each vertical subset is in the form of (col-index, Series) where Series contains, all row values for that column index., , import pandas as pd, dict={'BS':[80,98],'ACC':[88,67]}, df5=pd.DataFrame(dict,index=['Ammu','Achu']), , 46
Page 56 :
print(df5,"\n"), for (column,columnseries) in df5.iteritems():, print("Column index:",column), print("containing"), i=0, for val in columnseries:, print("At row ",i,":",val), i=i+1, print(), Head and Tail Functions, head(), <DF>.head([n=5]), , , To retrieve 5, top rows of a dataframe., , , , We can change the number of rows by specifying value for n., df5.head(5), df5.head(2), , tail(), , , To retrieve 5, bottom rows of a dataframe., , , , We can change the number of rows by specifying value for n., df5.tail(5), df5.tail(2), , 47
Page 59 :
DataFrame attributes, All information related to a DataFrame object is available through attributes., <DataFrane object> . <attribute name>, Attribute, , Description, , index, , Returns the index (row labels) of the DataFrame, , columns, , Returns the column labels of the DataFrame, , axes, , Returns a list representing both the axes of the Data, Frame (axis=0 i.e. index and axis=1 i.e. columns), , values, , Returns a Numpy representation of the DataFrame, , dtypes, , Returns the dtypes of data in the DataFrame, , shape, , Returns tuple of the shape of the DataFrame, , ndim, , Returns number of dimensions of the dataframe, , size, , Returns the number of elements in the dataframe, , empty, , Returns True if the DataFrame object is empty, otherwise, False, , T, , Transpose index and columns of DataFrame, , Case study questions:, 1. Consider the following Data Frame df and answer questions, A, , B, , C, , DEPT, , CS, , PROD, , MEDICAL, , EMPNO, , 101, , 102, , 103, , ENAME, , ABC, , PQR, , LMN, , SALARY, , 200000, , 100000, , 20000, , i. Write code to delete column B, ii. Write the output of the below code, print(df.tail(2)), iii. Write code to delete row salary, iv. Change the value of column A to 100, v.Change the value of DEPT of B to MECH, vi. Display DEPT and SALARY of column A and B, 50
Page 60 :
vii. Write code to rename column ‘A’ to ‘D’ which will not effect original, dataframe, viii. Write code to add a column E with values [CS, 104,XYZ, 300000], ix. Write code to add a row COMM with values [3000,4000,5000], x. Write code to rename DEPT to DEPARTMENT which will effect the original, dataframe, xi. Write code to display DEPT in A, i. print(df.A[‘DEPT’]), ii. print(df[‘A’,’DEPT’]), iii. print(df.iloc[1:2,1:2]), iv. print(df.iat[3,2]), xii. Write the output of the statement print(len(df)), i. 3, ii. 4, iii. (4,3), iv. (3,4), Answers :=, i. del df['A'], ii., A, B, C, ENAME, ABC PQR LMN, SALARY 200000 100000 20000, iii. df=df.drop(['SALARY'],axis=0), iv. df['A']=100, v. df.B['DEPT']='MECH', vi. print(df.loc[['DEPT','SALARY'],["A","B"]]), vii. df.rename(columns={"A":"D"},inplace=False), viii. df['E']=["CS",104,"XYZ",300000], ix. df.loc['COMM']=[3000,4000,5000], x. df.rename(index={"DEPT":"DEPARTMENT"},inplace=True), xi. print(df.A[‘DEPT’]), xii. 4, , 2. Consider the following Data Frame df and answer questions, , S1, S2, S3, S4, , ACC, 90, 94, 98, 91, , BST, 91, 95, 99, 92, , ECO, 92, 96, 100, 93, , IP, 93, 97, 100, 94, , i., , Create a new column total TOT by adding marks, , ii., , Find the highest marks scored by student s1, 51
Page 62 :
i., , Display the name of city whose population >=20, range of 12 to 20, , ii., , Write command to set all vales of df as 0, , iii., , Display the df with rows in the reverse order, , iv., , Display the df with only columns in the reverse order, , v., , Display the df with rows & columns in the reverse order, , answers:i., , print(df[df.population>=20]), , ii., , df[:]=0, , iii., , print(df.iloc[::-1), , iv., , print(df.iloc[:,::-1]), , v., , print(df.iloc[::-1,::-1]), , 5. Consider the following Data Frame df and answer questions, , Write the ouput of the following, i., , print(len(df)), , ii., , print(df.count()), , iii., , print(df.count(1)), , iv., , print(min(df.loc['SALARY'])), , v., , print(max(df.loc['ENAME'])), , 53
Page 64 :
The head() function of dataframe will display how may rows from top if no, parameter is passed., (i) 1, (ii) 3, 3, , (iii) 5, (iv) None of these, ANS : (iii) 5, To change the 5th column's value at 3rd row as 35 in dataframe DF, you can, write, (a) DF[4, 6] = 35, , 4, , (b) DF.iat[4, 6] = 35, (c) DF[3, 5] = 35, (d) DF.iat[3, 5] = 35, ANS:- d) DF.iat[3, 5] = 35, Which function is used to find values from a DataFrame D using the index, number?, a) D.loc, b) D.iloc, , 5, , c) D.index, d) None of these, ANS: b) D.iloc, In a DataFrame, Axis= 0 represents the elements, a.rows, b.columns, , 6, , c.both, d.None of these., ANS: a.rows, 55
Page 65 :
In DataFrame, by default new column added as the _____________ column, (i) First (Left Side), (ii) Second, 7, , (iii)Last (Right Side), (iv) Any where in dataframe, ANS: (iii)Last (Right Side), Which of the following is correct Features of DataFrame?, a. Potentially columns are of different types, b. Can Perform Arithmetic operations on rows and columns, c. Labeled axes (rows and columns), , 8, , d. All of the above, ANS: d. All of the above, Write the code to append df2 with df1, a.Df2=Df2.append(Df1), b. Df2=Df2+Df1, , 9, , c. Df2=Df2.appendwith.Df1, d. Df2=Df1.append(Df1), ANS: a.Df2=Df2.append(Df1), When we create DataFrame from List of Dictionaries, then number of columns in, DataFrame isequal to the _______, a. maximum number of keys in first dictionary of the list, b. maximum number of different keys in all dictionaries of the list, , 10, , c. maximum number of dictionaries in the list, d. None of the above, ANS: b. maximum number of different keys in all dictionaries of the list, When we create DataFrame from List of Dictionaries, then dictionary keys will, , 11, , become ______, 56
Page 66 :
(i) Column labels, (ii) Row labels, (iii) Both of the above, (iv) None of the above, ANS: (i) Column labels, Which method is used to access vertical subset of a dataframe?, (i) iterrows(), (ii) iteritems(), 12, , (iii) itercolumns(), (iv) itercols(), ANS: (ii) iteritems(), Write statement to transpose dataframe DF., (i) DF.t, (ii) DF.transpose, , 13, , (iii)DF.T, (iv)DF.T( ), ANS: (iii)DF.T, In DataFrame, by default new column added as the _____________ column, a. First (Left Side), b. Second, , 14, , c. Last (Right Side), d. Any where in dataframe, ANS: Last (Right Side), We can add a new row to a DataFrame using the _____________ method, , 15, , (i), , rloc[ ], , (ii), , loc[ ], , (iii), , iloc[ ], , (iv), , None of the above, 57
Page 67 :
ANS: (ii) loc[ ], Which of the following function is used to load the data from the CSV file to, DataFrame?, , 16, , (i), , read.csv( ), , (ii), , readcsv( ), , (iii), , read_csv( ), , (iv), , Read_csv( ), , ANS: (iii) read_csv( ), Which of the following function is not a Boolean reduction function, (i) Empty, (ii) Any(), 17, , (iii) All(), (iv) Fillna(), ANS: (iv) Fillna(), Which among the following options can be used to create a DataFrame in, Pandas ?, (a) A scalar value, (b) An ndarray, , 18, , (c) A python dict, (d) All of these, ANS:- (d) All of these, Which attribute of a dataframe is used to convert row into columns and columns, into rows in a dataframe?, a) T, , 19, , b) ndim, c) empty, d) shape, 58
Page 68 :
ANS: a) T, When we create DataFrame from List of Dictionaries, then number of columns in, DataFrame is equal to the _______, (i) maximum number of keys in first dictionary of the list, (ii) maximum number of different keys in all dictionaries of the list, 20, , (iii) maximum number of dictionaries in the list, (iv) None of the above, ANS: (ii) maximum number of different keys in all dictionaries of the list, Which of the following is/are characteristics of DataFrame?, a) Columns are of different types, b) Can Perform Arithmetic operations, , 21, , c) Axes are labeled (rows and columns), d) All of the above, ANS: d) All of the above, Write short code to show the information having city=”Delhi” from dataframe, SHOP., (a) print(SHOP[City==’Delhi’]), , 22, , (b) print(SHOP[SHOP.City==’Delhi’]), (c) print(SHOP[SHOP.’City’==’Delhi’]), (d) print(SHOP[SHOP[City]==’Delhi’]), ANS: (b) print(SHOP[SHOP.City==’Delhi’]), Which of the following commands is used to install pandas?, (i)pip install python –pandas, (ii)pip install pandas, , 23, , (iii)python install python, (iv)python install pandas, ANS: (ii) pip install pandas, , 24, , Which attribute of a dataframe is used to get number of axis?, 59
Page 69 :
a.T, b.Ndim, c.Empty, d.Shape, ANS: b.Ndim, Display first row of dataframe ‘DF’, (i) print(DF.head(1)), (ii) print(DF[0 : 1]), 25, , (iii)print(DF.iloc[0 : 1]), (iv)All of the above, ANS: (iv)All of the above, To delete a column from a DataFrame, you may use statement., (a) remove, (b) del, , 26, , (c) drop, (d) cancel statement., ANS:- (b) del, In given code dataframe ‘Df1’ has ________ rows and _______ columns, import pandas as pd, dict= [{‘a’:10, ‘b’:20}, {‘a’:5, ‘b’:10, ‘c’:20},{‘a’:7, ‘d’:10, ‘e’:20}], Df1 = pd.DataFrame(dict), (i) 3, 3, , 27, , (ii) 3, 4, (iii)3, 5, (iv)None of the above, ANS: (iii)3, 5, 60
Page 70 :
To delete a row from a DataFrame, you may use, (a) remove, (b) del, 28, , (c) drop, (d) cancel, ANS:- (c) drop, In the following statement, if column ‘mark’ already exists in the DataFrame ‘Df1’, then the assignment statement will __________ Df1['mark'] = [95,98,100] #There, are only three rows in DataFrame Df1, (i) Return error, , 29, , (ii) Replace the already existing values., (iii)Add new column, (iv)None of the above, ANS: (ii) Replace the already existing values., To skip first 5 rows of CSV file, which argument will you give in, read_csv( ) ?, (a) skip_rows = 5, , 30, , (b) skiprows = 5, (c) skip - 5, (d) noread - 5, ANS:- (a) skip_rows = 5, . Which of the following statement is false:, , 31, , i., , DataFrame is size mutable, , ii., , DataFrame is value mutable, , iii., , DataFrame is immutable, , iv., , DataFrame is capable of holding multiple types of data, , ANS:- iii. DataFrame is immutable, 61
Page 71 :
Which of the following statements is false?, (i) Dataframe is size mutable, (ii) Dataframe is value mutable, 32, , (iii) Dataframe is immutable, (iv) Dataframe is capable of holding multiple type of data, ANS: (iii) Dataframe is immutable, To delete a row, the parameter axis of function drop( ) is assigned the value, ______________, (i), , 0, , (ii) 1, 33, , (iii) 2, (iv) 3, ANS: (i) 0, Which of the following function is used to load the data from the CSV file to, DataFrame?, (i) read.csv( ), (ii) readcsv( ), , 34, , (iii)read_csv( ), (iv)Read_csv( ), ANS: (iii)read_csv( ), Write code to delete rows those getting 5000 salary., (a) df=df.drop[salary==5000], (b) df=df[df.salary!=5000], , 35, , (c) df.drop[df.salary==5000,axis=0], (d) df=df.drop[salary!=5000], ANS: (b) df=df[df.salary!=5000], , 62
Page 73 :
(a) skiprows = 11315, (b) skiprows - (1, 3, 5], (c) skiprows = [1, 5, 1], (d) Any of these, ANS:- (b) skiprows - (1, 3, 5], In Pandas _______________ is used to store data in multiple columns., (i)Series, (ii) DataFrame, 41, , (iii) Both of the above, (iv) None of the above, ANS: (ii) DataFrame, What is dataframe?, a. 2 D array with heterogeneous data, b. 1 D array with homogeneous data, c. 2 D array with homogeneous data, , 42, , d. 1 D array with heterogeneous data, ANS: a. 2 D array with heterogeneous data, In a DataFrame, Axis= 1 represents the_____________ elements, (a) Row, (b) Column, , 43, , (c) True, (d) False, ANS: (b) Column, Which of the following is not an attribute of a DataFrame Object ?, , 44, , a. index, 64
Page 75 :
ANS:- iii. Dataframe, To skip 1st, 3rd and 5th rows of CSV file, which argument will you give in, read_csv( ) ?, (a) skiprows = 11315, 49, , (b) skiprows - (1, 3, 5], (c) skiprows = [1, 5, 1], (d) Any of these, ANS:- (b) skiprows - (1, 3, 5], In a DataFrame, Axis= 1 represents the_____________ elements, (a) Row, (b) Column, , 50, , (c) True, (d) False, ANS: (b) Column, NaN stands for:, a. Not a Number, b. None and None, , 51, , c. Null and Null, d. None a Number, ANS: a. Not a Number, To get top 5 rows of a dataframe, you may use, (a) head( ), , 52, , (b) head(5), (c) top( ), (d) top(5), 66
Page 76 :
ANS:- (a) head( ) , b) head(5), The correct statement to read from a CSV file in a dataframeis :, (a) .read_csv(), (b) . read_csv( )(), 53, , (c) = pandas.read(), (d) = pandas.read_csv(), ANS:- (d) = pandas.read_csv(), To delete a column from a dataframe, you may use ______ statement., , 54, , i., , remove(), , ii., , ii. del(), , iii., , iii. drop(), , iv., , iv. cancel(), , ANS:- iii. drop(), The following code create a dataframe named ‘Df1’ with _______________, columns., import pandas as pd, Df1 = pd.DataFrame([10,20,30] ), (i) 1, 55, , (ii) 2, (iii) 3, (iv) 4, ANS: (i) 1, To delete a row from dataframe, you may use _______ statement., , 56, , i., , remove(), , ii., , ii. del(), , iii., , iii. drop(), , iv., , iv. cancel(), , ANS:- ii. del(), 67
Page 77 :
In a Data-Frame, Axis= 0 represents the elements along the______, a. Row, b. Column, 57, , c. Row and Column Both, d. None of the above, ANS: a. Row, ___________ method in Pandas can be used to change the index of rows and, columns of a Series or Dataframe, (a) rename(), , 58, , (b) reindex(), (c) reframe(), (d) none of these, ANS: (b) reindex(), Write the single line command to delete the column “marks” from dataframe df, using drop function., (a) df=df.drop(col=‘marks’), , 59, , (b) df=df.drop(‘marks’,axis=col), (c) df=df.drop(‘marks’,axis=0), (d) df=df.drop(‘marks’,axis=1), ANS: (d) df=df.drop(‘marks’,axis=1), Which of the following is used to give user defined column index in DataFrame?, (i) index, (ii) column, , 60, , (iii) columns, (iv) colindex, ANS: (iii) columns, 68
Page 78 :
The following statement will _________, df = df.drop(['Name', 'Class', 'Rollno'], axis = 1) #df is a DataFrame object, a. delete three columns having labels ‘Name’, ‘Class’ and ‘Rollno’, 61, , b. delete three rows having labels ‘Name’, ‘Class’ and ‘Rollno’, c. delete any three columns, d. return error, ANS:- a. delete three columns having labels ‘Name’, ‘Class’ and ‘Rollno’, Difference between loc() and iloc().:, a. Both are Label indexed based functions., b. Both are Integer position-based functions., c. loc() is label based function and iloc() integer position based function., d. loc() is integer position based function and iloc() index position based function., , 62, , ANS: c. loc() is label based function and iloc() integer position based, function., , Which command will be used to delete 3 and 5 rows of the data frame. Assuming, the data frame name as DF., a. DF.drop([2,4],axis=0), b. DF.drop([2,4],axis=1), 63, , c. DF.drop([3,5],axis=1), d. DF.drop([3,5]), ANS: a DF.drop([2,4],axis=0), Assuming the given structure, which command will give us the given output:, Output Required: (3,4), , 64, , 69
Page 80 :
UNIT I- Data Visualization, What is Data Visualization ?, Data visualization is the technique to present the data in a pictorial or graphical format. It, enables stakeholders and decision makers to analyze data visually. The data in a, graphical format allows them to identify new trends and patterns easily., The main benefits of data visualization are as follows:, , , , , , , It simplifies the complex quantitative information, It helps analyze and explore big data easily, It identifies the areas that need attention or improvement, It identifies the relationship between data points and variables, It explores new patterns and reveals hidden patterns in the data, , Purpose of Data visualization:, Better analysis, Quick action, Identifying patterns, Finding errors, Understanding the story, Exploring business insights, Grasping the Latest Trends, matplotlib Library and pyplot Interface, • The matplotlib is a python library that provides many interfaces functionally for 2D, graphics, • In short we can call mattplotlib as a high quality plotting library of Python., • The matplotlib library offers many different named collections of methods, pyplot is one, such interface., • pyplot is a collection of methods within matplotlib which allows user to construct, 2D plots easily and interactively., Installing matplotlib, It is done using pip command in Command Prompt, pip install matplotlib, , 71
Page 81 :
Importing PyPlot, To import Pyplot following syntax is, import matplotlib.pyplot, or, import matplotlib.pyplot as plt, After importing matplotlib in the form of plt we can use plt for accessing any function of, matplotlib, , Steps to plot in matplotlib:, • Create a .py file & import matplotlib library to it using import statement, import matplotlib.pyplot as plt, • Set data points in plot( ) method of plt object, • Customize plot by setting different parameters, • Call the show() method to display the plot, • Save the plot/graph if required, , Types of plot using matplotlib, • LINE PLOT, • BAR GRAPH, • HISTOGRAM etc., Line Plot:, A line plot/chart is a graph that shows the frequency of data occurring along a number, line. The line plot is represented by a series of data points called markers connected, with a straight line. Generally line plots are used to display trends over time. A line, plot or line graph can be created using the plot() function available in pyplot library., We can, not only just plot a line but we can explicitly define the grid, the x and y axis, scale and labels, title and display options etc., , Line chart: displaying data in form of lines., • We can create line graph with x coordinate only or with x and y coordinates., • Function to draw line chart – plot(), 72
Page 82 :
• Default colour of line- blue, • Syntax: plt.plot(x,y), Line Plot customization, • Custom line color, plt.plot(x,y,'red'), Change the value in color argument like ‘b’ for blue,’r’,’c’,….., • Custom line style and line width, plt.plot(x,y, linestyle='solid' , linewidth=4)., set linestyle to solid/dashed/dotted/dashdot, set linewidth as required, • Title, plt.title('DAY – TEMP Graph ') – Change it as per requirement, • Labelplt.xlabel(‘TIme') – to set the x axis label, plt.ylabel(‘Temp') – to set the y axis label, , , Changing Marker Type, Size and Color, plt.plot(x,y,'blue',marker='*',markersize=10,markeredgecolor='magenta'), , Order of methods used in plot() function:, Plt.plot(x,y,color,linewidth,linestyle,marker, markersize,markeredgecolor), Function used to show the graph – show(), plt.show( ), , PROGRAM, import matplotlib.pyplot as plt, X=[1,2,3,4,5], Y=[2,4,6,8,10], plt.title('Simple Line Graph'), 73
Page 83 :
plt.xlabel('X Axis'), plt.ylabel('Y Axis'), plt.plot(X,Y,'r'), plt.show(), , Bar Graph, A graph drawn using rectangular bars to show how large each value is. The bars can, be horizontal or vertical. A bar graph makes it easy to compare data between, different groups at a glance. Bar graph represents categories on one axis and a, discrete value in the other. The goal bar graph is to show the relationship between, the two axes. Bar graph can also show big changes in data over time., , , Syntax :, , plt.bar(x,y), , Bar graph customization, • Custom bar color, plt.bar(x,y, color="color code/color name"), To se different colors for different bars, plt.bar(x,y, color="color code/color name sequence"), • Custom bar width, plt.bar(x,y, width=float value), 74
Page 84 :
To se different widths for different bars, plt.bar(x,y, width=float value sequence), • Title, plt.title(' Bar Graph ') – Change it as per requirement, • Labelplt.xlabel(‘Overs') – to set the x axis label, plt.ylabel(‘Runs') – to set the y axis label, , PROGRAM :, import matplotlib.pyplot as plt, overs=['1-10','11-20','21-30','31-40','41-50'], runs=[65,55,70,60,90], plt.xlabel('Over Range'), plt.ylabel('Runs Scored'), plt.title('India Scoring Rate'), plt.bar(overs,runs), plt.show( ), , 75
Page 85 :
HISTOGRAM, A histogram is a graphical representation which organizes a group of data points, into user specified ranges., Histogram provides a visual interpretation of numerical data by showing the number, of data points that fall within a specified range of values (“bins”). It is similar to a, vertical bar graph but without gaps between the bars., Difference between a histogram and a bar chart / graph –, A bar chart majorly represents categorical data (data that has some labels, associated with it), they are usually represented using rectangular bars with lengths, proportional to the values that they represent. While histograms on the other hand, is used, to describe distributions., , Creating a Histogram :, , , It is a type of bar plot where X-axis represents the bin ranges while Y-axis gives, information about frequency., , , , To create a histogram the first step is to create bin of the ranges, then distribute the, whole range of the values into a series of intervals, and count the values which fall, into each of the intervals., , , , Bins are clearly identified as consecutive, non-overlapping intervals of variables., 76
Page 86 :
, , The hist() function is used to create histogram, , , , Syntax:, plt.hist(x,other parameters), , Optioal Parameters, x, , array or sequence of array, , bins, , optional parameter contains integer or, sequence or strings, , histtype, , optional parameter used to create type, of histogram [bar, barstacked, step,, stepfilled], default is “bar”, , align, , optional parameter controls the plotting, of histogram [left, right, mid], , orientation, , Optional. Possible values are, ‘horizontal’ or ‘vertical’, , color, , optional parameter used to set color or, sequence of color specs, , PROGRAM :, import matplotlib.pyplot as plt, data=[7,7,7,8,8,8,8,8,9,10,10,10,11,11,12,12,12,13], plt.xlabel('Data'), plt.ylabel('Frequency'), plt.title('Histogram'), plt.hist(data,bins=7,color='green'), plt.show(), , 77
Page 87 :
• Title, plt.title('Histogram ') – Change it as per requirement, • Labelplt.xlabel(‘Data') – to set the x axis label, plt.ylabel(‘Frequency') – to set the y axis label, , • Legend - A legend is an area describing the elements of the graph. In the matplotlib, library there is a function named legend() which is used to place a legend on the axes ., When we plot multiple ranges in a single plot ,it becomes necessary that legends are, specified.It is a color or mark linked to a specific data range plotted ., To plot a legend you need to do two things., i)In the plotting function like bar() or plot() , give a specific label to the data range using, label, ii)Add legend to the plot using legend ( ) as per the sytax given below ., Syntax : - plt.legend((loc=position number or string), position number can be u1,2,3,4 specifying the position strings upper right/'upper, left/'lower left/lower right respectively ., Default position is upper right or 1, 78
Page 88 :
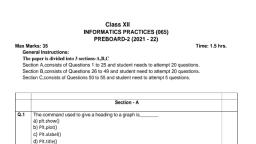
Saving the Plot, Tosave any plot savefig() method is used. Plots can be saved in various formats, like pdf,png,eps etc ., plt.savefig('line_plot.pdf') // save plot in the current directory, plt.savefig('d:\\plot\\line_plot.pdf') // save plot in the given path, , Multiple Choice Questions and answers, SECTION B, , 1.What is data visualization?, a) It is the numerical representation of information and data, b) It is the graphical representation of information and data, c) It is the character representation of information and data, d) None of the above, Ans : b) It is the graphical representation of information and data, 2.Which is a python package used for 2D graphics?, a) matplotlib.pyplot, b) matplotlib.pip, c) matplotlib.numpy, d) mathplotlib.pyplot, Ans: a) matplotlib.pyplot, 3.The command used to give a heading to a graph is _________, (a) plt.show(), (b) plt.plot(), (c) plt.xlabel(), 79
Page 89 :
(d) plt.title(), Ans: (d) plt.title(), 4. Using Python Matplotlib _________ can be used to count how many values fall, into each interval., (a) line plot, (b) bar graph, (c) histogram, (d) None of these, Ans : (c) histogram, 5.Fill the missing statement, import matplotlib.pyplot as plt, marks=[30,10,55,70,50,25,75,49,28,81], plt._____(marks, bins=’auto’, color=’green’), plt.show(), (a) plot, (b) bar, (c)hist, (d)draw, Ans : (c)hist, 6.Which module of matplotlib library is required for plotting of graph ?, (a) Plot, (b) Matplot, (c) pyplot, (d) graphics, Ans : (c) pyplot, 7.Observe the output figure. Identify the code for obtaining this output., , 80
Page 90 :
a) import matplotlib.pyplot as plt, plt.plot([1,2],[4,5]), plt.show(), b) import matplotlib.pyplot as plt, plt.plot([2,3],[5,1]), plt.show(), c) import matplotlib.pyplot as plt, plt.plot([1,2,3],[4,5,1]), plt.show(), d) import matplotlib.pyplot as plt, plt.plot([1,3],[4,1]), plt.show(), Ans: c) import matplotlib.pyplot as plt, plt.plot([1,2,3],[4,5,1]), plt.show(), 8.Identify the right type of chart using the following hints., Hint 1: This chart is often used to visualize a trend in data over intervals of time., Hint 2: The line in this type of chart is often drawn chronologically., a) Line chart, b) Bar chart, c) Pie chart, d) Scatter plot, Ans : a) Line chart, 9.Which of the following is/are correct statement for plot method?, a) plt.plot(x,y,color,others), b) pl.plot(x,y), 81
Page 91 :
c) pl.plot(x,y,color), d) All the above, Ans: d) All the above, , 10.To give a title to x-axis, which of the following, method is used?, a) plt.xtitle(“title”), b) plt.xlabel(“title”), c) plt.xheader(“title”), d) plt.xlabel.show(“title”), Ans: b) plt.xlabel(“title”), 11.To change the width of bars in bar chart, which of the following argument, with a float value is used?, a) thick, b) thickness, c) width, d) barwidth, Ans: c) width, 12.What is the purpose of legend?, a) A legend is an area describing the elements of the graph., b) A legend is top area with information about graph, c) A legend is additional information of x and y labels, d) A legend is a mini box with bars data, Ans: a) A legend is an area describing the elements of the graph., 13.Which function can be used to export generated graph in, matplotlib to png, a) savefigure ( ), b) savefig( ), c) save( ), d) export ( ), Ans: b) savefig( ), 82
Page 92 :
14.which one of these is not a valid line style in matplotlib, a) ‘-‘, b) ‘--‘, c) ‘-.’, d) ‘<’, Ans: d) ‘<’, 15.How can we make bar chart horizontal?, a) plt.bar(), b) plt.hbar(), c) plt.barh(), d) plt.rightbar(), Ans: c) plt.barh(), 16. A histogram is used:, a) for continuous data, b) for grouped data, c) for time series data, d) to compare two sets of, data, Ans: a) for continuous data, 17.Which function is used to show legend ?, a) display ( ), b) show( ), c) legend( ), d) legends( ), Ans: c) legend( ), 18.The datapoints plotted on a graph are called _____________, a) Markers, b) Values, c) Ticks, d) Pointers, Ans : a) Markers, 83
Page 95 :
c) bar, d) histogram, Ans: d). histogram, 4. Statement A : Data visualization refers to the graphical representation of, information and data using visual elements like charts, graphs and maps etc., Statement B : To install matplotlib library we can use the command pip install, matplotlib., a. Both statements are correct., b. Both statements are incorrect., c. Statement A is correct, but Statement B is incorrect, d. Statement A is incorrect, but Statement B is correct, Ans : a. Both statements are correc, 5. Fill the missing statement, import matplotlib.pyplot as plt, marks=[30,10,55,70,50,25,75,49,28,81], plt._____(marks, bins=’auto’, color=’green’), plt.show(), (a) plot, (b) bar, (c) hist, (d) barh, Ans : (c) hist, , ASSERTION BASED QUESTIONS:, In each of the questions given below, there are two statements marked as, Assertion (A) and Reason (R). Mark your answer as per the codes provided below:, (A) A is true but R is false., (B) Both A and R are true, (C) A is false but R is true., (D) Both A and R are false., 86
Page 96 :
1. ASSERTION(A) :A histogram is basically used to represent data provided in the, form of groups spread in non-continuous ranges, REASON(R) : matplotlib.pyplot.hist() function is used to compute and create, histogram of a variable., Ans: C, 2.ASSERTION(A) : legend (labels = [‘Text’]) is used to give title to the graph, REASON(R) : plt.savefig(“path”) will save the current graph in png or jpeg format, Ans: C, 3.ASSERTION(A) : plt.plot(x,y,'g',label="Students participating, competition") will plot a, Line chart, REASON(R) : ‘g’ in plot() function is colour of the marker, , in, , CCA, , Ans: A, 4.ASSERTION(A) : linestyle, linewidth are used to customize line graph, REASON(R) : In the following example markers, line style and colour are mentioned, exclusively, emp_count = [3, 20, 50, 200, 350, 400], year = [2014, 2015, 2016, 2017, 2018, 2019], plt.plot(year, emp_count, 'o’, ’-‘, ’g'), Ans: B, 5. ASSERTION(A) : In histogram X-axis is about bin ranges where Y-axis talks about, frequency, REASON(R) : The bins (intervals) must be adjacent, and are often (but are not required, to be) of equal size., Ans: B, 6. ASSERTION(A) : matplotlib.pyplot.show() is a method used to plot a line graph, REASON(R) : show() is method is defined in the library matplotlib.pip, Ans: D, 7. ASSERTION(A) : pyplot is a sub-library of matplotlib, REASON(R) : line() is not a valid plotting function of pyplot, 87
Page 97 :
Ans: B, 8. ASSERTION(A) : legend of the graph reflects the data displayed on the graph’s Yaxis, REASON(R) : Location of the legend can be changed by using loc attribute, Ans: B, 9.ASSERTION(A): Bar graph and histogram are same, REASON(R): A bar graph represents categorical data using rectangular, bars. A histogram represents data which is grouped into continuous, number ranges and each range correspond to a vertical bar., Ans: C, , Case Study based questions:, , 1. Mr. Sharma is working in a game development industry and he was comparing, the given chart on the basis of the rating of the various games available on the, play store. He is trying to write a code to plot the graph. Help Mr. Sharma to, fill in the blanks of the code and get the desired output., , import__________________________ #Statement 1, Games=[“Subway Surfer”,”Temple Run”,”Candy Crush”,”Bottle hot”,”Runner, Best”], 88
Page 99 :
(iv) Choose the right function/method from the following for the statement 4., (a) display(), (b) print(), (c) bar(), (d) show(), Ans: (d) show(), , (v) In case Mr. Sharma wants to change the above plot to any other shape, which, statement, should he change., (a) Statement 1, (b) Statement 2, (c) Statement 3, (d) Statement 4, Ans: (b) Statement 2, , 2. ABC Enterprises is selling its products through three salesmen and keeping the, records of sales done quarterly of each salesman as shown below:, , Company is storing the above information in a CSV file “Qtrly_Sales.csv”. Mr., Rohit is a programmer. Company has given him the responsibility to create the, 90
Page 101 :
Ans : (b). kind, , 4. Choose the correct word to give the heading in line 5, (a). label, (b). heading, (c). title, (d). caption, Ans : (c). title, , 5. Choose the correct word to display the graph in line 8, (a). plot(), (b). display(), (c) . showgraph(), (d). show(), Ans : (d). show(), , 3. Mr.Sharma is trying to write a code to plot line graph shown in fig-1. Help Mr., Sharma to fill in the blanks of the code and get the desired output., , 92
Page 102 :
import matplotlib.pyplot as plt # statement 1, x = [1,2,3] # statement 2, y = [2,4,1] # statement 3, plt.plot(x, y, color=’g’) #statement 4, ______________ # statement 5, ______________ # statement 6, # giving a title to my graph, plt.____________('My first graph!') # statement 7, # function to show the plot, _______________ # statement 8, i) Which of the above statement is responsible for plotting the values on canvas., a) Statement 8, b) Statement 4, c) Statement 1, d) None of the above, Ans: b) Statement 4, ii) Statements 5 & 6 are used to give names to x-axis and y-axis as shown in fig.1., Which of the following can fill those two gaps, a) plt.xlabel('x - axis') plt.ylabel('y - axis'), b) plt.xtitle('x - axis') plt.ytitle('y - axis'), c) plt.xlable('x - axis') plt.ylable('x - axis'), 93
Page 103 :
d) plt.xlabel('x axis') plt.ylabel('y axis'), Ans : d) plt.xlabel('x axis') plt.ylabel('y axis'), iii) Raman has executed code with first 7 statements. But No output displayed. which, of the following statements will display the graph?, a) plt.display(), b) plt.show(), c) matplotlib.pyplot.show(), d) Both b & c ], Ans : d) Both b & c, iv) The number of markers in the above line chart are, a) zero, b) three, c) Infinite, d) One, Ans: b) three, v) Which of the following methods will result in displaying 'My first graph!' in the, above graph, a) legend(), b) label(), c) title(), d) Both a & c, Ans : c) title(), , 94
Page 104 :
UNIT 4: SOCIETAL IMPACTS, ● Digital footprint, net and communication etiquettes,, ● Data protection, intellectual property rights (IPR), plagiarism, licensing and copyright,, ● Free and open source software (FOSS),, ● Cybercrime and cyber laws, hacking, phishing, cyber bullying, overview of Indian IT, Act., ● E-waste: hazards and management. Awareness about health concerns related to the, usage of technology., DIGITAL FOOTPRINT, A digital footprint – refers to the trail of data you leave while using the internet. It includes, websites you visit, emails you send, and information you submit online. A digital footprint, can be used to track a person’s online activities and devices., Internet users create their digital footprint either actively or passively. A passive, footprint is made when information is collected from the user without the person knowing, this is happening. An active digital footprint is where the user has deliberately shared, information about themselves either by using social media sites or by using websites, Digital footprint examples, Online shopping, Making purchases from e-commerce websites, Online banking, Using a mobile banking app, Social media, Using social media on your computer or devices, , , Sharing information, data, and photos with your connections, , Reading the news, Subscribing to an online news source, Health and fitness, Using fitness trackers, , , Using apps to receive healthcare, , NETIQUETTE, It is the abbreviation of Internet etiquette or network etiquette, refers to online manners, while using internet or working online. While online you should be courteous, truthful and, respectful of others. It includes proper manners for sending e-mail, conversing online, and, so on., Some basic rules of netiquette are:, 95
Page 105 :
, , , , , , , Be respectful, Think about who can see what you have shared., Read first, then ask, Pay attention to grammar and punctuation, Respect the privacy of others, Do not give out personal information, , DATA PROTECTION, Data protection is a set of strategies and processes you can use to secure the privacy,, availability, and integrity of your data. It is sometimes also called data security or information, privacy. A data protection strategy is vital for any organization that collects, handles, or, stores sensitive data., Data Privacy v/s Data Protection, For data privacy, users can often control how much of their data is shared and with whom., For data protection, it is up to the companies handling data to ensure that it remains private., Data privacy is focused on defining who has access to data while data protection focuses, on applying those restrictions., How we can protect our personal data online, , , , , , , , , , Through Encrypt our Data, Keep Passwords Private, Don't Overshare on Social Networking Sites, Use Security Software, Avoid Phishing Emails, Be Wise About Wi-Fi, Be Alert to Impersonators, Safely Dispose of Personal Information, , INTELLECTUAL PROPERTY RIGHTS (IPR), Intellectual Property (IP) – is a property created by a person or group of persons using, their own intellect for ultimate use in commerce and which is already not available in the, public domain., Examples of Intellectual Property :- an invention relating to a product or any process, a, new design, a literary or artistic work and a trademark (a word, a symbol and / or a logo,, etc.), Intellectual Property Right (IPR) is the statutory right granted by the Government, to the, owner(s) of the intellectual property or applicant(s) of an intellectual property (IP) to exclude, others from exploiting the IP commercially for a given period of time, in lieu of the discloser, of his/her IP in an IPR application., Copyright laws protect intellectual property, Copyright It is a legal concept, enacted by most governments giving creator of, original work exclusive rights to it, usually for a limited period., 96
Page 106 :
Copyright infringement – When someone uses a copyrighted material without, permission, it is called Copyright infringement., Patent – A patent is a grant of exclusive right to the inventor by the government., Patent give the holder a right to exclude others from making, selling, using or importing a, particular product or service, in exchange for full public disclosure of their invention., Trademark – A Trademark is a word, phrase, symbol, sound, colour and/or design, that identifies and distinguishes the products from those of others., PLAGIARISM, Plagiarism It is stealing someone’s intellectual work and representing it as your own work, without citing the source of information., Any of the following acts would be termed as Plagiarism:, Using some other author’s work without giving credit to the author, Using someone else’s work in incorrect form than intended originally by the author or, creator., Modifying /lifting someone’s production such as music composition etc. without, attributing it to the creator of the work., Giving incorrect source of information., LICENSING AND COPYRIGHT, Licenses are the permissions given to use a product or someone’s creation by the, copyright holder., Copyright is a legal term to describe the rights of the creator of an original creative, work such as a literary work, an artistic work, a design, song, movie or software etc., FREE AND OPEN-SOURCE SOFTWARE (FOSS), OSS refers to Open Source Software, which refers to software whose source code is, available to customers and it can be modified and redistributed without any limitation., Free and open-source software (FOSS) is software that can be classified as both, free software and open-source software. That is, anyone is freely licensed to use, copy,, study, and change the software in any way, and the source code is openly shared so that, people are encouraged to voluntarily improve the design of the software., , CYBER CRIME:, Any criminal or illegal activity through an electric channel or through any computer, network is considered as cyber crime., Eg: Cyber harassment and stalking, distribution of child pornography,types of, spoofing, credit card fraud ,. etc, CYBER LAW:, It is the law governing cyberspace which includes freedom of expression, access to, and usage of internet and online privacy., The issues addressed by cyber law include cybercrime, e-commerce, IPR and Data, protection., 97
Page 107 :
HACKING:, It is an act of unauthorised access to a computer, computer network or any digital, system., Hackers usually are technical expertise of hardware and software., Hacking when done with a positive intent is called as Ethical hacking or, White hat., Hacking when done with a negative intent is called as Unethical hacking or, Black hat., PHISHING:, It is an unlawful activity where fake websites or emails appear as original or authentic, .This sites when clicked by the user will collect sensitive and personal details like, usernames, password, credit card details etc., CYBER BULLYING:, , It is the use of technology to harass , threaten or humiliate a target ., Example: sharing of embarrassing photos or videos, posting false information,, sending mean text., etc., OVERVIEW OF INDIAN IT ACT:, , The Government of India’s – Information Technology Act, 2000 (also known as IT, Act) , amended in 2008, provides guidelines to the user on the processing , storage, and transmission of sensitive information, E-waste - HAZARDS AND MANAGEMENT:, , Various forms of electric and electronic equipment which no longer satisfy their, original purpose are termed as Ewaste. This includes Desktop, Laptop, Projectors,, Mobiles,etc, HAZARDS:It consists of mixtures of various hazardous organic and inorganic, materials which when mixed with water/soil may create threat to the, environment., MANAGEMENT: Sell back, gift/donate, reuse the parts giveaway to a certified, e-waste recycler, , AWARENESS ABOUT HEALTH CONCERNS RELATED TO THE USE OF, TECHNOLOGY:, There are positive as well as negative impact on health due to the use of these, technologies., POSITIVE IMPACT, Various health apps and gadgets are available to monitor and alert, Online medical records can be maintained, NEGATIVE IMPACT, , 98
Page 108 :
, , , One may come across various health issues like eye strain, muscle, problems, sleep issues,etc, Anti social behaviour, isolation, emotional issues, etc., , ASSERTION AND REASONING BASED QUESTIONS, Assertion: (A) Plagiarism is stealing someone else’s intellectual work and representing it, as your own work., Reason : (R) Using someone else’s work and giving credit to the author or creator., a) Both A and R are true and R is the correct explanation of A., b) Both A and R are true but R is not the correct explanation of A., c) A is true but R is false., d) A is false but R is true., e) Both A and B are false, Ans: c) A is true but R is false., MUTIPLE CHOICE QUESTIONS, 1. Online posting of rumours, giving threats online, posting the victim’s personal, information, comments aimed to publicly ridicule a victim is termed as __________, a. Cyber bullying, b. Cyber crime, c. Cyber insult, d. All of the above, Ans: Cyber bullying, 2. Ankit made a ERP - Enterprise resource planning solution for a renowned university, and registered and Copyrights for the same. Which of the most important option;, Ankit got the copyrights., a., b., c., d., , To get society status, To get fame, To get community welfare, To secure finance protection, Ans: To secure finance protection, , 3. Which of the following is not an example of Social media platform?, a. Facebook, b. Pinterest, c. Google+, d. Social channel, 99
Page 109 :
Ans: Social channel, , 4. A responsible netizen must abide by __________, a. Net etiquettes, b. Communication etiquettes, c. Social media etiquettes, d. All of the above, Ans: All of the above, 5. A ___________ is some lines of malicious code that can copy itself and can have, detrimental effect on the computers, by destroying data or corrupting the system., a. Cyber crime, b. Computer virus, c. Program, d. Software, Ans: Computer virus, 6. Which of the following activity is an example of leaving Active digital footprints?, a) Surfing internet, b) Visiting a website, c) Sending an email to a friend, d) None of the above, Ans: Sending an email to a friend, 7. You are planning to go for a vacation. You surfed the internet to get answers for, following queries., a) Places to visit, b) Availability of air tickets and fares, c) Best hotel deals, d) All of these, Which of the above-mentioned actions might have created a digital footprint?, Ans: All of these, 8. Legal term to describe the rights of a creator of original creative or artistic work is, called…….., a) Copyright, b) Copyleft, c) GPL, d) BSD, Ans: Copyright, 9. Intellectual Property is legally protected through ____, a) copyright, b) patent, c) registered trademark, 100
Page 110 :
d) All of the above, Ans: All of the above, , 10. _____________ includes any visual symbol, word, name, design, slogan, label,, etc., that distinguishes the brand from other brands., a) Trademark, b) Patent, c) Copyright, d) None of the above, Ans: Trademark, CASE STUDY BASED QUESTION:, 1. Naveen received an email warning him of closure of his bank accounts if he did not, update his banking information as soon as possible. He clicked the link in the email and, entered his banking information. Next he got to know that he was duped., a) This is an example of __________ ., i. Online Fraud, ii. Identity Theft, iii. Phishing, iv.Plagarism, b) Someone steals Naveen’s personal information to commit theft or fraud, it is, called ____________, i.Online Fraud, ii. Identity Theft, iii. Phishing, iv.Plagarism, c) Naveen receiving an Unsolicited commercial emails is known as __________, i.Spam, ii.Malware, iii.Virus, iv. Worms, d) Naveen’s Online personal account, personal website are the examples of?, i. Digital wallet, ii. Digital property, iii.Digital certificate, iv.Digital signature, e) Sending mean texts, posting false information about a person online, or, sharing embarrassing photos or videos to harass, threaten or humiliate a, target person, is called ____________, i.Eavesdropping, ii.Cyberbullying, iii.Spamming, iv.Phishing, 101
Page 111 :
Solution:, a) iii.Phishing, b) ii.Identity theft, c) i.spam, d) ii.Digital Property, e) ii.Cyberbullying, 2. Prathyush has to prepare a project on “Cyber Jaagrookta Diwas”.He decides to get, information from the Internet. He downloads three web pages (webpage1, webpage 2,, webpage 3) containing information on the given topic., 1. He read a paragraph from webpage 1 and rephrased it in his own words. He, finally pasted the rephrased paragraph in his project. And he put a citation about the, website he visited and its web address also., 2. He downloaded three images of from webpage 2. He made a collage for his, project using these images., 3. He also downloaded an icon from web page 3 and pasted it on the front page of, his project report., , (i) Step1 is an act of……………, (a) Plagiarism, (b) copyright infringement, (c) Intellectual Property right, (d) None of the above, (ii) Step 2 is an act of _______., (a) plagiarism, (b) copyright infringement, (c) Intellectual Property right, (d) Digital Footprints, (iii) Step 3 is an act of ________., (a) Plagiarism, (b) Paraphrasing, (c) copyright infringement, (d) Intellectual Property right, (iv) ______is a small piece of data sent from a website and stored in a user’s web, browser while a user is browsing a website., 102
Page 112 :
(a) Hyperlinks, (b) Web pages, (c) Browsers, (d) Cookies, (v) The process of getting web pages, images and files from a web server to local, computer is called, (a) FTP, (b) Uploading, (c) Downloading, (d) Remote access, Solution:, I., (d)None of the above, II. (a) plagiarism, III., (c) copyright infringement, IV., (d) Cookies, V. (c) Downloading, , 103
 Learn better on this topic