Notes of Class XII Eco. (Mon-Sat), Economics Economics TERM 2 - Study Material
Page 2 :
CBSE Term II, , 2022, , Economics, Class XII, Complete Theory Covering NCERT, Case Based Questions, Short/Long Answer Type Questions, 3 Practice Papers with Explanations, , Author, Shubham Anand, , ARIHANT PRAKASHAN (School Division Series)
Page 3 :
ARIHANT PRAKASHAN (School Division Series), , © Publisher, No part of this publication may be re-produced, stored in a retrieval system or by any means,, electronic, mechanical, photocopying, recording, scanning, web or otherwise without the written, permission of the publisher. Arihant has obtained all the information in this book from the sources, believed to be reliable and true. However, Arihant or its editors or authors or illustrators don’t take any, responsibility for the absolute accuracy of any information published and the damage or loss suffered, thereupon., , All disputes subject to Meerut (UP) jurisdiction only., , Administrative & Production Offices, Regd. Office, ‘Ramchhaya’ 4577/15, Agarwal Road, Darya Ganj, New Delhi -110002, Tele: 011- 47630600, 43518550, , Head Office, Kalindi, TP Nagar, Meerut (UP) - 250002, Tel: 0121-7156203, 7156204, , Sales & Support Offices, Agra, Ahmedabad, Bengaluru, Bareilly, Chennai, Delhi, Guwahati,, Hyderabad, Jaipur, Jhansi, Kolkata, Lucknow, Nagpur & Pune., , ISBN : 978-93-25796-95-9, PO No : TXT-XX-XXXXXXX-X-XX, Published by Arihant Publications (India) Ltd., For further information about the books published by Arihant, log on to, www.arihantbooks.com or e-mail at
[email protected], Follow us on, , CBSE Term II, , 2022
Page 4 :
Contents, PART A, CHAPTER, Macroeconomics and Circular Flow of Income, , -, , CHAPTER, National Income and Its Measurement, , -, , CHAPTER, Aggregate Demand, Aggregate Supply and Related Concepts, , -, , CHAPTER, Equilibrium and Disequilibrium in the Economy, , -, , PART B, CHAPTER, Employment and Unemployment in India, , -, , CHAPTER, Infrastructure in India, , -, , CHAPTER, Environment and Sustainable Development, , -, , CHAPTER, Comparative Development Experience of India and Its Neighbours, , -, , Practice Papers, , -, , -, , Watch Free Learning Videos, Subscribe arihant, , Channel, , þ Video Solutions of CBSE Sample Papers, þ Chapterwise Important MCQs, þ CBSE Updates
Page 5 :
Syllabus, CBSE Term II Class XII, Theory -, , Marks, , Duration - hrs, , PART A : INTRODUCTORY MACROECONOMICS, , Marks, , Periods, , National Income and Related Aggregates, Determination of Income and Employment, Sub Total, PART B : INDIAN ECONOMIC DEVELOPMENT, Current challenges facing Indian Economy, Ÿ Employment, Ÿ Infrastructure, Ÿ Sustainable Economic Development, Development Experience of India A Comparison with Neighbours, Ÿ Comparative Development Experience of India and, its Neighbours, Sub Total, Total, Project Work, , PART A Introductory Macroeconomics, Unit-, , National Income and Related Aggregates, , Periods, , Ÿ What is Macroeconomics, Ÿ Basic concepts in macroeconomics: consumption goods, capital goods, final goods,, intermediate goods; stocks and flows; gross investment and depreciation., Ÿ Circular flow of income two sector model ; Methods of calculating National, Income - Value Added or Product method, Expenditure method, Income method., Ÿ Aggregates related to National Income:, Ÿ Gross National Product GNP , Net National Product NNP , Gross Domestic Product, GDP and Net Domestic Product NDP - at market price, at factor cost; Real and, Nominal GDP. GDP and Welfare, , CBSE Term II, , 2022
Page 6 :
Unit-, , Determination of Income and Employment, , Periods, , Ÿ Aggregate demand and its components., Ÿ Propensity to consume and propensity to save average and marginal ., Ÿ Short-run equilibrium output; investment multiplier and its mechanism., Ÿ Meaning of full employment and involuntary unemployment., Ÿ Problems of excess demand and deficient demand; measures to correct them changes in government spending, taxes and money supply through Bank Rate,, CRR, SLR, Repo Rate and Reverse Repo Rate, Open Market Operations, Margin, requirement., , PART B, Unit-, , Indian Economic Development, Current challenges facing Indian Economy, , Periods, , Ÿ Employment : Growth and changes in work force participation rate in formal and, informal sectors; problems and policies, Ÿ Infrastructure : Meaning and Types: Case Studies: Health: Problems and PoliciesA critical assessment;, Ÿ Sustainable Economic Development : Meaning, Effects of Economic Development, on Resources and Environment, including global warming, , Unit-, , Development Experience of India, Ÿ, Ÿ, Ÿ, Ÿ, , Periods, , A comparison with neighbours, India and Pakistan, India and China, Issues: economic growth, population, sectoral development and other Human, Development Indicators, , CBSE Term II, , 2022
Page 14 :
3, , CBSE Term-II Economics XII, , CHAPTER 01, , Macroeconomics, and Circular Flow, of Income, In this Chapter..., Macroeconomics, Basic Concepts of Macroeconomics, Intersectoral Flows, Circular Flow of Income, , Macroeconomics, Macroeconomics is that branch of economics which deals, with aggregates or issues related to the economy as a whole., , Some of the basic concepts of macroeconomics such as goods, produced in the economy, investment, depreciation, etc. are, as follows, , 2. Intermediate Goods Those goods which will be used, for the production of other goods or which will be, resold are known as intermediate goods., e.g. cloth, electronic parts, etc., 3. Consumer/Consumption Goods These are the goods, which are used by end-users to satisfy their needs and, desires. Such goods are not used in the production of, other goods., e.g., ice-cream and milk used by the households. These, goods can be classified as durable goods, semi-durable, goods, non-durable goods and services., 4. Capital Goods These are the goods which are used to, produce other goods and services for a number of years., These goods are fixed assets of the producers., e.g., building, plant and machinery, etc., , Classification of Goods, , Investment, , 1. Final Goods Those goods, which have crossed the, boundary line of production and are ready for use by, their final users are known as final goods. e.g. shirt, pen,, TV, washing machine, etc. These goods can be further, classified as final consumer goods and final producer, goods., , It is the process of capital formation for a firm or increase in, the stock of capital., I = ∆K, Here, I = Investment,, ∆K = Change in capital stock during the year, , Scope of Macroeconomics, l, , l, , l, , l, , It helps in policy formulation of government., It provides basis for microeconomic study., It helps to understand the distribution of income among, different groups of people., It facilitates international comparison., , Basic Concepts of, Macroeconomics
Page 15 :
4, Components of Investment, There are mainly two components of investment, 1. Fixed Investment It refers to increase or addition in, the stock of fixed assets of the producers during a, financial year., 2. Inventory Investment It refers to the stock of finished, goods, semi-finished goods and raw material. This, stock keeps varying overtime., , Types of Investment, There are mainly two types of investment, 1. Gross Investment Increase in value of capital stock, during a specific period is called gross investment, i.e.,, expenditure on fixed assets or on inventory stock., It has two components,, (i) Gross fixed investment, (ii) Inventory investment, Gross Investment = Expenditure on the Purchase of, Fixed Assets in an Accounting Year, + Expenditure on the Inventory, Stock in an Year, 2. Net Investment It is the actual increase in stock of, capital during an accounting year. It is also termed as, net capital formation., Net Investment = Gross Investment − Depreciation, , Depreciation, It refers to loss in the value of fixed assets in use on account of, Normal wear and tear, Normal rate of accidental changes, Expected or foreseen obsolescence, l, , l, , l, , Depreciation Reserve Fund, It is a fund created by the producers to meet the upcoming, depreciation losses in the process of production. Due to, depreciation, fixed assets need to be replaced from time to, time which requires funds. So, every year, an amount from, the profit is appropriated to depreciation reserve fund., , Stock, A stock is a quantity of any economic variable which is, measured at a particular point of time. e.g. amount in the, bank account at a specific date., , Flow, Flow variables are defined as any quantity which is, measured over a period of time. e.g. income or expenditure, over a time period of one month or one year., , CBSE Term-II Economics XII, , Intersectoral Flows, Intersectional flows refer to the flow of goods and services as, well as the flow of money among different sectors of the, economy. The flow of goods and services are called ‘real flows’, while the flow of money is called ‘money flows’ across different, sectors., These flows (both real as well as money flows) point to, intersectoral interdependence or the dependence of one, sector on the other. These intersectional interdependences, are satisfied through a system of mutual exchanges, and, mutual exchanges lead to intersectoral flows of money as well, as of goods and services., These flows are the essence of modern economic activity as, the entire economic activity revolves around these, intersectoral flows., To illustrate, factor services flow from households to the, producers without which production activity is not possible., Likewise, factor incomes flow from producers to the, households without which consumption activity is not, possible., , Circular Flow of Income, The circular flow means the unending flows of production of, goods & services and income & expenditure in an economy, from one sector of an economy to another. It shows the, redistribution of income in a circular manner between, production units and households., There are three phases in any circular flow of income, which, includes, 1. Production Phase In this phase, firms produce goods, and services with the help of factor services., 2. Income Phase This phase involves the flow of factor, income (rent, wages, interest and profits) from firms to, the households., 3. Expenditure Phase In this phase, the income received, by factors of production, is spent on the goods and, services produced by firms., Production phase, (Generation of income), Income phase, (Distribution of income), Expenditure phase, (Disposition of income), , In this way, income is first generated in production units,, then distributed to households and finally spent on goods and, services produced by these units to make the circular flow, complete its course.
Page 16 :
CBSE Term-II Economics XII, , 5, , Sectors Involved in Circular Flow, Different sectors, which are involved in circular flow within an economy are, 1. Household Sector It is engaged in the consumption of goods and services and is also the provider of factor services., 2. Producing Sector It is engaged in the production of goods and services. It is also referred to as ‘firms’., 3. Government Sector It is engaged in such activities which are related to taxation and subsidies as well as consumption, and production., 4. Rest of the World It is engaged in exports and imports., , Circular Flow in Two-sector Economy, In a two-sector economy, there are only two sectors of economic activity, namely households and firms. Households supply, factor services to firms and firms hire factor services from households. Households spend their entire income on consumption, of goods and services. Firms sell what is produced by the households. This leads to intersectoral flow., In this type of economy, circular flow can be explained with the help of the following diagram, , Leakages, , These refer to the withdrawal from the circular flow. Leakages cause contraction in the circular flow. e.g. savings, import, taxes, by the government, etc., Injections, , These refer to the addition to the circular flow. Injections cause expansion in the circular flow, e.g. investment, exports,, government spending, etc.
Page 17 :
CBSE Term-II Economics XII, , 6, , Chapter, Practice, PART 1, Objective Questions, l, , Multiple Choice Questions, 1. Which of the following is the main problem, , 4. Which of the given pair is incorrectly matched?, Column I, , (i) Goods that are used-up in a single, act of consumption, , B. Capital goods, , (ii) Goods used as fixed assets by the, producers in the production of, other goods and services, , C. Consumption, goods, , (iii) Goods which are not used in the, production of other goods, , D. Final goods, , (iv) Goods which have not yet crossed, the boundary line of production, , addressed in macroeconomics?, (a) Determination of output of a firm, (b) Determination of price of a product, (c) Determination of income and employment level in an, economy, (d) All of the above, Ans. (c) Determination of income and employment level, in an economy, , 2. The study of macroeconomics deals with which of, the following questions of an economy?, (i) Will prices as a whole rise or come down?, (ii) Is the employment condition of the country getting, better or is it worsening?, (iii) What all factors act as a stimulant towards achieving, higher growth rate?, Alternatives, (a) (i) and (ii), (b) (ii) and (iii), (c) (i) and (iii), (d) (i), (ii) and (iii), Ans. (d) Study of economic problems at the level of country as, a whole is called macroeconomics. Understanding, macroeconomic indicators such as inflation,, unemployment, GDP, trade flows etc. comes under the, purview of macroeconomics., , 3. Intermediate goods are those goods, (a) which have not yet crossed the boundary line of, production, (b) which are purchased by one firm from the other firm, for resale, (c) which are not included in the estimation of, national product, (d) All of the above, Ans. (d) All of the above, , Column II, , A. Non-durable, consumer goods, , Codes, (a) A-(i), (b) B-(ii), (c) C-(iii), (d) D-(iv), Ans. (d) Final goods are those which have crossed the, , boundary line of production and are ready for use by, their final users. e.g., car used by the households,, machine used by the producer, etc., , 5. Which of the following is the cause of unexpected, obsolescence?, (a) Natural calamities, (b) Change in demand, (c) Change in technology, (d) Both (a) and (c), Ans. (a) Natural calamities, , 6. Money flow refers to the, (a) flow of goods across different sectors of the economy, (b) flow of services across different sectors of the economy, (c) flow of money across different sectors of the economy, (d) flow of income across different sectors of the economy, Ans. (c) flow of money across different sectors of the economy, , 7. Depreciation is the, (a) loss in the value of fixed assets in use due to normal, wear and tear, (b) loss of value of fixed assets in use due to normal rate of, accidental damages, (c) loss of value of fixed assets in use due to foreseen, obsolescence, (d) All of the above, Ans. (d) All of the above
Page 18 :
7, , CBSE Term-II Economics XII, , 8. Which of the following is not an example of, depreciation?, (a) A plant producing rubber shoes becomes obsolete, when demand shift from rubber shoes to leather shoes, (b) A plant producing black and white televisions, becomes obsolete when technology is discovered to, produce coloured televisions, (c) Fall in the market value of assets during the period of, economic downturn, (d) Fall in the value of your residential apartment, Ans. (c) Fall in the market value of assets during the period of, economic downturn, , 9. “Expected obsolescence is included in, depreciation”. The given statement is, , (CBSE 2020), , (a) True, (b) False, (c) Partially true, (d) Partially false, Ans. (a) Expected obsolescence is the normal wear and tear in, fixed assets., , 10. ` 200 note lying in the pocket of Rohini, a student,, is an example of ……… ., , Ans. (d) Capital output ratio establishes a relationship between, , capital employed and units produced. It is a flow variable, as it relates to a period of time and it is a unit free, measure, therefore it is represented as a pure number. It, Capital Stock, is calculated as, ., GDP, , 14. Which of the following is not a leak from the, circular flow of income/expenditure?, (a) Taxes, (b) Transfers, (c) Net imports, (d) Savings, Ans. (b) Transfers are not a leak from the circular flow of, income/ expenditure, as they merely represent movement, from one head to another., , 15. The fiscal deficit is a, (a) flow variable, (b) stock variable, (c) the ratio of a flow variable to a stock variable., (d) the ratio of a stock variable to a flow variable., Ans. (a) Fiscal deficit is a flow variable as it is defined with, reference to a period of time., , (a) stock variable, (b) flow variable, (c) Both stock and flow, (d) None of the above, Ans. (a) stock variable, , 16. The phases of circular flow of income includes, , 11. The rate of interest is, , (a) (i) and (ii), (b) (ii) and (iii), (c) (i) and (iii), (d) (i), (ii) and (iii), Ans. (d) Every type of circular flow of income has three phases, which are connected in a circular form. The process, starts with production, which generates income and, distribution of income leads to expenditure. Expenditure, further generates demand for production., , (a) a flow variable, (b) a stock variable, (c) the ratio of a flow variable to a stock variable, (d) the ratio of a stock variable to a flow variable, Ans. (a) Rate of interest is a flow variable as it relates to a, period of time, e.g. 6% per annum or 2% per month., , 12. Economic activities cover, (a) only activities that result in products that are, exchanged in markets, (b) only activities that people engage in for profit, (c) only activities that are or can potentially be delegated, to someone else, (d) only activities that are entered into the national, accounts, Ans. (a) An activity which is related to the use of scarce, resources is called an economic activity. These activities, are classified as production, consumption, investment,, exchange and distribution., , 13. If an economy produces GDP of ` 30 billion per, year with a capital stock of ` 135 billion, then, capital output ratio is a, (a) stock variable with a value of ` 4.5 billion., (b) stock variable with a value of 4.5 years., (c) flow variable with a value of ` 4.5 billion., (d) flow variable with a value of 4.5 as pure number., , (i) phase of production, (ii) phase of income generation, (iii) phase of disposal, , Alternatives, , 17. A car purchased by a household is a ……… ., (CBSE 2020), , (a) single use capital good, , (b) single use consumer good, , (c) durable consumer good, , (d) semi-durable consumer good, , Ans. (c) A car purchased by a household is a final good and a, , durable consumer good because the household is the, final user of the car and no value is to be added to the car., , 18. Which of the following is a stock variable?, (a) Interest on capital, (b) Distance between Delhi and Goa, (c) Expenditure on money, (d) All of the above, Ans. (b) Distance between Delhi and Goa, , 19. Which of the following statements is/are correct?, (i) Flow of factor services rendered by the households, to the producers is real flow., (ii) Depreciation reserve fund refers to the fund which, the producers keep to cope with depreciation losses, in the process of production.
Page 19 :
CBSE Term-II Economics XII, , 8, Alternatives, , 3. Assertion (A) All producer goods are capital goods., , (a) Both are true, (b) Both are false, (c) (i) is true, but (ii) is false (d) (i) is false, but (ii) is true, Ans. (a) Flow of factor services rendered by the households to, the producers are real flows because these flow involve the, movement of goods and services from one sector to the, other., , Reason (R) Producer goods are those which are, used in the production of other goods whereas, capital goods are the fixed assets of the producers., Ans. (c) Producer goods are those which are used for further, , production. These may be used either as raw material or, as fixed assets. Capital goods are fixed assets of the, producers which are repeatedly used in the production of, other goods and services and are of high value., Therefore, all producer goods are not capital goods., , 20. Match the correct combination between the, following columns., Column I, , (i) Capital goods, , B. Milk and ice-cream used, by households, , (ii) Semi-durable, consumer goods, , C. Tractors used by the, farmers, , (iii) Intermediate goods, , D. Wood purchased by a, timber merchant for resale, , (iv) Consumption goods, , Codes, A B C D, (a) (ii) (iv) (i) (iii), (c) (ii) (i) (iv) (iii), Ans.(a) (ii) (iv) (i) (iii), l, , Column II, , A. Electric goods like, tubelights and bulbs, , 4. Assertion (A) High fixed investment is a sign of, growth and development., Reason (R) Fixed investment indicates production, capacity of a nation. Greater the addition to, production capacity (fixed investment), higher the, growth and development., Ans. (a) Both Assertion (A) and Reason (R) are true and Reason, , (R) is the correct explanation of Assertion (A), , 5. Assertion (A) Expenditure on maintenance of, machinery is an intermediate expenditure., Reason (R) All expenditures on repair and, maintenance incurred by the firm are treated as, part of intermediate consumption., , A B C D, (b) (iv) (ii) (iii) (i), (d) (i) (iii) (ii) (i), , Ans. (a) Both Assertion (A) and Reason (R) are true and Reason, , (R) is the correct explanation of Assertion (A), , Assertion–Reasoning MCQs, Directions (Q. Nos. 1 to 7) There are two statements, marked as Assertion (A) and Reason (R). Read the, statements and choose the appropriate option from the, options given below., (a) Both Assertion (A) and Reason (R) are true and Reason, (R) is the correct explanation of Assertion (A), (b) Both Assertion (A) and Reason (R) are true, but, Reason (R) is not the correct explanation of Assertion, (A), (c) Assertion (A) is false, but Reason (R) is true, (d) Both of the statements are false, , 6. Assertion (A) Unexpected obsolescence is an, element of depreciation., Reason (R) Loss of value of fixed assets owing to, un expected obsolescence is called capital loss., Ans. (c) Only expected obsolescence is considered as an element, , of depreciation, not the unexpected obsolescence., , 7. Assertion (A) Real flow and money flow are one or, the same thing, presented in a different form., Reason (R) In money flow, there is no involvement, of goods in its physical form., Ans. (d) Real flow and money flow are different in the way that, , the formal is based upon the use of goods in the system, while the later uses money. Money flow also involves, goods but in exchange of money only., , 1. Assertion (A) Microeconomics and, Macroeconomics are interdependent upon each, other. One cannot study the two in isolation., Reason (R) Microeconomics has a smaller degree of, aggregation while Macroeconomics has greater, degree of aggregation., Ans. (a) Both Assertion (A) and Reason (R) are true and Reason, , l, , Case Based MCQs, 1. Direction Observe the following picture and, answer question no. (i) to (vi) given below., Imports, , (R) is the correct explanation of Assertion (A), , Households, , Savings, Taxes, , 2. Assertion (A) LED TV is an example of durable, consumer goods., Reason (R) LED TV can be repeatedly used for, several years and is of relatively high value., Ans. (a) Both Assertion (A) and Reason (R) are true and Reason, , (R) is the correct explanation of Assertion (A), , Consumer, expenditure, , Income, , Exports, , Firms, , Investment, Government, expenditure
Page 20 :
9, , CBSE Term-II Economics XII, (i) The above diagram shows which type of circular, flow of income?, (a) Real flow, (b) Physical flow, (c) Money flow, (d) None of these, Ans. (c) The above is a case of money flow, as there is payment, of money involved in this case., , (ii) Which of the following case is true as per the figure, given above?, (a) The above model is an example of two-sector open, economic model, (b) The above model is an example of two-sector closed, economic model, (c) The above model is an example of three-sector open, economic model, (d) The above model is an example of three-sector closed, economic model, Ans. (b) The above model is an example of two-sector closed, economic model as it only involves household and firms., Exclusion of tertiary sector makes it a closed economic, model., , Reason (R) Intersectoral interdependences are, satisfied through a system of mutual exchanges, and, mutual exchanges lead to intersectoral flows of, money as well as goods and services., Alternatives, (a) Both Assertion (A) and Reason (R) are true and Reason, (R) is the correct explanation of Assertion (A)., (b) Both Assertion (A) and Reason (R) are true, but Reason, (R) is not the correct explanation of Assertion (A)., (c) Assertion (A) is false, but Reason (R) is true, (d) Both the statements are false, Ans. (a) Both Assertion (A) and Reason (R) are true and Reason, (R) is the correct explanation of Assertion (A)., , 2. Direction Analyse the following circular flow chart, carefully and answer the question no. (i) to (vi) on, the basis of the same., Goods and Services, , (iii) Government expenditure in the above case is an, example of ………… ., (a) injections, (b) leakages, (c) withdrawals, (d) Both (b) and (c), Ans. (a) Government expenditure leads to increase in the, flow of income into the economy, thus it is considered as, an injection., , (iv) Imports in the above model is an example of, (a) injections, (b) leakages, (c) withdrawals, (d) Both (b) and (c), Ans. (d) Imports leads to the outflow of income as we have to, pay to the outsiders to buy their goods. It is thus,, considered as a leakage., , (v) Which of the following is a leakage from the, circular flow of income as per the above diagram?, (i) Taxes, (ii) Savings, (iii) Imports, (iv) Exports, (v) Government expenditure (vi) Investment, , Alternatives, (a) (i), (iii) and (iv), (b) (i), (ii) and (iii), (c) (iii), (v) and (vi), (d) (iv), (v) and (vi), Ans. (b) Taxes, savings and imports are the leakages from the, circular flow of income as they lead to decrease in, income and slower down the process of growth., , (vi) Assertion (A) Intersectoral flows refer to the flow of, goods and services as well as flow of money among, different sectors of the economy., , Consumer Expenditure, Wages, Rent, Dividends, Households, , Firms, Factors for Production, , (i) The figure shows ……… flow., (a) real, (c) Both (a) and (b), Ans. (b) money, , (b) money, (d) None of these, , (ii) When money moves out of circular flow of income,, it is known as ……… ., (a) Leakages, (c) Both (a) and (b), Ans. (a) Leakages, , (b) Injections, (d) None of these, , (iii) In an two economic model described above, how, many sectors are there?, (a) Three, (c) Five, Ans. (b) Two, , (b) Two, (d) None of these, , (iv) Who are considered as the owner of factors of, production in the circular flow of income?, (a) Firms, (c) Government, Ans. (b) Household, , (b) Household, (d) Rest of the world, , (v) The value of Marginal Propensity to Save (MPS), is zero. In this case, the value of Marginal, Propensity to Consume (MPC) will be ……… ., (a) 1, Ans. (a) 1, , (b) 0, , (c) − 1, , (d) None of these
Page 21 :
CBSE Term-II Economics XII, , 10, (vi) Assertion (A) Real and money flows are the, essence of modern economic activity., Reason (R) Factor services flow from household to, the producers without which production activity is, not possible. Likewise, factor incomes flow from, producers to the households without which, consumption activity is not possible., Alternatives, (a) Both Assertion (A) and Reason (R) are true and, Reason (R) is the correct explanation of Assertion (A)., (b) Both Assertion (A) and Reason (R) are true, but Reason, (R) is not the correct explanation of Assertion (A)., (c) Assertion (A) is false, but Reason (R) is true, (d) Both the statements are false, Ans. (a) Both Assertion (A) and Reason (R) are true and, Reason (R) is the correct explanation of Assertion (A)., , 3. Direction Read the following text and answer, question no. (i) to (vi) on the basis of the same., Manish is an entrepreneur who manufactures, decorative items. He is at the helm of affairs. He, hires wage labour from the market and employs, the services of capital and land as well. After, hiring the inputs, he undertakes the task of, production which involves conversion of raw, material into finished products., His motive is to ensure the optimal utilisation of, the available inputs and to produce output for sale, in the market and maximise profit., His products are also available on e-commerce, websites and are not limited only to domestic, consumers but to consumers of other countries as, well thus, ensuring inter-regionalism., However in this process, he undertakes risks and, uncertainties, for example he may not get a right, price for his product which in turn would, minimise his profit level. There is also a possibility, that the goods might damage during shipping, process., (i) As per the case given above, profit earned by, Manish will be referred as ……… ., (a) factor income, (b) transfer income, (c) unproductive service, (d) non-market service, Ans. (a) Profit is earned by the fourth factor of production, known as entrepreneur. This income is earned by, rendering factor services., , (ii) Manish sells his goods in countries like America,, Belgium and Germany. Trade with these countries, includes which of the following sector of an, economy?, , (a) Household, (b) Firms, (c) Government, (d) Rest of the world, Ans. (d) Trade with the external sector i.e., countries different, from the domestic countries are known as rest of the world, and demand for domestic goods are known as exports., , (iii) Choose the correct statement from given below, options., (a) Manish is involved in production activity, (b) Manish is involved in distribution of goods, (c) Manish is involved in disposal of income, (d) All of the above, Ans. (a) Production is the process of converting raw materials, into finished goods., , (iv) Manish is selling in foreign countries as well. If it is, to be a model of circular flow of income, which of, the following it should be?, (a) Closed economic model, (b) Open economic model, (c) Traditional economic model, (d) Modern economic model, Ans. (b) When a producer or firm trades with the rest of the, world, it is considered as an open economy as the, country is involved with export and import with rest of the, world., , (v) Export of good to the rest of the world will lead to, ………… in circular flow of income., (a) increase, (b) decrease, (c) no change, (d) ambiguous, Ans. (a) Export of goods leads to inflow of income into the, circular flow, this leads to increase in income and hence, growth of the nation., , (vi) Assertion (A) One of the way to mitigate the risk of, damage or loss is to get the goods insured., Reason (R) Insurance act is an assurance to, safeguard and provide some sense of security to the, concerned parties involved., Alternatives, (a) Both Assertion (A) and Reason (R) are true and Reason, (R) is the correct explanation of Assertion (A)., (b) Both Assertion (A) and Reason (R) are true, but Reason, (R) is not the correct explanation of Assertion (A)., (c) Assertion (A) is false, but Reason (R) is true, (d) Both the statements are false, Ans. (a) Both Assertion (A) and Reason (R) are true and Reason (R), is the correct explanation of Assertion (A).
Page 22 :
11, , CBSE Term-II Economics XII, , PART 2, Subjective Questions, l, , Short Answer (SA) Type Questions, 1. Giving reasons, classify the following into, , 4. What is the difference between microeconomics, and macroeconomics?, Ans. Difference between microeconomics and, , macroeconomics, Basis, , Microeconomics, , 2. Giving reasons, classify the following into, intermediate goods and final goods., (i) Ceiling fan purchased by a tailor for his shop., (ii) Chalks, dusters, etc. purchased by a school., Ans. (i) Ceiling fan purchased by a tailor for his shop is a final, good because tailor is the final user of the ceiling fan, and no value is to be added to the ceiling fan. This, will be deemed as investment expenditure because, ceiling fan is used by the tailor for several years and is, of high value., (ii) Chalks, dusters, etc. purchased by a school are, intermediate goods as these are used up in the, process of value addition during the year., , 3. Which among the following are final goods and, which are intermediate goods? Give reasons., (i) Milk purchased by a tea stall, (ii) Bus purchased by a school, (iii) Juice purchased by a student from the school canteen, (CBSE 2018), Ans., , (i) ‘Milk purchased by a tea stall’ is an intermediate, goods., Reason It will be used as a raw material for making, tea and involves value addition., (ii) ‘Bus purchased by a school’ is final good., Reason School purchases bus as long-term durable, product and it is an investment for school. It is not, for re-sale., (iii) ‘Juice purchased by a student from school canteen’ is, final good., Reason Here juice is purchased for direct, satisfaction of student’s need, i.e., juice is being, consumed by its end user., , Macroeconomics, , Meaning, , It studies, economic, problems at an, individual level., , It studies economic, problems at the level of, an economy as a whole., , Determines, , It determines the, output and price, for an individual, firm., , It determines an, aggregate output and, general price level in the, whole economy., , Tools, , Demand and, supply are its, main tools., , Aggregate demand and, aggregate supply are its, main tools., , intermediate goods and final goods., (i) Curtain cloth purchased by a household., (ii) Machinery installed in an office., Ans. (i) Curtain purchased by a household is a final, consumer good because the household is the final, user of the curtain cloth and there is no value, addition., (ii) Machinery installed in an office is a final producer, good because machinery is finally and repeatedly, used by the office for several years and these are of, high value., , (NCERT), , Dependence It assumes all the, macrovariables to, be constant as, national income,, consumption,, saving, etc., , It assumes all the, microvariables to be, constant as demand of, households, supply of, firms, prices of, individual products, etc., , 5. ‘‘Final goods include only those goods which are, consumed by the households.’’ Defend or refute, the given statement with valid reason. (CBSE 2020), Ans. Final goods include only those goods which are, , consumed by the households. The given statement is, refused as final goods are the goods which have crossed, the boundary line of production and are ready to use by, consumers and producers (includes capital goods). These, goods can be further classified as final consumer goods, and final producer goods., , 6. Distinguish intermediate goods from final goods, with the help of suitable examples., , (CBSE 2019), , Ans. Differences between intermediate goods and final goods, , Basis, , Intermediate, Goods, , Boundary These goods remain, Line, within the boundary, line of production, and are not ready for, use by their final, users., , Final Goods, These goods are outside, the boundary line of, production and are ready, for use by their final users., , Resale, , These goods may be These goods are not, reproduced or, resold by firms for making, resold by firms for, profit., making profit., , Value, Addition, , Value is yet to be, added to these, goods., , Value is not to be added to, these goods.
Page 23 :
CBSE Term-II Economics XII, , 12, 7. Explain with the help of an example, the basis of, classifying goods into final goods and intermediate, goods., (All India 2017; Delhi 2010), Ans. The basis of classification is the end-use of the product., , Goods which are used by the producers in the process of, production such as raw material or goods purchased for, resale, are known as intermediate goods, e.g. shirt, purchased by a firm for resale. These goods are still, within the production boundary., Goods which are outside the boundary line of production, and are ready for use by their final users are called final, goods, e.g. shirt purchased by a consumer., , 8. ‘All producer goods are not capital goods’. Do, you agree?, Ans. Yes, I agree that all producer goods are not capital goods,, , because producer goods includes, (i) Goods which are used as raw material like wood,, used to make furniture., (ii) Goods which are used as fixed assets like plant and, machinery., Capital goods include only fixed assets of the producers., These are durable goods. On the other hand, goods used, as raw material are not capital goods as these are not, repeatedly used in the process of production. Thus, all, producers goods are not capital goods., , 9. Distinguish between consumption of fixed capital, and capital loss., Ans. Consumption of fixed capital refers to depreciation of, , fixed assets. It refers to loss of value of fixed assets while, these are being used in the process of production. It, occurs on account of normal wear and tear, accidental, damages and expected obsolescence., On the other hand, capital loss is the loss of value of fixed, assets when these are not being used. It occurs on, account of natural calamities (like earthquake, floods, or, fire) and fall in the market value of the assets during, periods of economic recession., , 10. How is depreciation different from depreciation, reserve fund?, Ans. Difference between depreciation and depreciation, , reserve fund, Basis, , Depreciation, , Depreciation, Reserve Fund, , Concept It is the loss of value of, fixed assets in use, on, account of normal wear, and tear., , It is a provision of funds, created by producers to, cope up with, depreciation losses., , Effect, , It leads to correct, computation of profit., , These funds are used, for the replacement of, fixed assets when these, are worn out., , Reason, , Expected or foreseen, obsolescence, normal, wear and tear., , Obsolete/outdated, assets need to be, repalced., , 11. Distinguish between stock and flow. Between net, investment and capital which is a stock and which, is a flow? Compare net investment and capital with, flow of water into a tank., (NCERT), Ans. Stock is that quantity of an economic variable which is, , measured at a particular point of time. Stock has no time, dimension. Flow is the quantity of an economic variable, which is measured during the period of time. Flow has a, time dimension as per hour, per day or per month., Net investment is a flow variable and capital is a stock, variable. Flow of water in a tank is flow because it is, measured as per unit of time period. Whereas, stock of, water in a tank is stock because it is measured at a point, of time. Capital is like a stock of water in the tank at a, point of time., , 12. Give reasons and categorise the following into, stock and flow., , (Delhi 2013), , (i) Capital, (ii) Saving, (iii) Gross domestic product, (iv) Wealth, Ans. (i) Capital It is a man-made means of production. It is a, stock because it is measured at a given point of time., (ii) Saving It is the surplus of production over, consumption. It is a flow as it is measured during a, period of time., (iii) Gross Domestic Product It is a flow as it is the, market value of final goods and services produced, within the domestic territory measured during a, period of time., (iv) Wealth It is a stock as it is measured at a particular, point of time., , 13. Distinguish between money flows and real flows., Ans. Flow of income refers to flow of goods and services (or, , their money value) across different sectors of the, economy. It is called real flow in case it occurs in the, form of goods and services, e.g., households rendering, their factor services to the producers and in return, producers offering final goods and services to the, households. It is called money flows because there is a, flow of money value from one sector to the other, e.g.,, producers make factor payments to the households and, households make payments to the producers for the, purchase of goods and services., , 14. How money flows are opposite to real flows?, Explain with the help of an example., Ans. Money flows are opposite to real flows because money, , flows in response to the real flows. For example, There is, a real flow of goods and services from the producers to, the households. It is in response to it, that the households, make payments to the producers. So, money flows from, the households to the producers in terms of consumption, expenditure., Likewise, there is a real flow of factor services from the, households to the producers. It is in response to it, that, the producers make payments to the households. So,, money flows from producers to the households in terms, of factor payments.
Page 24 :
13, , CBSE Term-II Economics XII, , 15. Why is the flow of income and product called a circular flow?, Ans. It is because of the following reasons that the flow of income and product is called a circular flow, , (i) Corresponding to each real flow to one direction, there is money/income flow from the opposite direction. For example, Corresponding to the flow of factor services (which is a real flow) from household to the producer sector, there is a flow, of factor payments (which is a money flow) from producer to the household sector., (ii) In a two sector economy, receipts of one sector are equal to payments to other sector. In case receipts are less than the, payments (or payments are less than the receipts), circularity is bound to stop at one point or the other., (iii) Activities of production, income generation and expenditure never stop in the economy. They keep chasing one another, in a circular manner., , 16. Describe the four major sectors in an economy according to the macroeconomics point of view., , (NCERT), , Ans. An economy is generally classified into the following four sectors, , (i) Household Sector It is engaged in the consumption of goods and services., (ii) Producing Sector It is engaged in the production of goods and services., (iii) Government Sector It is engaged in such activities which are related to taxation and subsidies as well as consumption, and production., (iv) Rest of the World It is engaged in exports and imports., , 17. Explain the difference between the concept of injections and leakages in context of circular flow of income., Ans., , Injections, , Basis, Meaning, , These are those flow variables which creates a value, addition in the process of circular flow in an economy., , Components Injections include, Consumption expenditure by the government, Investment expenditure by the government, Exports, Cause, , l, , Leakages, These are those flow variables which causes reduction in, the process of production (or the process of income, generation in an economy)., Leakages include, Savings, Taxation, Imports, , l, , l, , l, , l, , l, , l, , This causes positive multiplier effect on the level of, income and employment in the economy., , This causes negative multiplier effect on the level of, income and employment in the economy., , Long Answer (LA) Type Question, 1. Explain the circular flow of income in a two sector economy with the help of a diagram., , Ans. In a two sector economy, there are only two sectors of economic activity, , namely households and firms. Households supply factor services to firms, and firms hire factor services from households. Households spend their, entire income on consumption. Firms sell what is produced to the, households., There are two types of markets in this economy, (i) Product Market Market for goods and services., (ii) Factor Market Market for factors of production., The above figure shows that, (i) Total Production of Goods and Services by firms, = Total Consumption of Goods and Services by Households, (ii) Factor Payments by Firms = Factor Incomes of Households, (iii) Consumption Expenditure of Households = Income of Firms, Thus, Real Flow of Production and Consumption of Firms and, Households = Money Flows of Income and Expenditure of Firms and, Households, , Circular Flow of Income in a Two-sector Economy
Page 25 :
Chapter Test, Multiple Choice Questions, , 1., , Depreciation of fixed capital assets refer to, (a) normal wear and tear, , 2., , (b) foreseen obsolescence, , (b) Both are false, (d) (i) is false, but (ii) is true, , A thousand rupee note is an example of, (a) stock variable, (c) Either stock or flow, , 4., , (b) flow variable, (d) Neither stock nor flow, , Money flows are reciprocal of, (a) monetary flows, , 5., , (d) unforeseen obsolescence, , Which of the following statements is/are correct?, (i) Capital formation is a stock variable., (ii) A car covering a distance of 400 km in 5 hours includes both stock as well as flow variable., Alternatives, (a) Both are true, (c) (i) is true, but (ii) is false, , 3., , (c) Both (a) and (b), , (b) real flows, , (c) circular flows, , (d) inventory flows, , Circular flow of income is based upon which of the following assumptions?, (a) All sectors are self-sufficient and independent, (b) Income generated in one sector is consumed within the same sector, (c) One person’s expenditure is another person’s income, (d) All economies are closed economies, , Short Answer (SA) Type Questions, , 1., 2., , What are the four factors of production and what are the remunerations to each of these called?, Giving reason, classify the following into capital goods and consumer goods., (i) Ice-cream purchased by a consumer., (ii) Plant and machinery of XYZ company., , 3., , Give reason and identify whether the following are final expenditures or intermediate expenditures., (i) Expenditure on maintenance of an office building., (ii) Expenditure on improvement of machine in a factory., , 4., 5., , Distinguish between consumer goods and capital goods., Distinguish between stocks and flows. Give two examples of each., , Long Answer (LA) Type Question, , 1., , Explain the circular flow of income., , Answers, Multiple Choice Questions, 1. (c), , 2. (d), , 3. (a), , 4. (b), , 5. (c), , For Detailed Solutions, Scan the code
Page 26 :
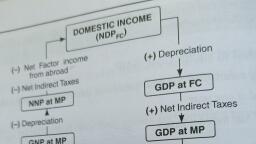
15, , CBSE Term-II Economics XII, , CHAPTER 02, , National Income and, Its Measurement, In this Chapter..., l, , Concept of National Income, , l, , Aggregates Related to National Income, , l, , Methods of Estimating National Income, , Concept of National Income, It is defined as the sum total of factor incomes accruing to, normal residents of a country, within the domestic territory, of a country and from rest of the world, during a period of an, accounting year., Residents, A resident or normal resident is said to be a person or an, institution, who ordinarily resides in a country for a period of, one year or more and whose centre of economic interest lies in, that country., Non-residents, Those citizens, who visit home country for travelling,, recreation, holidays, medical treatment, studies or sports are, known as non-residents of a country., National Income at Current Prices, It is the money value of all final goods and services measured at, current prices., Y=Q×P, Where, Y = National income at current prices, Q = Quantity of goods and services produced during, an accounting year, P = Price of goods and services prevailing, during the accounting year, , National Income at Constant Prices, It is the money value of all final goods and services, measured at constant prices., Y ′ = Q × P′, Where, Y ′ = National Income at constant prices, Q = Quantity of goods and services, produced during an accounting year, P′ = Price of goods and services prevailing during, the base year, , Aggregates Related to, National Income, There are eight aggregates of national income, which are as, follows, 1. Gross Domestic Product at Market Price (GDP MP ) It, is the market value of the final goods and services, produced during a year within the domestic territory, of a country. It includes the value of depreciation., 2. Net Domestic Product at Market Price (NDP MP ) It is, the market value of final goods and services produced, within the domestic territory of a country during a, year, exclusive of depreciation., NDP MP = GDP MP − Depreciation
Page 27 :
CBSE Term-II Economics XII, , 16, 3. Gross National Product at Market Price (GNP MP ), It is the market value of final goods and services produced, in the economy, during a year inclusive of Net Factor, Income from Abroad (NFIA)., , 3. Net Factor Income from Abroad (NFIA) It is defined, as the difference between factor income received from, abroad and the factor income paid to abroad., Components of Net Factor Income from Abroad are, , GNP MP = GDP MP + NFIA, , l, , l, , 4. Net National Product at Market Price (NNP MP ) It is the, market value of the final goods and services produced in, the economy, during an accounting year, exclusive of, depreciation and adjusted for Net Factor Income from, Abroad., NNP MP = GDP MP − Depreciation + NFIA, 5. Gross Domestic Product at Factor Cost (GDP FC ) It is, the sum total of factor incomes generated within the, domestic territory of a country along with consumption of, fixed capital during a year., GDP FC = GDP MP − NIT, , l, , Nominal GDP, It refers to market value of the final goods and services, produced within the domestic territory of a country during, a financial year, as estimated using the current year prices., It is also called GDP at current price or monetary GDP., Real GDP, It refers to market value of the final goods and services, produced within the domestic territory of a country during, a financial year, as estimated using the base year prices. It, is also called GDP at constant price., , 6. Net Domestic Product at Factor Cost (NDP FC ) It is the, sum total of factor incomes generated within the domestic, territory of a country during a year, exclusive of, depreciation., NDP FC = GDP MP − NIT − Depreciation, 7. Gross National Product at Factor Cost (GNP FC ) It is the, sum total of factor incomes earned by normal residents of, a country, inclusive of depreciation during an accounting, year and Net Factor Income from Abroad (NFIA)., GNP FC = GDP FC +NFIA, 8. Net National Product at Factor Cost (NNP FC ) It is the, sum total of factor incomes earned by normal residents of, a country during the period of an accounting year,, exclusive of depreciation., NNP FC = GNP FC – Depreciation, , Real GDP =, , Nominal GDP, × 100, Current Price Index, , GDP and Welfare, GDP may be a good indicator of economic growth but is not, considered a good measure of economic welfare because of, the following three reasons, l, , l, , l, , Distribution of GDP, Non-monetary exchanges, Externalities, , Methods of Estimating, National Income, There are three methods of estimating national income., They are, l, , l, , Some Terms related to National Income, To understand above aggregates of national income, the, following three terms should be understood, 1. Depreciation It refers to the loss in the value of fixed, assets due to their normal wear and tear., 2. Net Indirect Tax (NIT) It is equal to the difference, between Indirect Tax (IT) and Subsidies (S)., Where, indirect taxes add to the factor cost of the product, and subsidies reduce the factor cost of the product to, reach the market price., , Net compensation to employees., Net income from property and entrepreneurship, received by residents of the country., Net retained earnings., , l, , Value Added Method, Income Method, Expenditure Method, , Value Added Method /, Production Method, In value added method, national income is estimated by, adding contribution of each producing enterprise in, production of final goods and services produced in an, accounting year., GDP MP / GVA MP = Value of Output − Intermediate, Consumption
Page 28 :
17, , CBSE Term-II Economics XII, Where, NDP FC = Compensation of Employees, + Operating Surplus + Mixed, Income of Self Employed, Operating Surplus = Rent + Interest + Profit, , Where,, Value of Output = Sales + Change in Stocks Intermediate, Consumption = Purchases + Opening Stock of Raw, Material − Closing Stock of Raw Material, National Income (NNP FC ), = Gross Value Added by all the, Production units within the, Domestic Territory of the Country, − Depreciation − Net Indirect Taxes, +Net Factor Income from Abroad, Net Indirect Taxes = Indirect Tax − Subsidies, Precautions of Value Added Method, , Precautions of Income Method, While using income method, items included or excluded in, calculation of National Income are, l, , l, , l, , While using value added method, items to be included or, excluded in calculation of national income are, l, l, , l, , l, , l, , l, , l, , l, , l, , l, , The value of intermediate goods should not be included., Purchase and sale of second hand goods should be excluded., Imputed value of self-consumed goods should be included., Own account production should be included., Value of self-consumed services should not be included in the, estimation of national income., Commission earned on account of sale and purchase of second, hand goods is included., Imputed rent on the owner occupied house is also taken into the, account., The value added in the government sector is equal to, compensation of employees only. Also, in case of general, government sector, no data of capital consumption is available., That is why, value added is supposed to be equal to net value, added., Double counting should be avoided. For this, we can adopt, either of the following methods, , l, , l, , l, , Income Method, In this method, we take sum total of factor incomes earned by, the normal residents of a country during a year. It is also called, factor payment method., National Income (NNP FC ), = NDP FC + Net Factor Income from Abroad, , Commission paid on the sale and purchase of second hand, goods are to be included., Transfer earnings like old age pensions, unemployment, allowances, scholarships, pocket expenses, etc should not be, included., Income in terms of windfall gains should not be included., Imputed rent of owner occupied houses is to be treated, along with rent as a component of factor incomes., Income tax is paid out of compensation of employees. It, should not be separately added in the estimation of national, income., Brokerage on the sale/purchase of shares and bonds is to be, included., , Expenditure Method, In this method, national income is measured in terms of, expenditure on the purchase of final goods and services, produced in the economy during an accounting year., National Income (NNP FC ), = GDP MP − Net Indirect Taxes − Depreciation, + Net Factor Income from Abroad, , 1. Final Output Method This method takes into account, the value of only final goods and services in the estimation, of GDP. Intermediate goods are not to be considered., 2. Value Added Method This method takes into account, the sum total of value added by all the producing units, within the domestic territory, while computing national, income., , Income from illegal activities like smuggling, theft,, gambling, etc should not be included., , Where,, GDP MP = Private Final Consumption, Expenditure + Government Final, Consumption Expenditure +, Investment Expenditure + Net Exports, Precautions of Expenditure Method, While using expenditure method, items included or, excluded in calculation of national income are, l, , l, , Only final expenditure is to be taken into account to avoid, error of double counting., Expenditure on second hand goods is not to be included,, because value of second hand goods has already been, accounted for during the year of their production.
Page 29 :
CBSE Term-II Economics XII, , 18, l, , l, , l, , Expenditure on shares and bonds is not to be included in total, expenditure, as these are mere paper claims and are not related, to the production of final goods and services., Expenditure on transfer payments by the government is not to, be included., Imputed value/estimated value of expenditure on goods, produced for self-consumption should be taken into account, as, these goods are reflected in the estimation of GDP., , Terms related to National Income Methods, 1. Primary Sector It includes production of goods by, exploiting natural resources, i.e., agriculture, forestry,, logging, etc., 2. Secondary Sector It includes all those units which, produce commodities by transforming one type of, commodity into other type of commodity, i.e.,, manufacturing, electricity, etc., , 3. Tertiary Sector It is that sector in which entrepreneurs, provide services. It includes units like educational,, medical, transport, etc., 4. Factor Payments These are the payments made to, scarce resources or the factors of production in return, for productive services., 5. Factor Incomes These are the incomes received by the, owners of factors of production for rendering their, factor services to the producers., 6. Transfer Incomes Incomes received by households,, production units and non-profit making institutions, from government and other sources without rendering, any services are known as transfer incomes., 7. Transfer Payments It is a redistribution of income in, the market system. Transfer payments do not add to the, current flow of goods and services., , Solved Examples, (iv) GDPMP = GNPMP – Net Factor Income from Abroad, , Example 1., S.No., , Contents, , (i), , GNPMP, , (ii), , Depreciation or Consumption of Fixed, Capital, , ` (in crore), 15,000, , = 15, 000 − 650 = ` 14, 350 crore, , Example 2. Calculate national income from the, following data., , 1,000, , S.No., , Contents, , ` (in lakh), , (iii) Indirect Taxes, , 500, , (i), , Sales, , 800, , (iv) Subsidies, , 150, , (ii), , (v), , 650, , Purchase of Raw Materials from Domestic, Market, , 400, , Net Factor Income from Abroad, , On the basis of the above information, calculate, (i) NNPMP, (iii) NDPFC, Ans., , (ii) NNPFC, (iv) GDPMP, , (i) NNPMP = GNPMP – Depreciation, = 15, 000 − 1, 000, = ` 14, 000 crore, (ii) NNPFC = GNPMP – Depreciation – Net Indirect Taxes, = 15, 000 − 1, 000 − ( 500 − 150), = 14, 000 − 350, = ` 13, 650 crore, [Q NIT = Indirect Taxes – Subsidies], (iii) NDPFC = GNPMP – Depreciation – Net Factor, Income from Abroad – Net Indirect Taxes, = 15, 000 − 1, 000 − 650 − ( 500 − 150), = ` 13, 000 crore, , (iii) Import of Raw Material, , 100, , (iv), , Subsidies, , 30, , (v), , Consumption of Fixed Capital, , 40, , (vi), , Change in Stock, , 50, , (vii) Rent, , 70, , (viii) Net Factor Income from Abroad, , 10, , Ans. National Income = Sales + Change in Stock − (Purchase of, , Raw Material from Domestic Market +, Import of Raw Material) −, Consumption of Fixed Capital, + Subsidies + NFIA, = 800 + 50 − ( 400 + 100 ) − 40 + 30 +10, = ( 880 − 540 + 10 ) = ` 350 lakh
Page 30 :
19, , CBSE Term-II Economics XII, , Example 3. Calculate net domestic product at factor cost, , Example 4. Calculate national income by the, , by income method., S.No., , expenditure method., Contents, , ` (in crore), , (i), , Dividend, , 60, , (ii), , Wages and Salaries, , (iii), , Social Security Contribution by Employers, , 100, , (iv), , Rent, , 300, , (v), , Corporation Tax, , 30, , (vi), , Retained Earnings of Private Corporations, , 10, , (vii), , Interest, , 2,000, , 300, , S.No., , Contents, , (i), , Government Final Consumption, Expenditure, , (ii), , Private Final Consumption Expenditure, , Net Domestic Product at Factor Cost (NDPFC ), = Wages and Salaries + Social Security, Contribution by Employers + Corporation Tax, + Retained Earnings of Private Corporations, + Dividend + Rent + Interest, = 2, 000 + 100 + 30 + 10 + 60 + 300 + 300, = ` 2,800 crore, , 150, 750, , (iii) Consumption of Fixed Capital, , 150, , (iv), , Net Indirect Taxes, , 120, , (v), , Net Factor Income from Abroad, , (vi), , Net Domestic Fixed Capital Formation, , (vii) Change in Stocks, (viii) Net Imports, , Ans. By income method, , ` (in crore), , 20, 220, (–) 20, 50, , Ans. By expenditure method, , National Income (NNPFC), = Private Final Consumption Expenditure + Government, Final Consumption Expenditure + Net Domestic, Fixed Capital Formation + Change in Stocks − Net, Imports − Net Indirect Taxes + Net Factor Income, from Abroad, = 750 + 150 + 220 + ( − 20 ) − 50 − 120 + 20, = 1,140 − 190 = ` 950 crore
Page 31 :
Chapter, Practice, PART 1, Objective Questions, l, , Multiple Choice Questions, 1. Which of the following is an example of normal, , (a) Foreign worker working in WHO located in India, (b) The German working as director in IMD office, located in India, (c) Ambassador in India from the rest of the world, (d) Ambassador of India in rest of the world, Ans. (d) Ambassador of India in rest of the world, , 2. Which of the given pair is incorrectly matched?, Column II, , Column I, A. Land, , (i), , Rent, , B. Labour, , (ii), , Wages and salaries, , C. Capital, , (iii) Interest, , D. Entrepreneur, , (iv) Dividend, , Codes, (b) B – (ii), , of national income?, (a) Expenses on electricity by a factory, (b) Gifts from abroad, (c) Free services by the government, (d) Financial help to earthquake victims, Ans. (c) Free services by the government, , 6. Which of the following statements is/are correct?, , residents of India?, , (a) A – (i), , 5. Which of the following is included in the estimation, , (c) C – (iii), , (d) D – (iv), , Ans. (d) Entrepreneur get profit as a compensation for its factor, , services. Dividend is paid to the shareholders for their, contribution in the company’s capital as an incentive., , 3. Factor payment received by the households for, rendering their services as employees of the, producing unit is called, (a) Compensation of employees, (b) Rent, (c) Interest, (d) Profit, Ans. (a) Compensation of employees, , 4. Operating Surplus =, (a) Compensation of Employees + Rent + Interest +, Profit, (b) Rent + Interest + Profit, (c) Compensation of Employees + Mixed Income of, Self-employed, (d) Compensation of Employees + Rent + Interest +, Profit +Mixed Income of Self-employed, Ans. (b) Rent + Interest + Profit, , (i) Value added and value of output are identical, concepts., (ii) Sum total of value added by all the producing units, within the domestic territory of the country is equal, to national product., Alternatives, (a) Both are true, (b) Both are false, (c) (i) is true, but (ii) is false, (d) (i) is false, but (ii) is true, Ans. (b) Value of output refers to the market value of the goods, produced while value added refers to the market value of, the goods produced minus the market value of the goods, used as inputs/raw material in the process of production., Sum total of value added by all the producing units within, the domestic territory of the country is equal to domestic, product., , 7. Which of the following is not included in the, estimation of national income?, (a) Brokerage on sale of bonds, (b) Imputed value of production for self-consumption, (c) Leisure-time activities, (d) Employer’s contribution to provident fund, Ans. (c) No value is generated by enjoying leisure and hence not, included in the estimation of national income., , 8. Inventory investment is used as a component to, calculate national income in which of the following, methods?, (a) Product method and income method, (b) Income method and expenditure method, (c) Product method and expenditure method, (d) Product method, income method and expenditure method, Ans. (c) Inventory investment or change in stock is used in, both value added (Product) method and expenditure, method while calculating national income.
Page 32 :
21, , CBSE Term-II Economics XII, , 9. National income is the sum of factor incomes, accruing to, , (CBSE 2016), , (a) nationals, (b) economic territory, (c) residents, (d) Both residents and non-residents, Ans. (c) residents, , 15. Let us assume that the GDP of some country was, , 10. Combined factor income, which can’t be separated, into various income components is known as ……… ., (a) Mixed income of self-employed, (b) Compensation of employees, (c) Deferred income, (d) Any of the above, Ans.(a) Mixed income of self-employed, , currency becomes cheaper, the effect on national, income is likely to be, (CBSE 2015), (a) positive, (b) negative, (c) Both positive and negative, (d) No effect, Ans. (d) Rise of fall in the prices of foreign currency has no, direct impact on national income of a country. Exchange, rate changes on a daily basis and several times in a day. It, does not mean that national income would change, accordingly., , 12. If gross domestic capital formation is ` 3,000, net, domestic fixed capital formation is ` 2,000 and, inventory investment is ` 150, what will be the value, of consumption of fixed capital?, (a) ` 1,000, (b) ` 850, (c) ` 150, (d) Can’t be determined, Ans. (b) Consumption of Fixed Capital = Gross Domestic Capital, Formation – (Net, Domestic Fixed Capital, Formation + Inventory, investment), = 3,000 – (2,000+150), = ` 850, , 13. Which of the following is not a ‘factor payment’?, (CBSE 2020), , (a) Free uniform to defence personnel, (b) Salaries to members of Parliament, (c) Rent paid to the owner of the building, (d) Scholarship given to the students, Ans. (d) Scholarship given to the students, , 14. If Real GDP is ` 200 and Price Index (with base =, (a) ` 33, (c) ` 200, , (b) ` 220, (d) ` 100, Nominal GDP, Ans. (b) Real GDP =, × 100, Price Index, , ` 100 at current prices in 2012-13 and that was, ` 90 in 2011-12; and that the GDP at constant, 2004-05 prices was ` 59 in 2012-13 and that was, ` 56.1 in 2011-12, then in GDP of 2011-12 at, , 2012-13 (constant) prices would be, (a) ` 59.1, (b) ` 90, (c) ` 95.08, (d) ` 100, Ans. (c) GDP of 2011-12 at 2012 `13 (constant) prices would, , 11. Other things remaining the same, when foreign, , 100) is 110, calculate Nominal GDP., , Re al GDP × Pr ice Index, 100, 200 × 110, =, = ` 220, 100, , Nominal GDP =, , (CBSE 2015), , be, GDP at Constant Prices of 2011 − 21, =, × 100, GDP at Costant Prices of 2021 − 13, 56.1 × 100, =, = 95 .08, 59, , 16. Which of the given statement is incorrect?, (CBSE 2020), , (a) GDPMP = GDPFC + NIT, (b) NNPMP = NNPFC, (c) GNPMP = GDPMP + NFIA, (d) NNPFC = National Income, Ans. (b) Market price includes the impact of indirect taxes, and subsidies, i.e. indirect taxes raise the market price,, but subsidies tend to lower it while factor cost refers to, the cost of factors of production, independent of net, indirect taxes (Indirect Taxes – Subsidies)., , 17. If in an economy, all production is undertaken by, firms and the recorded sales of all firms in a year are, less than their respective recorded costs, then, which of the following statements is necessarily true?, (a) At least some firms must have made accounting errors, (b) The economy’s GDP of that year was negative, (c) The total purchases of intermediates by firms were, more than their total sales, (d) None of the above, Ans. (c) If an economy’s production, costs exceed its sales, then it implies that the intermediate cost exceed the, firm’s total sales., , 18. Given the following data for an economy, Gross domestic product at market prices ` 20,000, Gross domestic capital formation ` 5,000, Depreciation ` 4,000, Net exports (–) ` 2,000, Net factor incomes from abroad ` 5,000, The economy’s net domestic capital formation is, (a) ` 1,000, (b) ` 5,000, (c) ` 3,000, (d) (–) ` 1,000, Ans. (a) Net Domestic Capital Formation, = Gross Domestic Capital Formation –Depreciation, = 5,000 – 4,000 = ` 1,000
Page 33 :
CBSE Term-II Economics XII, , 22, 19. In which of the following cases would the purchase of, rice be included while calculating the GDP of India, from the expenditure side?, (a) A resident Indian purchases rice to make a dosa which, he sells to his neighbour. He then pockets the money, received., (b) A resident Indian purchases rice to make dosa which he, sells to his neighbour. He donates the money received to, a charity., (c) A foreign citizen visiting Indian purchases rice to make a, dosa which he sells to another foreign citizen visiting, India., (d) A non-resident Indian visiting India purchases rice, goes, back to his country of residence, makes a dosa and then, sells it to his neighbour., Ans. (d) The expenditure of a non-resident Indian on purchase of, rice would be included in the calculation of GDP as a, component of net exports., , 20. With a positive externality, (a) there is under consumption in the free market., (b) there is over consumption in the free market., (c) the government may tax to decrease production., (d) society could be made better-off if less was produced., Ans. (b) Positive externality refers to the benefits enjoyed by a, firm from external factors. Due to positive externality, there, is over consumption in free market as it might lower the, market price., l, , Assertion-Reasoning MCQs, Direction (Q. Nos. 1 to 7) There are two statements, marked as Assertion (A) and Reason (R). Read the, statements choose the appropriate option from the, options given below., (a) Both Assertion (A) and Reason (R) are true and Reason, (R) is the correct explanation of Assertion (A), (b) Both Assertion (A) and Reason (R) are true, but Reason, (R) is not the correct explanation of Assertion (A), (c) Assertion (A) is true, but Reason (R) is false, (d) Assertion (A) is false, but Reason (R) is true, , 1. Assertion (A) Money received from the sale of second, hand car will be considered while estimating national, income., Reason (R) Their value is already included and it, does not contribute to the current flow of goods and, services., Ans. (d) Money received from the sale of second hand car will, , not be considered while estimating national income as the, value of second hand goods has already been accounted, during the year of their production (when these were, initially produced and purchased by the final users)., , 2. Assertion (A) Payment of uniforms for nurses by a, hospital is not included in the estimation of national, income., , Reason (R) Uniforms are provided by the hospital, at the time of work. It is to be treated as an, intermediate consumption., Ans. (a) Both Assertion (A) and Reason (R) are true and, , Reason (R) is the correct explanation of Assertion (A), , 3. Assertion (A) Financial help received by the flood, victims should not be included while estimating, national income., Reason (R) Financial help is a transfer payment, and should not be included., Ans. (a) Both Assertion (A) and Reason (R) are true and, , Reason (R) is the correct explanation of Assertion (A)., , 4. Assertion (A) Real GDP shows change in the level, of economic activity and facilitates inter-regional, and international comparison., Reason (R) It is an inflation adjusted index and, account for an increase in the level of production, in response to the price changes., Ans. (a) Both Assertion (A) and Reason (R) are true and, , Reason (R) is the correct explanation of Assertion (A), , 5. Assertion (A) Public goods possess the characteristics of non-rivalry and non-excludability., Reason (R) Non-rival means consumption by one, person does not reduces consumption for, another person whereas non-excludability implies, that no one can be excluded in terms of, benefitting from the consumption of public, goods., Ans. (a) Both Assertion (A) and Reason (R) are true and, , Reason (R) is the correct explanation of Assertion (A), , 6. Assertion (A) Imputed value of owner-occupied, lands are a part of both domestic income and, national income., Reason (R) Factors of production are bound to, give its services regardless of the fact that it, is giving its services to the owner or an, outsider., Ans. (a) Factor of production always gives its services, , regardless of its owner. So, while calculating national, income we should include its market value to get actual, estimation of production in the economy., , 7. Assertion (A) GDP as an index of welfare may, underestimate or overestimate the welfare., Reason (R) It does not consider the non-monetary, exchanges and does not take into consideration, the positive or negative aspects associated with an, economic activity., Ans. (a) Both Assertion (A) and Reason (R) are true and, , Reason (R) is the correct explanation of Assertion (A)
Page 34 :
23, , CBSE Term-II Economics XII, , l, , Case Based MCQs, 1. Direction Read the following text and answer, question no. (i) to (vi) on the basis of the same., “A multiplicity of manufacturing activities will make a, kingdom or city abound in money when they are, diverse and produce things necessary or useful or, pleasing to people in quantities that exceed the needs, of the country. There are four reasons why this is so., First, there is greater certainty in manufacturing, activity, for a manufacturer is more certain to earn, from his work than a farmer or other person who tills, the soil or deals in his agricultural ‘produce’, for the, earnings of these people depend not just on human, labour but on the weather-since the land sometimes, needs rain and sometimes sun–as well as other, conditions., And if these conditions are not forthcoming or the, weather is bad, their work is wasted and instead of, making money they lose it. But a manufacturer’s, earnings are always certain, provided that he keeps, working., Second, in manufacturing activities it is possible to, achieve a multiplication of products and therefore of, earnings. The same cannot be done with agricultural, produce, which is not subject to multiplication. If a, given piece of land is only large enough to sow a, hundred (bushels) of wheat, it is impossible to sow a, hundred and fifty there. In manufacturing, by, contrast production can be multiplied not merely, twofold but a hundredfold and at a proportionately, lower cost., Third, the sale of manufactured products is more, certain than that of agricultural produce and this, certainty of sale means a greater certainty of profit., For it is difficult to preserve agricultural produce, for, a long time without its deteriorating, so it is risky to, export from country to another one far away and so it, is also risky to preserve it for the future, should it not, be sold immediately, manufactured products, on the, other hand, can easily be preserved even for long, periods, so they can easily be exported to far off, lands., And since navigation–the only art in which the, moderns surpass the ancients–has been so greatly, facilitated that trade is carried on not merely between, East and West, North and South, but even between, one hemisphere and the other and goods can be, easily transported from one to the other who will, deny that the sale of manufactured products is more, certain and more profitable than that of agricultural, produce?, , Fourth and last, manufactured goods generally, yield much higher earnings than agricultural, produce… For all these reasons the accident of a, multiplicity of manufacturing activities is more, important than that of domestic agricultural, surplus.”, Source (From Antonio Serra –A Short Treatise on the, Wealth and Poverty of Nations, 1613), , (i) There is greater certainty in manufacturing, activities than in agricultural because, (a) it is subject to increasing returns, (b) it relies only on human labour, (c) the manufacturing worker must always keep working, (d) manufacturing products are diverse, Ans. (b) it relies only on human labour, , (ii) Manufacturing offers the possibility of more likely, profit than agriculture because, (a) the variety of manufacturing products is greater than, the variety of agricultural produce, (b) it used to be risky to export from one country to, another country that is far away, (c) both storage and transport are easier for, manufactured goods, (d) manufacturing products are diverse, Ans. (a) the variety of manufacturing products is greater than, the variety of agricultural produce, , (iii) Serra believed that, (a) agriculture and manufacturing are both subject to, increasing returns, (b) only manufacturing is subject to increasing returns, (c) neither activity is subject to increasing returns no, activity, (d) increasing returns are not relevant in a discussion of, economic activity, Ans. (b) only manufacturing is subject to increasing returns, , (iv) The significance of advances in navigation for, Serra is that, (a) it enables improved transport of agricultural produce, to make up for losses when the weather is bad, (b) it proves that the moderns have surpassed the ancients, (c) it gets rid of the difficulty of preserving goods for the, future, (d) it makes profits from manufacturing more certain by, expanding potential markets, Ans. (d) it makes profits from manufacturing more certain by, expanding potential markets, , (v) According to Serra, manufacturing, (a) generates higher value added than agriculture, (b) is desirable only when the quantities produced, exceed the needs of the country, (c) is always in a multiplicity that exceeds the, agricultural surplus, (d) always makes a kingdom or a city abound in money, Ans. (a) generates higher value added than agriculture
Page 35 :
24, (vi) Assertion (A) There exists a unidirectional, relationship between certainty of sales and certainty, of profits., Reason (R) Higher revenues are often guaranteed, from sale of manufactured goods than agricultural, produce., Alternatives, (a) Both Assertion (A) and Reason (R) are true and Reason, (R) is the correct explanation of Assertion (A)., (b) Both Assertion (A) and Reason (R) are true, but Reason, (R) is not the correct explanation of Assertion (A)., (c) Assertion (A) is false, but Reason (R) is true, (d) Both the statements are false, Ans. (b) Both Assertion (A) and Reason (R) are true, but Reason, (R) is not the correct explanation of Assertion (A)., , 2. Direction Read the following text and answer, question no. (i) to (vi) on the basis of the same., Consumption, production and investment decisions, of individuals, households and firms often affect, people not directly involved in the transactions., Sometimes these indirect effects are tiny. But when, they are large they can become problematic—what, economists call externalities. Externalities are among, the main reasons governments intervene in the, economic sphere. Most externalities fall into the, category of so-called technical externalities; i.e., the, indirect effects have an impact on the consumption, and production opportunities of others, but the price, of the product does not take those externalities into, account. As a result, there are differences between, private returns or costs and the returns or costs to, society as a whole., Externalities could be either positive or negative., There is no valuation of it in the estimation of GDP., Its impact (positive or negative) is not accounted in, the index of social welfare in terms of GDP. To that, extent, GDP as an index of welfare is not an, appropriate index. It is either underestimated or, overestimated the level of welfare., (i) An externality can be defined as, (a) good or bad impact of an activity for which the other, person is fully compensated, (b) production or consumption choices of one entity enters, the production or utility function of other entity without, that entity’s approval, (c) positive or negative impact of an activity, solely on the, concerned individual, (d) All of the above, Ans. (b) production or consumption choices of one entity enters, the production or utility function of other entity without, that entity’s approval, , (ii) Smoke emitted by a chemical factory and causing air, pollution is an example of, , CBSE Term-II Economics XII, (a) positive externalities, (c) Either of the two, Ans. (b) negative externalities, , (b) negative externalities, (d) Neither of the two, , (iii) Welfare of the people in an economy is measured, in terms of ……… ., (a) availability of national income, (b) availability of goods and services per person, (c) overall price level and degree of profit maximisation, (d) overall price level in an economy, Ans. (b) availability of goods and services per person, , (iv) With every increase in the level of GDP, social, welfare definitely increases in an economy., The given statement is, (a) True, if increase in GDP is associated with, disparities in the distribution of income, (b) True, if increase in GDP is associated with skewed, distribution of income, (c) False, if increase in GDP is associated with, disparities in the distribution of income, (d) False, if increase in GDP is associated with, normality in distribution of income, Ans. (c) False, if increase in GDP is associated with, disparities in the distribution of income, , (v) Assertion (A) GDP cannot be considered as an, appropriate index of welfare., Reason (R) Non-monetary transactions,, externalities, composition and distribution of, GDP are some of the reasons which makes it an, inappropriate index of welfare., Alternatives, (a) Both Assertion (A) and Reason (R) are true and, Reason (R) is the correct explanation of Assertion (A), (b) Both Assertion (A) and Reason (R) are true, but Reason, (R) is not the correct explanation of Assertion (A), (c) Assertion (A) is true, but Reason (R) is false, (d) Assertion (A) is false, but Reason (R) is true, Ans. (a) Both Assertion (A) and Reason (R) are true and, Reason (R) is the correct explanation of Assertion (A), , (vi) Assertion (A) Mass vaccination, awareness about, sanitisation and promoting cleanliness entails, positive externalities., Reason (R) These often accounts as part of, economic development but does not count for, economic growth., Alternatives, (a) Both Assertion (A) and Reason (R) are true and Reason, (R) is the correct explanation of Assertion (A)., (b) Both Assertion (A) and Reason (R) are true, but Reason, (R) is not the correct explanation of Assertion (A)., (c) Assertion (A) is false, but Reason (R) is true, (d) Both the statements are false, Ans. (b) Economic growth considers only an increase in the, level of production but development means a sustained, increase in GDP along with an improvement in social,, economic and institutional sphere.
Page 36 :
25, , CBSE Term-II Economics XII, , 3. Direction Read the following text and answer, , (iv) Countries of ............. are rich in natural resources., , question no. (i) to (vi) on the basis of the same., It is not that countries which are endowed with a, bounty of natural wealth-minerals or forests or the, most fertile lands are naturally the countries with, high national income. In fact, the resource rich Africa, and Latin America have some of the countries with, lowest national income in the world, whereas many, countries with high national income have scarcely, any natural wealth., There was a time when possession of natural, resources was the most important consideration but, even then the resources have to be transformed, through a production process., The economic well-being of a country thus does not, necessarily depend on the mere possession of, resources; the point is how these resources are used, in generating a flow of production and how, as a, consequence, income and wealth are generated from, that process., (i) GDP cannot be considered as a good indicator of, development due to which of the following reasons?, , (a) Africa, (b) Latin America, (c) Both (a) and (b), (d) Asia, Ans. (c) Due the geographical location, these two countries, possess resources naturally. However, growth of a, nation does not depend upon the possession of, resources but the usage of the same., , (a) It ignores non-tradable goods, (b)It gives no information regarding the distribution of, income, (c) It ignores the side-effects of undertaking production, activities, (d)All of the above, Ans. (d) All of the above, , (ii) Assertion (A) The economic well-being of a country, doesn’t directly depend upon the possession of, natural resources., Reason (R) Distribution of income generated in the, growth process is an important indicator of countries, level of development., Alternatives, (a) Both Assertion (A) and Reason (R) are true and Reason, (R) is the correct explanation of Assertion (A), (b) Both Assertion (A) and Reason (R) are true, but Reason, (R) is not the correct explanation of Assertion (A), (c) Assertion (A) is true, but Reason (R) is false, (d) Assertion (A) is false, but Reason (R) is true, Ans. (a) Availability of resources in any country doesn’t ensure, that the benefit of growth achieved will trickle down to the, masses. Ensuring equitable distribution of the available, resources is the responsibility of the government., , (iii) Possession of natural resources and growth of, national income are ……… related., (a) directly, (b) inversely, (c) constantly, (d) Can’t comment, Ans. (d) In general, we cannot fix a relationship between natural, resources and national income. It majorly depends upon, how the resources are being utilised in an economy., , (v) Growth and development of a country are ………, related., (a) positively, (b) negatively, (c) Not related at all, (d) None of these, Ans. (a) In general, growth is the first step towards achieving, development. Development is not possible without, growth but the vice-versa is possible, , (vi) Which of the following statements is/are correct?, (i) Inequitable distribution of resources is the, inequality in the social conditions of daily living, shaped by deeper social structures and processes., (ii) The inequality is systematic, produced by social, norms, policies and practises that tolerate or, promote unfair distribution of power, wealth and, other necessary social resources., , Alternatives, (a) Both are true, (b) Both are false, (c) Only (i) is true, but (ii) is false, (d) Only (ii) is true, but (i) is false, Ans. (a) Both are true, , PART 2, Subjective Questions, l, , Short Answer (SA) Type Questions, 1. ‘Domestic services (household services), performed by a woman are not considered as an, economic activity. Defend or refute the given, statement with valid reason., (CBSE 2020), , Ans. The given statement is refuted on the basis of the, , following reasons, (i) Domestic services are performed by woman out of, love and affection., (ii) Such services do not add to the flow of goods and, services in the economy., (iii) These services are for self-consumption, not for, economy., , 2. ‘Subsidies to the producers, should be treated as, transfer payments’. Defend or refute the given, statement with valid reason., (CBSE 2020)
Page 37 :
CBSE Term-II Economics XII, , 26, Ans. This statement is refuted because subsidies given to the, , producers should not be treated as transfer payments., Subsidies are given to reduce the market price of socially, desirable goods such as fertilisers, LPG gas, etc. So, that, they can be afforded by the poor section of society., Transfer payments, on the other hand, are given to fulfill, social objectives. Examples of transfer payments are old age, pension, unemployment allowance, etc., Also, transfer payments are not taken into account while, computing the GDP of the country, but subsidies are, considered in the computation of GDP., , 3. Suppose the GDP at market price of a country in a, particular year was ` 1,100 crore. Net factor income, from abroad was ` 100 crore. The value of Indirect, taxes – Subsidies was ` 150 crore and national, income was ` 850 crore. Calculate the aggregate, value of depreciation., (NCERT), Ans. NNPMP = NNPFC + NIT, , 4. GNP is the estimated value of the total worth of, production and services earned by the normal, residents of a country. But to find out NNP, GNP, deducts depreciation, why should we deduct, depreciation from GNP?, Ans. The productive power of physical capital stock of a country, , diminishes gradually because of the wear and tear in the, process of production. When the machine becomes totally, unproductive, it has to be replaced by new machine. So, a, sum of money is set aside every year into depreciation, account and new machine can be purchased by utilising, this accumulated sum., So, depreciation is deducted from GNP in order to get, more accurate measure of the sustainable production of, goods and services in a country in a given year., , 5. Compute the values of x a and x b on the basis of given, data pertaining to an economy., Final consumption expenditure, Gross fixed capital formation, Change in stocks, Exports of goods and services, , Year 1 ( ` ) Year 2 ( ` ), 33,53,748 38,64,617, x a 18,21,099, 2,55,126, , Gross Fixed Capital Formation, =GDPMP – (Final Consumption Expenditure +, Change in Stocks + Net Exports), = 50,50,345 − 33,53,748 – 2,55,126 − (10,18,907, − 12,19,109), = 16,41,673, Computing the value of xb, Gross Domestic Product at Market Price, = Final Consumption Expenditure + Gross Fixed, Capital Formation + Change in Stock + Net Exports, (Exports – Imports), = 38,46,417 + 18,21,099 + 1,79,004 + (13,28,765 –, 16,14,040), = 55,61,245, , 6. Calculate net domestic product at factor cost., S.No., , = 850 + 150 = ` 1,000 crore, GNPMP = NFIA + GDPMP, = 100 + 1,100, = ` 1,200 crore, Depreciation = GNPMP − NNPMP, = 1,200 – 1,000 = 200 crore, Therefore, depreciation = ` 200 crore, , Year/Item, , Ans. Computing the value of xa, , 1,79,004, , 10,18,907 13,28,765, , Imports of goods and services, , 12,19,109 16,14,040, , Gross domestic product at, market prices, , 50,50,345, , xb, , Contents, , ` (in lakh), , (i), , Interest, , 700, , (ii), , Compensation of Employees, , (iii), , Net Indirect Taxes, , 500, , (iv), , Rent and Profit, , 700, , (v), , Transfer Payments by Government, , 3,000, , 10, (CBSE 2020), , Ans. Net Domestic Product at Factor Cost, , (NDPFC ) = Compensation of Employees + Interest, + Rent and Profit, = 3, 000 + 700 + 700, = ` 4, 400 crore, , 7. In a single day Raju, the barber collects ` 500, from haircuts; over this day, his equipment, depreciates in value by ` 50. Of the remaining, ` 450, Raju pays sales tax worth ` 30, takes home, ` 200 and retains ` 220 for improvement and, buying of new equipment. He further pays ` 20 as, income tax from his income. Based on this, information, complete Raju’s contribution to the, following measures of income, (i) Gross domestic product, (ii) NNP at market, price and (iii) NNP at factor cost., Ans. Assuming intermediate consumption= 0 and, , Change in stock = 0, (i) GVA MP = ` 500 (Raju’s contribution to GDP), (ii) NVA MP = GVA MP – Depreciation, = 500 – 50, = ` 450 (Raju’s contribution to NNPMP ), (iii) NVA FC = NVA MP – Net Indirect Taxes, = 450 – 30, = ` 420 (Raju’s contribution to NNPFC)
Page 38 :
27, , CBSE Term-II Economics XII, , 8. Calculate Net Value Added at Factor Cost ( NVA FC ), , (ii) Rent received by an Indian resident from Russian, embassy in India is not a part of domestic factor, income of India because Russian embassy in India is, not a part of domestic territory of India., (iii) Profits earned by a branch of State Bank of India in, England is not a part of domestic factor income of, India because the branch of SBI in England is not a, part of domestic territory of India., , from the following data., S.No., (i), , Contents, , ` (in crores), , Value of Output, , 800, 200, , (ii), , Intermediate Consumption, , (iii), , Indirect Taxes, , 30, , (iv), , Depreciation, , 20, , (v), , Subsidies, , 50, , (vi), , Purchase of Machinery, , 50, , 11. Calculate Gross Value Added at Market Price, (GVAMP) from the following data., S.No., , (CBSE 2020), Ans. GVA MP = Value of Output − Intermediate Consumption, , = 800 − 200 = ` 600 crores, NVA FC = GVA MP − Depreciation − Indirect Tax + Subsidies, NVA FC = 600 − 20 − 30 + 50 = ` 600 crores, , 9. How will the following be treated while estimating, national income of India? Give reasons., (i) Value of bonus shares received by shareholders of a, company., (ii) Capital gains to Indian residents from sale of shares of, a foreign company., (iii) Fees received from students., Ans., , (i) Value of bonus shares received by shareholders of a, company is not included in the estimation of national, income of India because these are just financial, transactions (leading to change of ownership of financial, assets), not contributing to the flow of goods and, services in the economy., (ii) Capital gains to Indian residents from sale of shares of a, foreign company is not included in the national income, of India because it is a part of financial transactions, corresponding to which there is no flow of goods and, services in the economy., (iii) From the students’ point of view, expenditure on fees is, to be treated as part of private final consumption, expenditure. Accordingly, it is to be included in the, estimation of national income of India when expenditure, method is used to estimate it. However, from the, schools’ point of view, fee received is just a revenue, from the sale of services., , (i) Compensation of employees to the residents of Japan, working in Indian embassy in Japan., (ii) Rent received by an Indian resident from Russian, embassy in India., (iii) Profits earned by a branch of State Bank of India in, England., Ans., , (i) Compensation of employees to the residents of Japan, working in Indian embassy in Japan is a part of factor, income of India because Indian embassy in Japan is a, part of domestic territory of India., , Depreciation, , (ii), , Domestic Sales, , (iii), , Change in Stock, , (iv), , Exports, , (v), , Single use Producer Goods, , (vi), , Net Indirect Taxes, , (in ` lakhs), 20, 200, (–) 10, 10, 120, 20, , (CBSE 2020), Ans. Gross Value Added at Market Price (GVAMP ), , = Value of Output − Intermediate Consumption, Value of Output = Sales + Change in Stock, Value of Output = ( 200 + 10 ) + ( − ) 10, = 210 − 10 = ` 200, GVAMP = 200 − 120, GVAMP = ` 80 lakhs, , 12. Calculate intermediate consumption from the, following data., S.No., , (CBSE 2019), (` in crores), , Contents, , (i), , Gross Value of Output, , 300, 100, , (ii), , Net Value Added at Factor Cost (NVA FC), , (iii), , Subsidies, , 15, , (iv), , Depreciation, , 30, , Ans. NVA FC = ` 100 crores (given), , GVA MP = NVA FC + Depreciation – Subsidy, GVA MP = ( 100 + 30 − 15 ) = ` 115 crores, GVA MP = Value of Output − Intermediate Consumption, 115 = 300 − Intermediate Consumption, Intermediate Consumption = 300 − 115 crores, = ` 185 crores, , 10. Which of the following factor incomes be included, in domestic factor income of India? Give reasons for, your answer., , Contents, , (i), , 13. Giving reason state how the following are treated, in estimation of national income., (i) Payment of interest by banks to its depositors., (ii) Expenditure on old age pensions by government., (iii) Expenditure on engine oil by car service station., (CBSE (C) 2017), Ans., , (i) Payment of interests by bank to its depositors should, be included in estimation of national income as it will, be treated as factor income.
Page 39 :
CBSE Term-II Economics XII, , 28, (ii) Expenditure on old age pensions by government is not a, part of national income as it is a transfer payment., (iii) Expenditure on engine oil by car service station is not a, part of national income as it is an intermediate cost., , 14. Find net value added at factor cost., S.No., , Contents, , (i), , Durable use Producer Goods with a, Life Span of 10 Years, , ` (in lakhs), 10, , (ii), , Single use Producer Goods, , (iii), , Sales, , 5, , (iv), , Unsold Output Produced During the, Year, , 2, , (v), , Taxes on Production, , 1, , 20, , (CBSE 2016), Ans. Net Value Added at Factor Cost ( NVA FC ), , = Sales + Unsold Output Produced during the, Year − Single use Producer Goods −, Depreciation on Durable use Producer, Goods − Taxes on Production, = 20 + 2 − 5 − 1 − 1, = ` 15 lakhs, Note Depreciation =, , Value of Durable Goods 10, =, Life Span, 10, , = ` 1 lakh, , 15., , (i) Calculate the value of ‘Change in Stock’ from the, following data., S.No., , Contents, , GDP increases. Explain., Ans. Increase in GDP may not cause increase in welfare in a, , situation when distribution of income becomes skewed, (unequal). If, along with an increase in GDP, the, percentage of population below poverty line happens to, increase, it implies a situation of deprivation on one, hand and concentration of economic power on the, other. It is a situation when a rising percentage of GDP, is being pocketed by a smaller percentage of, population. The bulk of population suffers poverty,, while only a small segment of the society enjoys, prosperity owing to a rise in GDP. The rise in GDP is, achieved at the cost of social welfare., , 17. “Management of a water polluting oil refinery says, that it (oil refinery) ensures welfare through its, contribution to gross domestic product.” Defend or, refute the argument of management with respect to, GDP as a welfare measure of the economy., (CBSE 2020), Ans. The above argument is refuted with respect to GDP as, , a welfare measure of the economy. It is because GDP is, not a good measure of welfare as it fails to take in to the, effect of externalities. Externality means good or bad, impact of an activity without paying the price or penalty, for that impact of externalities is not accounted in the, index of social welfare in terms of GDP., For example, oil refinery may pollute the nearby source, of water. Such harmful effects to people and marine life, is not be penalised. Thus it is not ensuring the welfare, of the economy through GDP., , (a), , Sales, , 400, , (b), , Net Value Added at Factor, Cost (NVA FC), , 200, , (c), , Subsidies, , 100, , Ans. As the sale of petrol and diesel cars rises, it implies that, , (d), , Change in Stock, , ?, , (e), , Depreciation, , (f), , Intermediate Consumption, , the private consumption expenditure is also rising., A rise in private consumption expenditure leads to a, rise in the gross domestic product., So, an increase in the sale of petrol and diesel cars will, lead to an increase in the gross domestic product of the, country., However, it will not lead to an increase in the welfare of, the people because of the below mentioned reasons, , (ii) Define real gross domestic product., Ans., , ` (in crores), , 16. Social welfare may not increase even when real, , 40, 100, (CBSE 2020), , (i) Net Value Added at Factor Cost (NVA FC), = Sales + Change in Stock – Intermediate, Consumption − Depreciation − Net Indirect, Taxes, 200 = 400 + (Change in Stock) − 100 − 40 − ( 0 − 100), 200 = 360 + Change in Stock − Change in Stock, = 360 − 200, Change in Stock = − 160 crores, ∴ Decrease in Stock = ` 160 crores, (ii) Real gross domestic product is the sum total of the money, value of all final goods and services produced in an, economy during the year estimated at same given base, year prices., , 18. Sale of petrol and diesel cars is rising particularly, in big cities. Analyse its impact on gross domestic, product and welfare., (CBSE 2016), , (i) As the sale of petrol and diesel cars rises, then the, level of pollution will also rise in the big cities., (ii) With a rise in the number of cars, the traffic, congestion on the roads will worsen., (iii) A rise in the number of cars will increase the demand, for petrol and diesel. This will lead to a rise in the, prices of petrol and diesel., (iv) The already depleted reserves of petrol and diesel, will be subjected to further depletion.
Page 40 :
29, , CBSE Term-II Economics XII, , 19. Explain how ‘non-monetary exchanges’ act as a, limitation in taking GDP as an index of welfare., (CBSE 2017), Ans. It can be understood with the help of following points, (i) GDP measures only economic value of the current, productive activity of a country., (ii) There are many activities which are not evaluated in, monetary terms. In India, non-monetary transactions are, present in rural areas where payments for farm labourers, are made in kind rather than cash. But such transactions, are not recorded., (iii) Even while producing goods and services, lot of human, cost is also involved. For example, sacrificing leisure, hours by working but this is never included in total cost., , Therefore, GDP remains underestimated and hence loses, its appropriateness as an index of welfare., , 20. ‘‘Gross Domestic Product (GDP) is not the best, indicator of the economic welfare of a country.’’, Defend or refute the given statement with valid, reasons., (CBSE 2020), Ans. ‘‘Gross Domestic Product (GDP) is not the best indicator of, , 22. Find net value added at market price., S.No., , (i), (ii), (iii), (iv), (v), , Contents, , 25, , Net Change in Stock, , ( −) 2, , Taxes on Production, , 1, , Ans Net Value Added at Market Price (NVA MP), , = Sales + Net Change in Stock − Raw Materials, − Depreciation on Fixed Capital Good, = 25 + ( −2) − 6 − 3 = ` 14 lakh, , Note Depreciation on Fixed Capital Good, Value of Fixed Capital Good, =, Life Span, 15, =, = ` 3 lakh, 3, , 23. Calculate net national product at market price, S.No., , Ans. The expenditure incurred by the government to popularise, , yoga among the masses will increase the government final, consumption expenditure. With a rise in this component,, the domestic income of the country will also rise. So, the, expenditure incurred by the government to popularise yoga, will lead to an increase in the Gross Domestic Product of, the country., This expenditure will also increase the welfare of the, people, as is enumerated below, (i) As more and more people practise yoga, their health and, immunity will improve. This will help in increasing their, working capacity., (ii) As people’s health improve, so government’s expenditure, on the curative aspect of health issues will decrease., (iii) People will develop a positive outlook and their, well-being will increase in general., , 6, , Sales, , (i) Distribution of GDP If the GDP of the country is rising,, it is not necessary that the welfare will also rise. This is, because with every increase in the level of GDP, it is not, necessary that distribution of income is also equalable., (ii) Non-Monetary Exchanges In rural economy, barter, system of exchange still prevails to some extent. Payments, for farm labour are often made in kind rather than in, cash. All such transactions remain unrecorded which, causes underestimation of GDP., (iii) Externalities It refers to good and bad impact of an, activity without paying the price or penalty for that, activity. Impact of external entities are not accounted in, the index of social welfare in terms of GDP., , (Delhi 2016), , 15, , Raw Materials, , from the following data, , among the masses. Analyse its impact on Gross, Domestic Product and welfare of the people., , `n (in lakhs), , Fixed Capital Good with a, Life Span of 5 Years, , the economic welfare of a country.’’ This statement is, defended because of the following reasons, , 21. Government incurs expenditure to popularise yoga, , (Delhi 2016), , Contents, , (i), , Net Factor Income from Abroad, , (ii), , Private Final Consumption, Expenditure, , ` (in crore), , ( −) 5, 100, , (iii) Personal Tax, , 20, , (iv) Gross National Disposable Income, (v), , 170, 20, , Government Final Consumption, Expenditure, , (vi) Corporation Tax, , 15, , (vii) Gross Domestic Capital Formation, , 30, , (viii) Personal Disposable Income, , 70, , (ix) Net Exports, (x), , ( − ) 10, , Savings of Private Corporate Sector, , (xi) Net National Disposable Income, Ans. Here,, , NNPMP = Private Final Consumption Expenditure, +Government Final Consumption, Expenditure + Gross Domestic Capital, Formation + Net Export − Depreciation, + NFIA, = 100 + 20 + 30 + ( − 10) − 25 + (–5), = ` 110 crore, Depreciation = Gross National Disposable Income, – Net National Disposable Income, = 170 − 145 = ` 25 crore, , 5, 145
Page 41 :
CBSE Term-II Economics XII, , 30, 24. Find net value added at market price., S.No., , (i), (ii), (iii), (iv), (v), (vi), (vii), , (Delhi 2012), , Contents, , ` (in crore), , Output Sold (units), , 800, 20, 1,600, 400, (–) 500, 1,000, 8,000, , Price Per Unit of Output, Excise, Import Duty, Net Change in Stock, Depreciation, Intermediate Cost, , Ans. Sales = Output Sold × Price Per Unit, = 800 × 20 = ` 16,000 crore, , Now, Value of Output = Sales + Change in Stock, = [16, 000 + ( −500 )] = ` 15,500 crore, Now, GVA MP = Value of Output − Intermediate Cost, = (15 ,500 − 8, 000) = ` 7,500 crore, Hence, NVA MP = GVA MP − Depreciation, = (7,500 − 1,000), = 6,500 crore, , 25. From the following data, calculate net value added at, factor cost, S.No., , (All India 2011), , Contents, , ` (in crore), , (i), , Sales, , 500, , (ii), , Purchase of Intermediate Goods, , 350, , (iii), , Opening Stock, , 60, , (iv), , Indirect Taxes, , 50, , (v), , Consumption of Fixed Capital, , 90, , (vi), , Import of Raw Materials, , 85, , (vii), , Closing Stock, , 80, , Ans. Here,, , Net Value Added at Factor Cost ( NVA FC ), = Sales + Change in Stock (Closing Stock −, Opening Stock) − Purchase of Intermediate Goods, − Consumption of Fixed Capital − Indirect Taxes, = 500 + ( 80 − 60 ) − 350 − 90 − 50, = 520 − 490 = ` 30 crore, l, , Long Answer (LA) Type Questions, 1. Explain the treatment assigned to the following while, estimating national income. Give reasons., (i) Family members working free on the farm owned by, the family., (ii) Rent free house from an employer., (iii) Expenditure on free services provided by the, government., , Ans., , (i) Family members working free on the farm owned by, the family are engaged in the value addition process., Imputed value of their farm output is included in the, estimation of national income. Accordingly, income, generated by the farming family would be treated as, mixed income of self-employed, which includes, compensation of labour., (ii) Rent free house from an employer is included in the, estimation of national income because it is a kind of, wages in kind and therefore, a part of compensation, of employees., (iii) Expenditure on free services provided by the, government should be included in the estimation of, national income because expenditure on these, services is a part of government final consumption, expenditure., , 2. Define the problem of double counting in the, estimation of national income. Discuss two, approaches to correct the problem of double, counting., (CBSE 2020), Ans. The counting of the value of commodity more than, , once is called double counting. This leads to, overestimation of the value of goods and services, produced. Thus, the importance of avoiding double, counting lies in avoiding overestimating the value of, domestic product., For example, a farmer produces one ton of wheat and, sells it for ` 400 in the market to a flour mill. The flour, mill sells it for ` 600 to the baker. The baker sells the, bread to a shopkeeper for ` 800. The shopkeeper sells, the entire bread to the final consumers for ` 900. Thus,, Value of Output = 400 + 600 + 800 + 900 = ` 2,700, Infact, the value of the wheat is counted four times, the, value of services of the miller thrice and the value of, services by the baker twice. In other words, the value of, wheat and value of services of the miller and of the, baker have been counted more than once. The counting, of the value of the commodity more than once is called, double counting., To avoid the problem of double counting, two methods, are used, (i) Final Output Method According to this method, the, value of intermediate goods is not considered. Only, the value of final goods and services are considered., In the above example, the value of final goods i.e.,, bread is `900., (ii) Value Added Method Another method to avoid the, problem of double counting is to estimate the total, value added at each stage of production. In the above, example, the value added at each stage of production, is 400 + 200 + 200 + 100 = ` 900, , 3. How will the following be treated while, estimating national income of India? Give, reasons., (i) Dividend received by a foreigner from investment, in shares of an Indian company.
Page 42 :
31, , CBSE Term-II Economics XII, Also,, Let mixed income = y, NDP FC = Wages and Salaries + Operating Surplus, + Mixed Income, 70, 000 = ( 15 , 000 + 30, 000 + y ), So, y = 25 , 000, , (ii) Expenditure on education of children by a family in, Uttar Pradesh., (iii) Remittances from non-resident Indians to their families, in India., (CBSE 2018), Ans., , (i) Dividend received by a foreigner from investment in, shares of an Indian company is included in national, income of India as a negative component because it is a, part of net factor income to the rest of the world., (ii) Expenditure on education of children by a family in Uttar, Pradesh is included in the estimation of national income, of India since it is a part of private final consumption, expenditure., (iii) Remittances from non-resident Indians to their families, in India are to be treated as transfer payments., Accordingly, these are not to be included in the, estimation of national income of India., , Note NDPFC = NNPMP − NFIA = 71,000 − 1,000, = ` 70,000 crores, So, Government final consumption expenditure, = ` 20,000 crores, Mixed income = ` 25,000 crores, , 5. Given the following data, find the missing values, of ‘private final consumption expenditure’ and, ‘operating surplus’., , 4. Given the following data, find the missing value of, , S. No., , ‘government final consumption expenditure’ and, ‘mixed income of self-employed’., , (i), , National Income, , (ii), , Net Indirect Taxes (NIT), , (iii), , Private Final Consumption Expenditure, , S. No., , Contents, , ` (in crores), , (i), , National Income, , 71,000, , (ii), , Gross Domestic Capital Formation, , 10,000, , (iii), , Government Final Consumption, Expenditure, , ?, , Mixed Income of Self-employed, , ?, , (iv), (v), , Net Factor Income from Abroad, , 1,000, , (vi), , Net Indirect Taxes, , 2,000, , (vii), , Profits, , 1,200, , (viii), , Wages and Salaries, , (ix), , Net Exports, , (x), , Private Final Consumption, Expenditure, , (xi), , Consumption of Fixed Capital, , (xii), , Operating Surplus, , Contents, , ` (in crores), 50,000, , 40,000, 3,000, 30,000, (CBSE 2019), , Ans. NNP FC = ` 71,000 (given) crores, , GDPFC = NNPFC − Net Factor Income from Abroad +, Depreciation + Net Indirect Taxes, = 71, 000 − 1, 000 + 3, 000 + 2, 000, = ` 75 , 000 crores, Now,, Let government final consumption expenditure = x, GDP MP = Private Final Consumption Expenditure +, Government Final Consumption Expenditure +, Gross Domestic Capital Formation + Net Exports, 75 , 000 = ( 40, 000 + x + 10, 000 + 5 , 000 ), ∴, x = ` 20, 000 crores, , ?, , (iv), , Gross Domestic Capital Formation, , (v), , Profits, , (vi), , Government Final Consumption, Expenditure, , 12,500, , (vii), , Wages and Salaries, , 20,000, , (viii), , Consumption of Fixed Capital, , (ix), , Mixed Income of Self-employed, , (x), , Operating Surplus, , (xi), , Net Factor Income from Abroad, , (xii), , Net Exports, , 15,000, 5,000, , 1,000, 17,000, 1,000, , 700, 13,000, ?, 500, 2,000, (CBSE 2019), , Ans. Private final consumption expenditure = y,, , Operating surplus = x, We know,, NDPFC = CoE + Operating Surplus + Mixed Income, Also, NDPFC = NNPFC − NFIA, = 50, 000 − 500 = ` 49,500 crores, ∴ 49,500 = Wages and Salaries + x + 13, 000, 49,500 = 20, 000 + 13, 000 + x, 49,500 = 33, 000 + x, x = 49,500 − 33, 000 = ` 16,500 crores, Also, GDPMP = PFCE + GFCE + Gross Domestic Capital, Formation + Net Exports, GDPMP = NPPFC + Depreciation + NIT, = 49,500 + 700 + 1, 000, = ` 51,200 crores, 51,200 = y + 12,500 + 17, 000 + 2, 000, ∴, ∴, y = ` 19,700 crores, So, private final consumption expenditure, = ` 16,500 crores, Operating surplus = ` 19,700 crores
Page 43 :
CBSE Term-II Economics XII, , 32, 6. Given the following data, find the values of ‘operating, , S.No., , surplus’ and ‘gross domestic capital formation’., S. No., , Contents, , (i), , Government Final Consumption, Expenditure, , (ii), , Mixed Income of Self-employed, , (iii), , National Income, , (iv), , Net Factor Income from Abroad, , (v), , Operating Surplus, , (vi), , Profits, , (vii), , Private Final Consumption Expenditure, , (ix), , Net Exports, , (x), , Consumption of Fixed Capital, , (xi), , Gross Domestic Capital Formation, , (xii), , Wages and Salaries, , Dividends, , ` (in crores), , (i), , Consumption of Fixed Capital, , 50, , 2,000, , (j), , Social Security Contribution by, Employers, , 200, , 1,500, , (k), , Mixed Income, , 200, , 1,000, (CBSE 2018), , Ans., , ?, 6,000, 700, 1,800, 600, ?, 6,000, , Let Gross domestic capital formation = x, And Operating surplus = y, GDP MP = NNP FC + Depreciation − NFIA + NIT, GDP MP = 12, 000 + 600 − 200 + 700 = ` 13,100 crores, GDP MP = Private Final Consumption Expenditure +, Government Final Consumption Expenditure +, Gross Domestic Capital Formation + Net, Exports, 13,100 = 6, 000 + 2, 000 + x + 1, 800, x = 13,100 − 9, 800 = ` 3, 300 crores, Gross domestic capital formation = ` 3,300 crores, NDP FC = NNP FC − NFIA, NDP FC = 12, 000 − 200 = ` 11, 800 crores, NDP FC = Compensation of Employees + Operating, Surplus + Mixed Income, 11, 800 = 6, 000 + y + 1,500, y = 11, 800 − 7,500 = ` 4, 300 crores, Operating surplus = ` 4,300 crores, , 8., , Ans., ` (in crores), , (a), , Rent and Interest, , 6,000, , (b), , Wages and Salaries, , 1,800, , (c), , Undistributed Profit, , 400, , (d), , Net Indirect Taxes, , 100, , (e), , Subsidies, , (f), , Corporation Tax, , (g), , Net Factor Income to Abroad, , 20, 120, 70, , (i) Define ‘net factor income from abroad’. How is it, different from ‘net exports’?, (ii) Calculate the value of “Rent” from the following, (CBSE 2019), data., S.No., , 7. Calculate, (i) Net National Product at Market Price, (ii) Gross Domestic Product at Factor Cost, , (i) NDP FC = Compensation of Employees + Operating, Surplus + Mixed Income, NDP FC = Wages and Salaries + Social Security, Contribution by Employers + Rent and, Interest + Undistributed Profit +, Corporation Tax + Dividends + Mixed, Income, NDP FC = 1, 800 + 200 + 6, 000 + 400 + 120, + 80 + 1, 000, NDP FC = 2, 000 + 6, 600 + 1, 000 = ` 9, 600 crores, NNP MP = NDP FC + Net Factor Income from Abroad, + Net Indirect Taxes, NNP MP = 9, 600 + ( − ) 70 + 100, NNP MP = 9, 600 − 70 + 100 = ` 9,630 crores, (ii) GDP FC = NDP FC + Depreciation, GDP FC = 9, 600 + 50 = ` 9,650 crores, , Ans. NNP FC = ` 12,000 (Given), , Contents, , 80, , 12,000, , (CBSE 2019), , S.No., , ` (in crores), , (h), , 500, , (viii) Net Indirect Taxes, , Contents, , (` in crores), , Contents, , (a), , Gross Domestic Product at Market, Price, , (b), , Mixed Income of Self-employed, , (c), , Subsidies, , 250, , (d), , Interest, , 800, , (e), , Rent, , (f), , Profit, , 18,000, 7,000, , ?, 975, , (g), , Compensation of Employees, , (h), , Consumption of Fixed Capital, , 6,000, 1,000, , (i), , Indirect Tax, , 2,000, , (i) Difference between Net Export and Net Factor, Income from Abroad (NFIA)., Net Factor Income From Abroad (NFIA) refers to the, difference between factor income received from and, paid to abroad., , Basis, Concept, , Net Exports, , NFIA, , It is the income from, buying and selling, goods abroad., , It is the income from, factor sources., , Formula Export of Goods –, Import of Goods, , Factor Income Received, from Abroad– Factor, Income paid to Abroad.
Page 44 :
33, , CBSE Term-II Economics XII, , (ii) By Income method, NDPFC = COE + Operating Surplus* + Mixed Income, …(i), *Operating Surplus = Rent + Interest + Profits, and NDPFC = GDPMP − Depreciation − NIT, = 18, 000 − 1, 000 − ( 2, 000 − 250), = ` 15,250 crores, Now, putting values in eq. (i), , ∴, , 15 , 250 = 6, 000 + Rent + 800 + 975 + 7, 000, 15 , 250 = 14, 775 + Rent, Rent = ` 475 crores, , 9. Explain the precautions that are taken while estimating, national income by value added method., , (CBSE 2017), , Ans. While using value added method for computing national, , income, the following precautions should be taken, (i) The value of intermediate goods should not be included., (ii) Purchase and sale of second hand goods should be, excluded., (iii) Imputed value of self-consumed goods should be, included., (iv) Own account production of goods should be included., (v) Value of self-consumed services should not be included in, the estimation of national income., (vi) Imputed rent on the owner occupied house is also taken, into the account., , 10., , Ans., , (i) Giving valid reasons, state how the services of a ‘school, teacher’ will be undertaken in estimation of national, income., (ii) Distinguish between ‘Real Gross Domestic Product’, and ‘Nominal Gross Domestic Product’. (CBSE 2020), (i) The services of a school teacher will be taken in the, estimation of national income of the country as they, provide services in consideration of some payment and, adds to the current flow of services., (ii) Difference between Real GDP and Nominal GDP, , Basis, , Real GDP, , Price, , It is the value of, It is the value of, current output at base current output at, year prices., current year prices., , Other Name It is also known as, GDP at constant, price., , Nominal GDP, , It is also known as, GDP., , Basis, , Real GDP, , Nominal GDP, , Rise, , It can increase only, when output of goods, and services rise in, the current year., , It can rise either when, output of goods and, services rise or when, current prices rise., , Reliability, , It is a reliable index of It is not a reliable, economic growth., index of economic, growth., , 11. Calculate (i) Gross Domestic Product at Market, Price and (ii) Factor income from abroad from the, following data., S.No., , Contents, , (a), (b), (c), (d), (e), (f), (g), (h), (i), (j), (k), (l), , Gross National Product at Factor Cost, , ` (in crore), , Net Exports, Compensation of Employees, Rent, Interest, Profit, Net Indirect Taxes, Net Domestic Capital Formation, Gross Fixed Capital Formation, Change in Stock, Dividend, Factor Income to Abroad, , 6,150, ( − ) 50, 3,000, 800, 900, 1,300, 300, 800, 850, 50, 300, 80, , Ans (i) GDPMP = Compensation of Employees + Rent, , + Interest + Profit + Net Indirect Taxes, + Consumption of Fixed Capital, = 3,000 + (800 + 900 + 1,300) + 300, + ( 850 + 50 − 800 ), = ` 6, 400 crore, Note Depreciation = Gross Domestic Fixed Capital, Formation + Change in Stock − Net, Domestic Capital Formation, , (ii) GNPFC = GDPMP − Net Indirect Taxes + Factor Income, from Abroad − Factor Income to Abroad, 6,150 = 6, 400 − 300 + Factor, Income from Abroad − 80, 6,150 = 6, 020 + Factor Income from Abroad, Factor Income from Abroad, = 6,150 − 6, 020 = ` 130 crore
Page 45 :
CBSE Term-II Economics XII, , 34, , Chapter Test, (ii) Payment of interest by a bank to an individual, (iii) Payment of interest by an individual to a bank, , Multiple Choice Questions, , 1., , GDP does not include, (a) government spending to clean up pollution caused by, factories, (b) payments to technical consultants abroad, (c) additions to inventory stocks of intermediate goods, (d) None of the above, , 2., , 3., , Explain the precautions that should be taken while, estimating national income by expenditure, method., , 4., , If Real GDP is ` 300 and Nominal GDP is ` 330,, calculate Price Index (base = 100)., , 5., , The value of the Nominal Gross National Product, (GNP) of an economy was ` 2,500 crores in a, particular year. The value of GNP of that country, during the same year, evaluated at the price of, base year was ` 3,000 crores., Calculate the value of GNP deflator of the year in, percentage terms. Has the price level risen, between the base year and the year under, consideration?, , GDP equals GNP, when, (a) the value of exports of goods equals the value of imports, of goods, (b) the value of exports of goods and services equals the value, of imports of goods and services, (c) there are no net factor income from abroad, (d) None of the above, , 3., , Income from buying and selling of financial assets is, not included in the estimation of domestic income by, income method. Choose the correct reason for the, same., (a) These are paper claims and no actual production has, happened, (b) It’s a transfer of ownership from one person to other, (c) These are not related to the current year’s production., (d) Both (a) and (b), , 4., , 1., , (i) Discuss briefly the three components of, ‘Income from property and entrepreneurship’., (ii) What are ‘externalities’ ? State its types with, suitable examples., , 2., , Given the following data, find the missing values, of ‘gross domestic capital formation’ and ‘Wages, and salaries’., , Net factor income abroad is zero when, (a) factor income from abroad is equal to factor income to, abroad, (b) factor income from abroad is more than factor income to, abroad, (c) it can never be zero, (d) None of the above, , 5., , Long Answer (LA) Type Questions, , S. No., , Contents, , (i), , Mixed Income of Self-employed, , ` (in crores), 3,500, , (ii), , Net Indirect Taxes, , 300, , (iii), , Wages and Salaries, , ?, , If a country’s nominal GDP is constant, then which of, the following statements about it would be correct?, , (iv), , Government Final Consumption, Expenditure, , (a) It is impossible for the real per capita GDP to rise in such, circumstances, (b) The real per capita GDP can rise if and only if the, country’s population is shrinking and prices are falling, (c) It is possible for the real per capita GDP to rise even if, the country’s population is increasing, (d) None of the above, , (v), , Net Exports, , (vi), , Consumption of Fixed Capital, , 300, , (vii), , Net Factor Income from Abroad, , 700, , (viii), , Operating Surplus, , 12,000, , (ix), , National Income, , 30,000, , Short Answer (SA) Type Questions, , 1., , ‘‘Gross investment is always greater than net, investment.’’ Defend or refute the given statement with, valid argument., , 2., , Giving reason explain how the following should be, treated in the estimation of national income?, , (x), , Profits, , (xi), , Gross Domestic Capital, Formation, , (xii), , Private Final Consumption, Expenditure, , (i) Payment of interest by a firm to a bank, , Answers, Multiple Choice Questions, 1. (b), , 2. (c), , 3. (d), , 4. (a), , 5. (c), , For Detailed Solutions, Scan the code, , 14,000, 3,000, , 500, ?, 11,000
Page 46 :
35, , CBSE Term-II Economics XII, , CHAPTER 03, , Aggregate Demand,, Aggregate Supply, and Related Concepts, In this Chapter..., l, , Concept of Aggregate Demand (AD), , l Saving Function, , l, , Concept of Aggregate Supply (AS), , l, , Concept of Short-run, , l, , Consumption Function, , l, , Investment Multiplier, , Concept of Aggregate Demand (AD), Aggregate Demand is the value of total expenditure on all, goods and services in an economy during a fiscal year., Aggregate Demand of the economy depends upon the level of, employment. There is direct or positive relationship between, the level of employment or output in the economy and the, Aggregate Demand. Aggregate Demand is the summation of, consumption and investment., Aggregate Demand (AD) = C + I, Where, C = Consumption expenditure, I = Investment, Components of Aggregate Demand, Following are the components of Aggregate Demand (AD) in a, four sector economy, 1. Household Consumption Demand or Expenditure (C ) It, refers to total expenditure to be incurred by all, households on purchase of goods and services, e.g.,, households demand for food, clothing, housing, etc. It is, also called private consumption expenditure., It is determined by the level of personal disposable, income in the economy. Higher the level of personal, disposable income, higher the private consumption, expenditure., , 2. Investment Expenditure by Firms (I) It refers to, planned expenditure by private entrepreneurs on, creation of new capital assets like machines, buildings, and raw materials. Increase in capital assets through, investment is called capital formation. It is also called, private investment expenditure. It comprises of, investment in fixed assets and inventory stock. It is, determined by the market rate of interest. Higher the, market rate of interest, lower the investment, expenditure as rate of interest is considered as cost of, borrowings., 3. Government Expenditure or Demand for Goods and, Services (G) It refers to government planned, expenditure on purchase of consumer and capital, goods to fulfil common needs of the society. These, include provision for schools, transport, hospitals,, roads, parks, etc., 4. Net Export ( X − M ) It is defined as the aggregate of all, demand for our goods and services by foreign countries, over our country’s demand for foreign countries’ goods, and services. It depends upon foreign exchange rate,, terms of trade, trade policy, etc. thus, aggregate, demand can also be written as, AD = C + I + G + ( X − M )
Page 47 :
CBSE Term-II Economics XII, , 36, , Concept of Aggregate Supply (AS), Aggregate Supply is the money value of the final goods and, services or national product produced in an economy during, one year. It is equal to income generated., AS = Y = C + S, , So,, , l, , The two main components of AS are, l, , Consumption expenditure ( C ), Saving ( S), , Consumption Function, The relationship between the consumption expenditure and, income is known as consumption function., , C = F ( Y), Where, C = Consumption expenditure, Y = Income, The algebraic expression of consumption function is, C = C + bY, Where, C = Consumption, C = Autonomous consumption, i.e. consumption at, zero level of income, b = Marginal Propensity to Consume, Y = Disposable income, i.e. income after tax, Explanation of consumption function with the help of an, imaginary schedule and graph, ∆C, , ∆Y, , MPC (∆C/∆Y), , —, , —, , —, , 0, , 300, , —, , 200, , 350, , 1.75, , 50, , 200, , 0.25, , 400, , 400, , 1, , 50, , 200, , 0.25, , 600, , 450, , 0.75, , 50, , 200, , 0.25, , 800, , 500, , 0.625, , 50, , 200, , 0.25, , 1000, , 550, , 0.55, , 50, , 200, , 0.25, , Y, Y, , Consumption (C), , CC is a linear function., There is a positive relation between Y and C., , Propensity to Consume, , A major portion of income is spent on consumption of goods, and services and the balance is saved., Aggregate Supply/National Income = Consumption+ Saving, or, Y = AS = C + S, , Income Consumption APC, (C), (C/Y), (Y), , l, , C = Y when Y = 400 . It refers to a break-even point., 300 is the minimum level of C, even when Y = 0., So, C = 300 and b = MPC = 0 . 25, , Components of Aggregate Supply, l, , CC is the consumption function, showing the behaviour, of C with respect to Y., CC is a straight line moving upward showing that, , 600, C, 500, Q, 400, 300 C, 200, 45°, 100, 0, 200 400 600 800 1000, Income (Y), , It refers to the ratio between consumption (C) and income, (Y). It has two aspects, 1. Average Propensity to Consume (APC) Average, Propensity to Consume is the ratio of aggregate, consumption expenditure (C) to aggregate income (Y)., APC =, , C, Y, , 2. Marginal Propensity to Consume (MPC) The ratio, between the change in consumption expenditure, (∆C) and the change in income (∆Y) is called Marginal, Propensity to Consume., MPC =, , ∆C, ∆Y, , Saving Function, The relationship between savings and income is known as, saving function., , S = F ( Y), Where, S = Saving, Y = Income, Saving is the excess income which is left with the, consumer after doing all the consumption expenditure., S= Y −C, The algebraic expression of saving function is, S = − S + sY, Where, S = Saving, S = Autonomous saving, i.e, level of saving when, income is zero, s = Marginal Propensity to Save, Y = Disposable income, Explanation of saving function with the help of an, imaginary schedule and graph, Income Consumption Saving, (C), (S), (Y), , X, , Consumption function: Behaviour of C with respect toY, , APS, (S/Y), , ∆S, , ∆Y, , MPS, (∆S/∆Y), , 0, , 300, , −300, , —, , —, , —, , —, , 200, , 350, , −150, , − 0.75, , 150, , 200, , 0.75, , 400, , 400, , 0, , 0, , 150, , 200, , 0.75, , 600, , 450, , 150, , 0.25, , 150, , 200, , 0.75, , 800, , 500, , 300, , 0.375, , 150, , 200, , 0.75
Page 48 :
37, , CBSE Term-II Economics XII, , Income Consumption Saving, (C), (S), (Y), , APS, (S/Y), , ∆S, , ∆Y, , MPS, (∆S/∆Y), , APC can never be zero or negative, as consumption is, always positive even at zero level of income., , 1000, , 550, , 450, , 0.45, , 150, , 200, , 0.75, , Relationship between MPC and MPS, , 1200, , 600, , 600, , 0.50, , 150, , 200, , 0.75, , ∆C, ∆S, , MPS =, ∆Y, ∆Y, As we know that, ∆Y = ∆C + ∆S, ∆ C ∆ S ∆ C + ∆ S ∆ Y, So, MPC + MPS = , +, =, =, =1, ∆Y, ∆Y, ∆Y ∆Y, MPC =, , Y, 800, S, , 700, D, , 600, , Increase in, saving, , or MPC + MPS = 1 , MPC = 1 − MPS ,, MPS = 1 − MPC, , C, , 400, B, , 1300, , 1000, , 800, , 900, , 700, , 500, , 600, , 300, , 100, , 400, , 0, , 200, , 100, , 1200, , A, , 1100, , 200, , Increase, in income, , 300, , 100, , Saving (` in crore), , 500, , X, , Income (` in crore), , 200, 300, S 400, , S, , SS is the saving function, when Y = ` 1000 crore,, S = ` 450 crore. So that,, 500, 450, APS, = S/Y =, = 0.45., 600, 1000, When, income, is, 0,, savings, are, –300,, Y, ∴ S = –300 and S = MPS = 0.75, , It suggests 45% of income is saved and (100–45) = 55 % is spent., Saving function: Behaviour of S with respect to Y, , Propensity to Save, It refers to the ratio between saving (S) and income ( Y) with, respect to given level of income. It has two aspects, 1. Average Propensity to Save (APS) The ratio between, aggregate saving (S) and aggregate income (Y) is called, Average Propensity to Save (APS)., APS =, , S, Y, , 2. Marginal Propensity to Save (MPS) The ratio between, change in saving (∆S) and change in income ( ∆Y) is called, Marginal Propensity to Save (MPS)., MPS =, , ∆S, ∆Y, , Relationship between APC and APS, , C, S, , APS =, Y, Y, As we know that, Y = C + S, C S C + S Y, So,, APC + APS = + =, = =1, Y, Y, Y Y, or, APC + APS = 1, APC = 1 − APS, APS = 1 − APC, Value of APS is negative when APC > 1. It happens when, C > Y, where C = Consumption, Y = Income. However, value of, APC =, , Marginal Propensity to Consume is generally less than, unity and greater than zero. It means that a part of increase, in income is consumed and the other part is saved. So, that, 1, 1, when MPC = , then MPS = ,, 2, 2, also implying that, MPC + MPS = 1 always. Also, with the, rise in income level, APC generally falls hence, APS rises., , Paradox of Thrift, It implies that if all the people of an economy increase the, proportion of income they save, then the total volume of, savings in that economy will not increase. Total savings will, either decrease or remain the same., , Induced Investment, The investment made with a view to earn more profit is known, as induced investment. It has a positive slope showing direct, relationship between income and investment. Induced, investment is income elastic., , Autonomous Investment, The investment which is not influenced by expected, profitability or level of income is called autonomous, investment. It is income-inelastic. Autonomous investment, curve is horizontal straight line parallel to X-axis., , Concept of Short-run, Short-run may be defined as a period of time when, ‘technology’ as a factor (affecting the level of output), remains constant. Accordingly, level of output is, determined exclusively by the level of employment in the, economy (briefly employment of labour). Higher level of, employment causes proportionately higher level of output, and vice-versa. So long as there is unemployment in the, economy (implying the existence of excess capacity),, general price level is assumed to remain constant., Equilibrium Output (AD-AS Approach), The following are the two approaches, 1. AD = AS Approach Equilibrium GDP refers to a, situation when in an economy, AD = AS, So that, all that the producers wish to produce (or, plan to produce) during the year is exactly equal to
Page 49 :
CBSE Term-II Economics XII, , 38, what the buyers wish to spend on the purchase of goods, and services during the year., Since,, , AD = C + I and AS = C + S, , Equilibrium GDP = C + S = C + I, C=I, ∴, Thus equilibrium output/equilibrium GDP is achieved, when AD = AS or C = I, 2. S = I Approach Equilibrium level of output is, determined at a point where planned saving is equal to, planned investment., In national income accounting,, (C + S) = (C + I) always, S = I always, This equality refers to the equality between ex-post AS, and AD or between ex-post S and I which is an, accounting identity. Ex-post means ‘actual’ or ‘realised’, and actual S is always equal to actual I. In the context of, equilibrium level of income/output, what matters is the, equality between ex-ante AS and AD or between ex-ante, S and I. Ex-ante means ‘planned’ or ‘desired’ or intend., Equilibrium is struck only when planned AS = planned, AD (or planned S = planned I). It refers to AS as planned, by the producers for the year ahead and AD as planned, by the consumers and investors for the year ahead., , Investment Multiplier, It refers to the number by which change in investment (∆ I), multiplies to become change in income (∆ Y)., In other words, it can be expressed as the ratio between, change in income ( ∆Y) to change in investment ( ∆ I )., ∆Y, K=, ∆I, K = Multiplier, ∆Y = Change in income, ∆ I = Change in investment, , Where,, , Relationship between Multiplier and MPC, There is a direct relationship between multiplier and MPC., Higher the value of MPC, higher the multiplier and, vice-versa., 1, K=, 1 − MPC, , Relationship between Multiplier and MPS, There is an inverse relationship between multiplier and, MPS. Higher the value of MPS, lower the multiplier and, vice-versa., 1, K=, MPS, , Solved Examples, Example 1. Complete the following table., , 0, 50, , –40, –20, , Average, Propensity to, Consume (APC), …, ..., , 100, 150, 200, , 0, 30, 50, , ..., 0.8, ..., , Income, ( `), , Saving ( `), , Consumption, (C ) (`), , Marginal Propensity to, Consume (MPC), , Income, ( `), , …, ..., , 0, 100, 200, ..., ..., , 0.6, ..., ..., , Ans. C = Y − S , APC = C/Y, MPC =, , Income ( Y ) Saving, ( `), ( S) (`), , Example 2. Complete the following table., Consumption, Expenditure, ( `), 80, 140, ..., 240, 260, , Marginal, Propensity to, Save (MPS), …, 0.4, ..., ..., 0.8, , Ans. Y = C + S,, , ∆C, ∆Y, , S = Y – C,, , APC, , ∆C, , ∆Y, , MPC, , 0, , –40, , 40, , —, , —, , —, , —, , 50, , –20, , 70, , 1.4, , 30, , 50, , 0.6, , 100, , 0, , 100, , 1, , 30, , 50, , 0.6, , 150, , 30, , 120, , 0.8, , 20, , 50, , 0.4, , 200, , 50, , 150, , 0.75, , 30, , 50, , 0.6, , Income, ( Y ) ( `), 0, 100, 200, 300, 400, , MPS =, , ∆S, ,, ∆Y, , Consumption Saving, Expenditure, ( S) (`), (C )( `), 80, –80, 140, –40, 0, 200, 240, 60, 260, 140, , APS =, ∆S, —, 40, –40, 60, 80, , Average Propensity, to Save (APS), …, ..., 0, 0.20, 0.35, , S, Y, ∆Y, —, 100, 100, 100, 100, , MPS, —, 0.4, – 0.4, 0.6, 0.8, , APS, —, –0.4, 0, 0.20, 0.35
Page 50 :
39, , CBSE Term-II Economics XII, , Example 3. Complete the following table, , Example 6. Calculate autonomous consumption, , Savings (`), , Income to, Consume, , Marginal, Propensity to, Consume (MPC), , 100, , 50, , 150, , —, , 175, , 75, , L, , L, , 250, , 100, , L, , L, , 325, , 125, , L, , L, , Consumption, Expenditure (`), , expenditure from the following data about an, economy which is in equilibrium, National Income, = ` 500, Marginal Propensity to Save = 0.30, Investment Expenditure, = 100, Ans. Given, Y = ` 500,, , MPS = 0.30, I = 100, C = ?, b or MPC = 1 − MPS = 1 − 0.30 = 0.70, Y = C + I or Y = C + bY + I, , Ans. Income to Consume, , = Consumption Expenditure + Savings, , Income to, Consumption, Savings, Consume, Expenditure (C ) (`) ( S) (`), ( Y), , ∆C, , ∆Y, , 500 = C + 0.70 × 500 + 100, 500 = C + 350 + 100, , MPC, ∆C , , , ∆Y , , 100, , 50, , 150, , —, , —, , —, , 175, , 75, , 250, , 75, , 100, , 0.75, , 250, , 100, , 350, , 75, , 100, , 0.75, , 325, , 125, , 450, , 75, , 100, , 0.75, , Example 4. Calculate investment expenditure from the, following data about an economy which is in, equilibrium., National Income, = ` 1,000, Marginal Propensity to Save, = 0.20, Autonomous Consumption Expenditure = ` 100, , C = 500 − 450 = 50, ∴ Autonomous consumption ( C ) = 50, , Example 7. In an economy, everytime income rises,, 75% of the rise in income is spent on consumption., Now, suppose in the same economy, investment, rises by ` 750 crore. Calculate the following, (i) Change in income., (ii) MPS., Ans., , Y = ` 1, 000,, MPS = 0. 20, C = ` 100, I = ?, b or MPC = 1 − MPS = 1 – 0. 20 = 0.80, , Ans. Given,, , or, , Y=C+I, Y = C + bY + I, 1, 000 = 100 + 0.80 × 1, 000 + I, I=1,000 – 900, I = 100, , Y = ` 2, 000, C = ` 200, I = 100, We know,, Y = C + I, C = C + bY, Y = C + bY + I, For calculating MPC, we use following equation, Y = C + bY + I, b = MPC, 2, 000 = 200 + 2, 000 b + 100, 2, 000 − 300 1, 700, b=, =, = 0.85, 2, 000, 2, 000, , Ans Given,, , Thus,, , MPC = 0.85, , ∆ I = ` 750 crore, 1, Now,, K=, 1 − MPC, 1, 1, K=, ∴, =, =4, 1 − 0.75, 0 . 25, ∆Y, Again,, K=, ∆I, ∆Y, or, 4=, 750, ∴ ∆ Y = 750 × 4, ∆ Y = ` 3,000 crore, (ii) MPS = 1 − MPC = 1 − 0.75 = 0.25, , Example 8. State whether the following statements are, true or false. Give reasons for your answer., (i) When marginal propensity to consume is greater, than marginal propensity to save, the value of, investment multiplier will be greater than 5., (ii) The value of marginal propensity to save can, never be negative., , Example 5. Calculate Marginal Propensity to Consume, from the following data about an economy which is, in equilibrium., National Income, = ` 2,000, Autonomous Consumption Expenditure = ` 200, Investment Expenditure, = 100, , (i) Here, MPC = 0.75,, , Ans., , (i) No, the statement is false. This can be understood by, an example. Suppose, the value of MPC = 0.6, hence,, MPS = 0.4 (as MPS = 1 − MPC )., Here,, MPC > MPS, 1, 1, 1, Now,, or, = 2.5, K=, =, 0.4, 1 − MPC 1 − 0.6, So, K < 5 even if MPC > MPS., (ii) Yes, the statement is true. As MPS tells about the, change in savings due to change in income and even, if the entire income is consumed, savings can be at, most zero, so MPS can never be negative.
Page 51 :
CBSE Term-II Economics XII, , 40, , Chapter, Practice, PART 1, Objective Questions, l, , Multiple Choice Questions, 1. According to the theory of Keynesian Economics,, the value of the average propensity to consume can, never be ……… ., (CBSE 2020), (a) zero, (c) more than one, , (b) unity, (d) less than one, , 2. If Marginal Propensity to Save (MPS) is equal to, zero, the value of investment multiplier will be, .................... ., (CBSE 2020), (b) 0, (d) None of these, , Ans. (c) Multiplier ( K ) = 1/MPS = 1 / 0 = ∞, , 3. If the marginal propensity to consume is greater, than marginal propensity to save, the value of the, multiplier will be, (CBSE 2017), (a), (b), (c), (d), , greater than 2, less than 2, equal to 2, equal to 5, , Ans. (a) greater than 2, , 4. If the value of Average Propensity to Consume, (APC) is 0.8 and national income is ` 4,000 crores,, the value of savings will be ............ . (Choose the, correct alternative), (CBSE 2020), (a), (b), (c), (d), , ` 100 crores, ` 200 crores, ` 800 crores, ` 500 crores, , Ans. (c) APS = 1 − APC = 1 − 0.8 = 0. 2, , Savings, National Income, Savings, 0. 2 =, 4,000, , Also, APS =, ⇒, , ⇒ ` 800 crores, , rises from ` 500 crores to ` 600 crores. As a result,, the consumption expenditure rises from ` 400, crores to ` 500 crores. Marginal propensity to, consume in such a case would be...... . (Choose the, correct alternative), (CBSE 2020), (a) 0.8, , (b) 0.4, , (c) 1.0, , (d) 0.6, , DC, 500 − 400, 100, Ans. (c) MPC =, =, =, =1, DY, 600 − 500, 100, , 6. In an open economy, aggregate demand is, estimated as, , Ans. (a) zero, , (a) 1, (c) ∞, , 5. Suppose in a hypothetical economy, the income, , (a) Private Consumption Expenditure + Net Exports, (b) Private Consumption Expenditure + Government, Expenditure, (c) Private Consumption Expenditure + Government, Expenditure + Net Exports, (d) Private Consumption Expenditure + Private Investment, Expenditure + Government Expenditure + Net Exports, Ans. (d) Private Consumption Expenditure + Private, , Investment Expenditure + Government Expenditure +, Net Exports, , 7. Which of the following statements is/are correct?, (i) Autonomous investment increases with increase, in the level of income in an economy., (ii) Induced investment changes with change in the, rate of interest and income level in an economy., Alternatives, (a) Both are true, (b) Both are false, (c) (i) is true, but (ii) is false, (d)(i) is false, but (ii) is true, Ans. (d) Autonomous investment does not change with any, , change in the level of income. It remains constant, no, matter what the level of income is in the economy., , 8. Expenditure on Goods and Services =, (a) Government Expenditure + Investment Expenditure, (b) Consumption Expenditure + Government Consumption, Expenditure, (c) Consumption Expenditure + Investment Expenditure, (d) None of the above, Ans. (c) Consumption Expenditure + Investment Expenditure
Page 52 :
41, , CBSE Term-II Economics XII, , 9. When C function shoots from Y-axis, it indicates that, (i) consumption is zero when income is zero, (ii) saving is negative when income is zero, (iii) consumption is positive when income is zero, (iv) saving is positive when income is zero, Alternatives, (a) (i) and (ii), (c) (i), (ii) and (iii), , (b) (ii) and (iii), (d) (ii), (iii) and (iv), , Ans. (b) (ii) and (iii), , 10. Constant slope of S-line indicates that, (a), (b), (c), (d), , = ` 9,000, private investment expenditure, = ` 7,000, government expenditure = ` 12,000,, exports = ` 1,000 and imports = ` 3,000, the level, of AD in an open economy will be, (b) ` 26,000, (d) ` 29,000, , Ans. (b) AD (Y) = C + I + G + NX, , = 9,000 + 7,000 + 12,000 + 1,000 – 3,000, = ` 26,000, (b) MPC = 1 – MPS, (d) All of these, , Ans. (d) All of the above, , (i) line of reference, (ii) line of identity, (iii) line of equality between AS and AD, Alternatives, (a), (b), (c), (d), , (i) and (ii), (ii) and (iii), (i) and (iii), None of the above, , Ans. (c) (i) and (iii), , 17. In Keynesian Economics, equilibrium level of, (a), (b), (c), (d), , equilibrium level of output, equilibrium level of employment, Both (a) and (b), None of the above, , Ans. (c) Both (a) and (b), , 13. Propensity to save is the, additional income that is not to be saved, ratio of saving to income, level of saving at which saving and consumption are equal, tendency of the consumer towards higher saving, , 18. If MPC = 0.5, the value of multiplier equals, (a) 2, (c) 5, Ans. (a) K =, , Ans. (b) ratio of saving to income, , 14. Which of the given pair is correctly matched?, Column I, , Column II, , A., , Income is zero, , (i), , Consumption is zero, , B., , MPC + MPS, , (ii), , Zero, , C., , APC + APS, , (iii) Two, , D. Propensity to save, , (iv) The ratio of saving to income, , (b) B-(ii), , (c) C-(iii), , (d) D-(iv), , (b) 1, (d) ∞, , 1, 1, =, =2, MPC 0.5, , 19. The value of multiplier is, 1, MPC, 1, (c), 1 – MPC, (a), , Ans. (b), , Codes, (a) A-(i), , (b) Both (ii) and (iii), (d) None of these, , income implies, , 12. Which of the following is correct?, , (a), (b), (c), (d), , (i) there is fuller utilisation of resources in the, economy, (ii) there is unemployment of resources in the, economy, (iii) there is excess capacity in the economy, Alternatives, , 16. 45 degree line in the context of equilibrium GDP is a, , 11. When household consumption expenditure, , C, Y, (c) APC + APS = 1, , 15. Perfectly elastic AS implies that, , Ans. (b) Both (ii) and (iii), , Ans. (d) Both (a) and (c), , (a) APC =, , consume and average propensity to save is equal to one, and propensity to save is the ratio of saving to income., , (a) Both (i) and (ii), (c) (i), (ii) and (iii), , S-line will be a straight line, saving function will be non-linear, saving function will be linear, Both (a) and (c), , (a) ` 16,000, (c) ` 28,000, , Ans. (d) APC + APS = 1, aggregate of average propensity to, , 1, MPS, 1, (d), MPC – 1, (b), , 1, MPS, , 20. With the increase in investment, MEC, (a) rises, (c) remains constant, Ans. (b) falls, , (b) falls, (d) None of these
Page 53 :
CBSE Term-II Economics XII, , 42, l, , Reason (R) Saving is a leakage in the circular flow, of income. Greater the savings, greater the leakage, and lower the value of investment multiplier., , Assertion-Reasoning MCQs, , Directions (Q. Nos. 1 to 7) There are two statements marked, as Assertion (A) and Reason (R). Read the statements and, choose the appropriate option from the options given below., , Ans. (a) Both Assertion (A) and Reason (R) are true and Reason, , (R) is the correct explanation of Assertion (A)., , (a) Both Assertion (A) and Reason (R) are true and Reason, (R) is the correct explanation of Assertion (A)., (b) Both Assertion (A) and Reason (R) are true, but Reason, (R) is the not the correct explanation of Assertion (A)., (c) Assertion (A) is true, but Reason (R) is false., (d) Both Assertion (A) and Reason (R) are false, , 6. Assertion (A) Full employment does not imply zero, unemployment in an economy., Reason (R) There are certain people in the economy, who are both voluntary as well involuntary, unemployed and there also exist certain level of, natural unemployment in an economy., , 1. Assertion (A) AD is measured not as the sum total, of goods but as the sum total of planned, expenditure on the goods during an accounting, year., Reason (R) It is not possible to add up physical, quantities of the goods and services planned to be, purchased by the people., , Ans. (a) Both Assertion (A) and Reason (R) are true and Reason, , (R) is the correct explanation of Assertion (A)., , 7. Assertion (A) The value of marginal propensity to, save can never be negative., Reason (R) MPS is the ratio between additional, saving and additional income which is always, positive because of positive relationship between, savings and income., , Ans. (a) Both Assertion (A) and Reason (R) are true and Reason, , (R) is the correct explanation of Assertion (A)., , 2. Assertion (A) The value of marginal propensity to, consume can be greater than one., Reason (R) The value of marginal propensity to save, can be negative as well., Ans. (d) The value of MPC cannot be greater than one because, , change in consumption can never be greater than change in, income. MPS is the ratio between additional savings and, additional income which is always positive because of, positive correlation between savings and income., , 3. Assertion (A) Saving function depicts linear, relationship when MPS is found to be constant., Reason (R) A linear saving function is a straight line, savings function. The slope of a straight line is, constant as indicated by constant MPS., Ans. (a) Both Assertion (A) and Reason (R) are true and Reason, , (R) is the correct explanation of Assertion (A)., , 4. Assertion (A) The value of investment multiplier, varies between one and infinity., Reason (R) The minimum value of investment, multiplier is one when MPC equals zero and, maximum value equals infinity when MPC equals, one., 1, 1, =, =1, 1 − MPC 1 − 0, 1, 1, In case MPC = 1, K =, =, =∞, 1 − MPC 1 − 1, , Ans. (d) In case MPC = 0, K =, , 5. Assertion (A) There is an inverse relationship, between the value of investment multiplier and, marginal propensity to consume., , Ans. (a) Both Assertion (A) and Reason (R) are true and Reason, , (R) is the correct explanation of Assertion (A)., l, , Case Based MCQs, 1. Direction Read the following text and answer, question no. (i) to (vi) on the basis of the same., “The denial of the crucial role of the interest rate as, equilibrator of savings and investment led directly, to the Keynesian theory of employment, determinants. Given the ‘propensity to consume’, and hence the proportion of any given income that, will be spent by individual consumers (on which, the size of R F Kahn’s ‘multiplier’ depends), the, level of output and employment will be a function, of investment. According to the level at which, investment (also consumption) stands, the level of, output and employment may be almost anything, between zero and full capacity output. There is at, any rate, no longer any unique level to which the, system is necessarily tending. So far as investment, consists of private investment, it will remain, governed by the ‘marginal efficiency of capital’, (anticipated profitability), modified, on one hand,, by ‘expectations’ (powerfully swayed by business, mood and the like) and on other hand, by the cost of, borrowing, namely prevailing rate of interest., Thus, was the casual emphasis of theory reversed:, instead of any change in saving being translated, into an equivalent shift of investment and (via, income changes) the volume of savings the, dependent variable.
Page 54 :
43, , CBSE Term-II Economics XII, Interest was converted virtually into a money, rate-something influenced on the one hand by, monetary policy (affecting the supply of money, available) and on the other hand by the current, attitude towards is as something worth holding (e.g,, qua bank deposit) in preference to other assets (e.g,, bonds). This later constituted the famous liquidity, preference –a preference powerfully influenced by, expectations (or uncertainty) about future, movements of interest rates (and hence of bond, prices).”, Source [From Maurice Dobb, Theories of Value and, Distribution since Adam Smith, page 218–219], , (i) There is no unique level of output and employment, to which the economic system tends, because, (a) investment consists only of private investment, (b) investment determines the level of output and can vary, (c) changes in saving are translated into an equivalent, level of investment, (d) investment depends upon the propensity to consume, Ans. (b) As per the passage, there is no unique level of output, , and employment in an economic system because these, two factors are dependent on investment which is not, constant., , (ii) The ‘multiplier’ referred to here relates to, (a) the propensity to consume which determines how, much consumers spend, (b) the change in employment consequent upon a change, in output, (c) the change in output consequent upon a change in, investment, (d) the number that equilibrates saving and investment, Ans. (c) Multiplier in the passage refers to change in output, , due to change in investment., , (iii) Expectations ……… ., (a), (b), (c), (d), , determine the prevailing rate of interest, contribute to liquidity preference, govern the cost of borrowing, determine the money supply, , Ans. (b) As per the passage, liquidity preference of people is, , determined by their expectations., , (iv) Keynes treated the interest rate as, (a) entirely determined by expectations about the future, (b) the rate at which current savings and investment are, equilibrated, (c) reflecting both monetary policy and liquidity preference, (d) an indicator of expected profitability, Ans. (c) According to Keynes, interest rate is affected by both,, , the monetary policy and the liquidity preference., , (v) Liquidity preference, (a) is about holding money related to other assets, (b) is the difference between bond prices and interest rates, , (c) affects the supply of money, (d) is unrelated to any of the above, Ans. (a) Liquidity preference means holding money in liquid, , form, as compared to other assets., , (vi) Assertion (A) The level of private investment in an, economy arbitrarily depends on the marginal, efficiency of capital., Reason (R) Animal spirits results in boom and bust, and the cost of borrowing largely influences the, level of private investment., Alternatives, (a) Both Assertion (A) and Reason (R) are true and Reason (R), is the correct explanation of Assertion (A)., (b) Both Assertion (A) and Reason (R) are true, but Reason, (R) is not the correct explanation of Assertion (A)., (c) Assertion (A) is false, but Reason (R) is true, (d) Both the statements are false, Ans. (a) Both Assertion (A) and Reason (R) are true and Reason, , (R) is the correct explanation of Assertion (A)., , 2. Direction Read the following text and answer, question no. (i) to (vi) on the basis of the same., Suppose in equilibrium, aggregate income (in units, of money per year) in an economy Y = C + I, where, investment expenditure (in units of money per year), I = 1, 000 and aggregate consumption expenditure (in, units of money per year) C satisfies the following, conditions, l, , l, , l, , C is a function of current disposable income in the, economy., f Yd = 0, then C = 500, Marginal propensity to save out of Yd is constant in the, economy and equal to 30%., , Suppose the government collects direct tax, revenues equal to 15% of Y and makes direct, transfer payments equal to 750 units of money per, year., (i) The level of MPC in an economy is, (a) 0.595, (c) 0.495, , (b) 0.678, (d) 0.324, , Ans. (a) MPC = 1 − 0.30 − (0.70 × 0.15), , = 0.7 – 0.105 = 0.595, , (ii) What is the value of the investment multiplier in the, economy?, (a) Between 1.7 and 1.9, (c) Between 2.1 and 2.3, Ans. (d) Investment Multiplier =, , MPC = 0.595, So, Investment Multiplier. =, , (b) Between 1.9 and 2.1, (d) Between 2.3 and 2.5, , 1, ; where, 1 − MPC, 1, = 2. 4726, 1 − 0 .595
Page 55 :
CBSE Term-II Economics XII, , 44, (iii) What is the equilibrium value of Y in the economy?, (a) Between 3,250 and 3,750 (b) Between 3,750 and 4,250, (c) Between 4,250 and 4,750 (d) Between 4,750 and 5,250, Ans. (d) At the equilibrium level Y = C + I, , Y = 500 + 0.7 ( Y − 15 Y + 750 ) + 1, 000, Y = 500 + 0.7 Y − 0.105 Y + 525 + 1, 000, 0.405 Y = 2, 025, ∴ Y = 5 , 000, , (iv) If instead of 750 units of money, the government, makes annual transfer payments equal to 10% of Y,, then the value of the investment multiplier will, (a), (b), (c), (d), , decrease by less than unity, decrease by more than unity, increase by less than unity, increase by more than unity, , Ans. (c) Y = C + I, , = 500 + 0 . 7 ( Y − 0 .15 Y + 0 .10 Y ) + 1, 000, = 1,500 + 0.665 Y, A simple glance tells us that autonomous consumption, equals 1,500 and MPC equals 0.665., 1, 1, ∴K =, =, = 2.98, 1 − MPC 1 − 0.665, Change in multiplier = 2.98 – 2.46 = 0.52, , (v) If instead of 750 units of money, the government, makes an annual transfer payments equal to 10% of, Y, then the equilibrium value of Y will, (a), (b), (c), (d), , decrease by less than 1,000, decrease by more than 1,000, increase by less than 1,000, increase by more than 1,000, , Ans. (a) As computed above,, , Y = 1,500 + 0.665 Y, Y − 0.665 Y = 1,500, , ∴, Y = 4477.6, Change in income = 5000 – 4477.6 = 522.4, , (vi) Assertion (A) Higher the MPC, higher would be, the multiplier effect., Reason (R) The multiplier effect is the magnified, increase in equilibrium GDP that occurs when any, component of aggregate expenditures changes., Therefore when MPC increases, the value of, multiplier increases as well., Alternatives, (a) Both Assertion (A) and Reason (R) are true and Reason, (R) is the correct explanation of Assertion (A)., (b) Both Assertion (A) and Reason (R) are true, but Reason, (R) is not the correct explanation of Assertion (A)., (c) Assertion (A) is false, but Reason (R) is true, (d) Both the statements are false, Ans. (a) Both Assertion (A) and Reason (R) are true and Reason, , (R) is the correct explanation of Assertion (A)., , PART 2, Subjective Questions, l, , Short Answer (SA) Type Questions, 1. Define aggregate demand. State its components., (CBSE 2018), , Ans. Aggregate demand refers to the total expenditure on the, , goods and services in an economy during the period of, one year., The main components of aggregate demand are, (i) Consumption expenditure, (ii) Private investment (Fixed Capital Formation +, Change in Stock), (iii) Government expenditure, (iv) Net exports or difference between exports and, imports AD = C + I + G + (X – M), , 2. Which are the important elements in the, determination of investment?, , (NCERT), , Ans. Following are the three elements important in the, , determination of investment, (i) Expected Returns or Revenue An investment is, undertaken on the basis of expected demand or, expected returns to the producers., (ii) Costs It has three components viz. cost of purchase, of equipment, cost of maintenance of equipment, (depreciation) and Cost of funds borrowed for, investment., (iii) Business Expectation Bullish expectations attract, more investment. Bearish expectations cause low, investment., , 3. Distinguish between marginal propensity to, consume and average propensity to consume. Give, a numerical example., (CBSE 2016), Ans. Differences between marginal propensity to consume and, , average propensity to consume, Basis, , Marginal Propensity to, Consume (MPC), , Average Propensity to, Consume (APC), , Meaning, , The ratio between the, change in consumption, expenditure and the, change in income is, called the marginal, propensity to consume., , The ratio between the, total consumption, expenditure and total, income, at a given level, of income is called the, average propensity to, consume., , It, Represents, , It represents the part of, increased income, which is spent on, consumption., , It represents the part of, total income which is, spent on consumption., , Symbolically MPC = Change in, Consumption ( ∆C )/, Change in Income ( ∆Y ), , APC, Total Consumption (C ), =, Total Income(Y )
Page 56 :
45, , CBSE Term-II Economics XII, The numerical example given below will help to, understand the computation of MPC and APC., Income, (Y), , Consumption APC, (C), (C / Y), , 6. If national income is ` 100 crore and consumption, , ∆C, , ∆Y, , MPC, (∆C/∆Y), , 0, , 300, , —, , —, , —, , —, , 200, , 350, , 1.75, , 50, , 200, , 0.25, , 400, , 400, , 1, , 50, , 200, , 0.25, , 600, , 450, , 0.75, , 50, , 200, , 0.25, , 800, , 500, , 0.625, , 50, , 200, , 0.25, , 1000, , 500, , 0.55, , 50, , 200, , 0.25, , ` 90 crore, find the average propensity to save., When income rises to ` 120 crore and consumption, expenditure to ` 108 crore, what will be the, , marginal propensity to consume and marginal, propensity to save?, Ans. Given, National Income (Y) = ` 100 crore, Consumption Expenditure (C) = ` 90 crore, , Saving (S) = Y – C, = 100 – 90, = ` 10 crore, S 10, =, = 0.1, Y 100, Increased Income (Y1) = ` 120 crore, Increased Consumption Expenditure (C1), = `108 crore, Increased Saving (S1) = 120 – 108, Average Propensity to Save (APS) =, , 4. What is the difference between planned investment, and actual investment?, , (NCERT), , Ans., , Basis, Meaning, , Planned Investment, Planned (or ex-ante), investment refers to, the desired level of, investment., , Actual Investment, Actual (or ex-post), investment refers to the, realised level of, investment., , In an accounting year, In an accounting year,, Reaction, with Savings planned investment actual investment is, may or may not be, equal to planned, savings., , Determina- Equilibrium level of, income is determined, tion of, where planned, Income, investment is equal to, planned savings., , always equal actual, savings. (This is, according to the, principle of national, income accounting.), , Actual investment has, no relevance in the, determination of, equilibrium level of, income., , 5. State whether the following statement are true or, false. Give reasons for your answer., (i) The value of average propensity to save can, never be greater than 1., (ii) When investment multiplier is 1 the value of, marginal propensity to consume is 0., Ans., , (i) True. The value of average propensity to save can, never be greater than 1 because even when all the, income is saved and nothing is spent on, consumption, saving will be equal to income. In this, case, Average Propensity to Save (APS) will be equal, to 1 and not greater than 1., (ii) The given statement is true. When investment, multiplier is 1, marginal propensity to consume is 0., We know that,, 1, Multiplier ( K ) =, 1 − MPC, 1, 1=, 1 − MPC, 1 – MPC = 1 MPC = 0, , = `12 crore, Change in Income (∆Y) = 120 – 100, = ` 20 crore, Change in Consumption Expenditure (∆C) = 108 – 90, = `18 crore, Change in Saving (∆S) = 12 – 10, = ` 2 crore, , ∆C 18, =, = 0.9, ∆Y 20, ∆AS, 2, Marginal Propensity to Save (MPS) =, =, = 0.1, ∆AY 20, Therefore,, Average Propensity to Save (APS) = 0.1., Marginal Propensity to Consume (MPC) = 0.9., Marginal Propensity to Consume (MPC) =, , Marginal Propensity to Save (MPS) = 0.1, , 7. An economy is in equilibrium. From the following, data, calculate the marginal propensity to save., Income = ` 10, 000, Autonomous consumption = ` 500, Consumption expenditure = ` 8, 000, (CBSE 2017), Ans. We know that,, , Consumption expenditure = C + bY,, where C = Autonomous Consumption,, b = Marginal Propensity to Consume and, Y = Income, So, on substituting the given variables, we get, 8, 000 = 500 + b. ( 10, 000 ), 8, 000 − 500 = b. 10, 000, 7,500, b=, = 0.75 , i.e., 10, 000, Marginal Propensity to Consume = 0.75 .
Page 57 :
CBSE Term-II Economics XII, , 46, We also know that, MPC + MPS = 1, where,, MPC = Marginal Propensity to Consume, and, MPS = Marginal Propensity to Save, On substituting MPC = 0.75 , we get, 0.75 + MPS = 1,, MPS = 1 − 0.75 = 0.25, i.e,, Marginal Propensity to Save = 0.25, , 8. An economy is in equilibrium. Calculate the, investment expenditure from the following., National income = ` 800, Marginal propensity to save = 0. 3, Autonomous consumption = 100 (CBSE 2015), , (ii) Marginal propensity to consume represents the, slope of the consumption function. (CBSE 2019), Ans., , 11. From the following data, calculate the, (i) consumption expenditure and, (ii) investment expenditure for the economy., (CBSE 2020), , Ans. As the economy is in equilibrium, , Y = AD, Y=C + I, C = C + bY, or,, ...(i), Y = C + bY + I, National Income ( Y ) = 800, Marginal Propensity to Save ( MPS) = 0. 3, Marginal Propensity to Consume, ( MPC ) = 1 − MPS = 1 − 0. 3 = 0.7, Autonomous Consumption, ( C ) = 100, From (i), 800 = 100 + 0.7 ( 800 ) + I, 700 = 560 + I, I = 140, , ∴, i.e., , 9. An economy is in equilibrium. Find ‘autonomous, consumption’ from the following, National income, = 1,000, Marginal propensity to consume = 0.8, Investment expenditure, = 100, (CBSE 2015), Ans. At equilibrium, , Where, Further, Where,, Hence,, , AD = AS( Y ), Y=C+I, C = Consumption expenditure, I = Investment expenditure, C = C + bY, C = Autonomous consumption, b = MPC, Y = C + bY + I, 1, 000 = C + 0.8 ( 1, 000 ) + 100, 1, 000 = C + 800 + 100, C = ` 100, , 10. Giving valid reasons, state whether the following, statements are true or false., (i) Ex-post investment means fixed capital with, production units during a particular period of, time., , (i) The given statement is false, as ex-post investment, includes both fixed as well as inventory investment, with the production unit during a period of time., (ii) The given statement is true, as it represents change, in consumption due to a given change in income., MPC = ∆C / ∆Y, , Ans., , S. No., , Particulars, , (in `), , (a), , Equilibrium Level of Income, , 5,000, , (b), , Autonomous Consumption, , 500, , (c), , Marginal Propensity to Save, , 0.4, , (i) Consumption expenditure ⇒ c = c + by, Here, c means autonomous consumption, b means MPC, Y means income, MPC = 1 − MPS, MPC = 1 − 0.4 = 0.6, Consumption expenditure = 500 + 0.6 × 5 , 000, Consumption expenditure = 500 + 3, 000, = ` 3,500 crores, (ii) At equilibrium level, Y = C + I, 5 , 000 = 3,500 + I, Investment expenditure = 5 , 000 − 3,500 = ` 1,500 crores, , 12. In an economy, the autonomous investment is 360, and the marginal propensity to save is 0.3. If the, equilibrium level of income is 1,400, then the, autonomous consumption is 40. True or false?, Justify your answer., Ans. False. Given, Autonomous Investment= 360, , Marginal Propensity to Save (MPS) = 0.3, Equilibrium Level of Income (Y) = 1,400, Marginal Propensity to Consume (MPC) = 1 – MPS, = 1 – 0.3 = 0.7, At the equilibrium Level, Y = C+I, or,, Y = C+MPC (Y) +I, 1,400 = C + MPC (Y) + I, 1,400 = C + 0.7 (1,400) + 360, 1,400 = C+ 980+360, 1,400 = C+1,340, C = 1,400 – 1,340 = 60, Thus, it is proved that the given statement is false. The, autonomous consumption = 60.
Page 58 :
47, , CBSE Term-II Economics XII, , 13. If in an economy, Marginal Propensity to Consume (MPC) = 08, ., Change in Initial Investment ( ∆I ) = ` 4,000 crores, Find the value of the following., (CBSE 2020), (i) Investment Multiplier (K), (ii) Change in Final Income (∆Y), Ans., , (i) Investment Multiplier (K) = 1/1 − MPC, Here, MPC is given = 0.8, Now,, Investment Multiplier (K) = 1/1 − 0.8, Investment Multiplier (K) = 1/0.2, Investment Multiplier (K) = 5, (ii) Investment Multiplier (K), Change in Income ( ∆Y ), =, Change in Investment ( ∆I ), Putting the value of K, which is determined in above, case, ∆Y, we get 5 =, 4, 000, ∆Y = 4, 000 × 5, ∴ Change in final income ∆Y = ` 20,000 crores, , 14. Give reason, state whether the following are true or, false., (i) Sum of average propensity to consume and, marginal propensity is always equal to 1., (ii) If the ratio of marginal propensity to consume, and marginal propensity to save 3 : 1, the value of, investment multiplier will be 5., Ans., , (i) False. Sum of average propensity to consume and, average propensity to save as well as sum of marginal, propensity to consume and marginal propensity to, save is always equal to one. There is no fixed, relationship between APC and MPC., (ii) False, because, if the ratio of marginal propensity to, consume and marginal propensity to save is 3:1, MPC, will be 0.75 and investment multiplier (K) will be, 1, 1, 1, K=, =, =, =4, 1 − MPC 1 − 0.75 0.25, Assume that MPS = x, So that MPC = 3x, We know MPC+MPS=1, ⇒, 3x + x = 1, ⇒, 4x = 1, 1, ⇒, x = = 0 . 25, 4, MPS = 0 . 25, ⇒, So that MPC = 3 × 0.25 = 0.75, or MPC = 1 – MPS, 1 − 0.25 = 0.75, , 15. The value of marginal propensity to consume is 0.6, and initial income in the economy is ` 100 crores., Prepare a schedule showing income, consumption, and saving. Also show the equilibrium level of, income by assuming investment of ` 80 crores., (CBSE 2018), Ans. MPC = 0.6, Let autonomous consumption = 40, , Y, , C = C′+MPC(y), , S = Y– C, , 0, , 40, , −40, , 100, , 100, , 0, , 200, , 160, , 40, , 300, , 220, , 80, , 400, , 280, , 120, , 500, , 340, , 160, , When economy is in equilibrium, S = I, Y=C + I, Y = 40 + 0.6 Y + 80, Y − 0.6 Y = 120, 0.4 Y = 120, Y = ` 300 crores, Equilibrium level of income is ` 300 crores., , 16. The saving function of an economy is given as, S = −250 + 0.25 Y, If the planned investment is ` 2,000 crores,, calculate the following., (i) Equilibrium level of income in the economy., (ii) Aggregate demand at income of ` 5,000 crores., (CBSE 2019), Ans. (i) At the point of equilibrium,, , Saving = Investment, ( S = I ) − 250 + 0.25 Y = 2, 000, 0.25 Y = 2, 000 + 250, 0.25 Y = 2.250, 2, 250, Y=, = 9, 000, 0.25, Equilibrium level of income = ` 9, 000 crores, (ii) AD at income level ` 5 , 000 crores will be, AD = 250 + ( 1 − 0.25 )( 5 , 000 ) + 2, 000, = 250 + 0.75 × 5 , 000 + 2, 000, = 250 + 5 , 750, = ` 6,000 crores, , 17. In an economy autonomous consumption is 500,, marginal propensity to save is 0.2 and investment, expenditure is 2,000. Calculate its equilibrium level, of income., (CBSE 2015)
Page 59 :
CBSE Term-II Economics XII, , 48, , Given C ′ = 500, MPS = 0.2, I = 2, 000, MPC = 1 − MPS, MPC = 1 − 0.2 = 0.8, Y = C ′ + MPC ( Y ) + I [Q C = C ′ + MPC( Y )], Y = 500 + 0.8Y + 2, 000, Y − 0.8Y = 2,500, 0.2Y = 2,500, Y = 12,500, Equilibrium level of income = ` 12,500, , The point B in the diagram below represents the, break-even point where the consumption expenditure, equals to the income., Y, , Consumption (C), , Ans. When economy is in equilibrium, then Y = C + I, , Ans., , l, , C+, , bY, C, , B(C = Y), C, X, Income (Y), , Diagrammatic presentation of, consumption function, , 2. In an economy, if initial investments are increased, (CBSE 2015), , (i) APS can have a negative value because at zero level of, income there is some amount of consumption which is, known autonomous consumption which shows, dissaving., (ii) MPS cannot have a negative value as there is a positive, relationship between saving and income, an increase in, income must cause an increase in saving. Implying that, MPS must always be positive., , Long Answer (LA) Type Questions, 1. Explain consumption function, with the help of a, schedule and diagram., , (All India 2011), , Ans. The relationship between the consumption expenditure and, , the income is known as consumption function., C = F (Y), When we write consumption function in terms of an, algebraic expression, we write, C = C + bY, Where, C = Consumption expenditure,, C = Autonomous consumption i.e. consumption at zero, level of income,, b = Marginal Propensity to Consume,, Y = Income, Let us understand consumption function with the help of, an imaginary schedule and diagram, Income Consumption APC C , Y ∆C ∆Y, (Y), (C), …, , C=, , O, , 18. Which of the following cannot have a negative value?, Give reasons., (i) Average propensity to save, (ii) Marginal propensity to save, , Y, , …, , …, , MPC, ∆C , , , ∆Y , , 0, , 100, , …, , 100, , 170, , 1.7, , 70, , 100, , 0.7, , 200, , 240, , 1.2, , 70, , 100, , 0.7, , 300, , 310, , 1.33, , 70, , 100, , 0.7, , 400, , 380, , 0.95, , 70, , 100, , 0.7, , 500, , 450, , 0.9, , 70, , 100, , 0.7, , by ` 100 crores, discuss the working of investment, multiplier presuming marginal propensity to, consume is 0⋅8., (CBSE 2020), Ans. Investment multiplier is the ratio between change in, , income and the corresponding change in investment., There is a direct or positive relationship between, Marginal Propensity to Consume (MPC) and Multiplier, (K). Higher the MPC, higher will be the value of, multiplier and vice-versa., Working of Investment Multiplier, Initial, Investment, , Consumption, Expenditure, , I, , 100, , 80, , 20, , II, , 80, , 64, , 16, , III, , 64, , 12.8, , 5.2, , 500, , 400, , 100, , Rounds, , Savings, , As shown in the table, there is additional investment of, ` 100 crores and 80% of which is spent on consumption, i.e, ` 80 crores and ` 20 crores is saved. ` 80 crores is, reinvested of which 80% is consumed and if goes on like, this., Marginal propensity to consume is 0.8, Change in investment = ` 100 crores, 1, 1, K=, =, 1 − MPC 1 − 0.8, 1, K=, =5, 0.2, Change in investment = ∆I = ` 100 crores, Investment multiplier = K = 5, Change in income ∆Y = K × ∆I, = 5 × 100, = ` 500 crores
Page 60 :
49, , CBSE Term-II Economics XII, , 3. (i) On the basis of following information, identify, whether the economy is in equilibrium or not., S.No., , Particulars, , (a), , Autonomous Consumption and, Investment Expenditure (A), , (b), , Marginal Propensity to Save, (MPS), , (c), , National Income, , ` (in crores), 500, 0.2, 4,000, , (ii) Answer the following questions on the basis of, given figure., Y, , Savings, , S=–50+0.2 Y, , O, A, Y', , B, , X, Income, , (a) What does the shaded area AOB indicate?, (b) What is the significance of point B ?, (CBSE 2020), Ans., , (i) The economy is in equilibrium when, AD = AS, ∴, AS = Y = 4, 000, ∴ MPC = 1 − MPS, ∴, AD = A + MPC ( Y ) , = 1 − 0.2 , , , = 0.8, , , , = 500 + 0.8 × 4, 000, = 500 + 3, 200 = ` 3, 700, So, in the above question, AD= 4, 000 and AS = 3, 700, AD ≠ AS, so the economy is not in equilibrium., (ii) (a) The shaded area AOB indicates negative savings, or dissavings., (b) Point B is the point of equilibrium. At point B,, savings are zero and level of aggregate demand is, equal to the level of aggregate supply in the, economy. At this point the value of APS = Zero, S, , APS = Y , , 4. Answer the following questions based on the data, given below., Planned investment = ` 100 crore, C = 50 + 05, . Y, (i) Determine the equilibrium level of income., (ii) Calculate the saving and consumption, expenditure at equilibrium level of national, income., (CBSE 2020), , Ans. (i) At equilibrium level of income,, , Y=C + I, Here, Y = Equilibrium level of income, C = Consumption expenditure at equilibrium level, of income, I = Investment expenditure at equilibrium level, of income, Y = ( 50 + 0 .5 Y ) + 100, Y − 0.5 Y = 150, 0 .5 Y = 150, Equilibrium level of income = ` 300 crores, (ii) C = 50 + 0 .5 Y, Substituting the value of Y in the above equation, C = 50 + 0 .5 × 300, C = 50 + 150, C = 200, Consumption expenditure at equilibrium level of income, = ` 200 crores, Y=C +S, 300 = 200 + S, S = 300 − 200 ; S = 100, Saving at equilibrium level of income = ` 100 crores., , 5. When is an economy in equilibrium ? Explain with, the help of saving and investment functions. Also, explain the changes that take place in an economy, when the economy is not in equilibrium. Use, diagram., Ans. Equilibrium level of income is determined at a point, , where ex-ante or planned saving is equal to planned, investment., Y, , S, Investment, S=I, I, E, , O, S, , Y, , Saving, I, , X, , Income/Output, , Y′, , This is because, in equilibrium, AS = AD or C + S= C + I or S= I, E is the point where S = I, hence, the point at which the, economy is in equilibrium. OY is the equilibrium level of, national income., What happens when S > I?, When savings are greater than investment in an economy,, it refers to AD < AS. There will be a rise in inventory, stock and prices will start to fall. To clear their stocks, the, producers will now plan lesser output.
Page 61 :
CBSE Term-II Economics XII, , 50, , What Happens if S < I? In case S < I, it implies a, situation when withdrawal of expenditure (S) is lesser, than injection of expenditure (I) into the circular flow of, income. Accordingly, overall expenditure in the economy, would exceed than what is required to buy the planned, output. It is a situation of higher AD than AS., To cope with the situation, the producers would now plan, higher output. Higher output would mean higher income, and higher saving. The process will continue till S = I., , 6. Explain the theory of determination of income and, employment with the help of aggregate demand, and aggregate supply curves., Or, Why must aggregate demand be equal to Aggregate, supply at the equilibrium level of income and, output? Explain with the help of a diagram., Ans. In an economy, equilibrium level of income and, , employment is determined when AD (Aggregate, Demand) is equal to AS (Aggregate Supply). According to, Keynes, AS may be assumed to be elastic in an economy, where full employment (of resources) is yet to be, achieved. Accordingly, AD becomes the principal, determinant of equilibrium level of income., , Y, AS, , Aggregate Demand/, Aggregate Supply, , This will mean lesser income in the economy. Lesser, income implies lesser saving. The process will continue, till S = I., , E, , =, , C, , +, , A, , S, , D=, , C+, , I, , AD = AS, Point of, equilibrium, Y, 45°, , O, , Y1 Y Y2, Income/Output, , X, , In the above figure, AD represents aggregate demand, curve and 45° line is the line of reference, where AS =Y., Equilibrium level of income Y is determined at point E,, where AD = AS. Prior to point E, aggregate demand, exceeds aggregate supply, leading to an increase in level of, income upto point E. Beyond point E, Aggregate Supply, exceeds Aggregate Demand leading to a fall in income, back towards point E., It is only when AS = AD, that the equilibrium is struck,, because the equality between AS and AD implies that the, desired level of output in the economy (as indicated by AS) is, exactly equal to the desired level of expenditure (indicated, by AD) in the economy. So, the entire output as planned by, the producers (during an accounting year) is purchased by, the buyers. There are no undesired or unwanted inventories, (stock of goods) with the producers.
Page 62 :
Chapter Test, Multiple Choice Questions, , 1., , If Autonomous Consumption (C) is greater than zero, it indicates that the level of national income in an economy will be, ……… ., (a) rising, (c) constant, , 2., , (b) falling, (d) Any of these, , According to classical economists, real wage rate is ……… to the marginal productivity of labour., (a) equal, , 3., , (b) more, , (c) less, , (a) negative infinity, positive infinity, (c) negative infinity, one, , 4., , (b) one, positive infinity, (d) zero, one, , Saving is a ............. function of disposable income., (a) positive, (c) constant, , 5., , (d) None of these, , Value of marginal propensity to consume varies from ……… to ……… ., , (b) negative, (d) None of these, , Which of the following statements is/are correct?, (i) Autonomous investment is the expenditure incurred on creation of capital assets., (ii) If the level of investment in an economy is greater than savings, the level of income will also rise so long as full, employment is not achieved., Alternatives, (a) Both are true, (c) (i) is true, but (ii) is false, , (b) Both are false, (d) (i) is false, but (ii) is true, , Short Answer (SA) Type Questions, , 1., , Define multiplier. What is the relation between marginal propensity to consume and multiplier? Calculate the marginal, propensity to consume if the value of multiplier is 4., , 2., , If in an economy, Change in Initial Investment ( ∆I ) = ` 700 crores Marginal Propensity to Save (MPS) = 0.2, Find the values of the following, , 3., , Giving reason, sate whether the following statement are true or false, , (ii) Change in Final Income ( ∆Y ), , (i) Investment Multiplier ( K ), , (i) Value of average propensity to save can never be less than zero., (ii) When marginal propensity to consume is zero, the value of investment multiplier will also be zero., , 4., , In an economy investment is increased by ` 300 crore. If marginal propensity to consume is 2/3, calculate increase in, national income., , 5., , An economy is in equilibrium. Calculate the marginal propensity to save from the following., National Income = ` 1, 000, Autonomous Consumption = 100, Investment = 120, , Long Answer (LA) Type Questions, , 1., , Draw a straight line saving curve for an economy and derive the consumption curve. Explain the method of derivation., Show a point on the consumption curve at which average propensity to consume is equal to 1., , 2., , Assuming that increase in investment is ` 1,000 crore and marginal propensity to consume is 0.9, explain the working of, multiplier., , Answers, Multiple Choice Questions, 1. (d), , 2. (a), , 3. (d), , 4. (a), , 5. (a), , For Detailed Solutions, Scan the code
Page 63 :
CBSE Term-II Economics XII, , 52, , CHAPTER 04, , Equilibrium and, Disequilibrium, in the Economy, In this Chapter..., Basic Concepts, Excess Demand, Deficient Demand, Measures to Correct Deficient, and Excess Demand, , Basic Concepts, , 4. Full Employment Equilibrium It refers to that, situation in the economy where Aggregate Supply (AS), is equal to Aggregate Demand (AD) or Saving (S) is, equal to Investment (I), along with fuller utilisation of, labour force., 5. Under Employment Equilibrium It refers to that, situation in the economy where Aggregate Supply (AS), is equal to Aggregate Demand (AD) or Saving (S) is, equal to Investment (I), but without fuller utilisation of, labour force., 6. Over Employment Equilibrium It refers to a situation,, when Aggregate Demand (AD) is equal to Aggregate, Supply (AS), beyond the full employment level of, , output in the economy, which is expected in the, long-term potential output., , Excess Demand, It refers to the situation when Aggregate Demand (AD) is in, excess of Aggregate Supply (AS) corresponding to full, employment in the economy, i.e., AD > AS., , Inflationary Gap, This gap is the excess of actual AD over and above its level, required to maintain full employment equilibrium in the, economy or it is difference between AD beyond full, employment and AD at full employment., Y, Inflationary, gap, , Aggregate Demand/, Aggregate Supply, , Following basic concepts are essential before studying the, problem of deficient demand and excess demand, 1. Full Employment It refers to a situation where all, those who are able to work and are willing to work, are, getting work., 2. Voluntary Employment It refers to the situation when, some people are not willing to work at the existing, wage rate., 3. Involuntary Unemployment It refers to the situation, where some people are not getting work, even when, they are willing to work at the existing wage rate., , AS = Y = C + S, AD1 (above full employment), = C1 + I1, AD (at full employment), =C+I, , E′, F, , {E, , Excess demand, , 45°, O, , S, R, Income and Employment, , Inflationary Gap, , X
Page 64 :
53, , CBSE Term-II Economics XII, Causes of Excess Demand and Inflationary Gap, Increase in investment demand., Increase in consumption demand., Increase in export demand., Increase in disposable income., Increase in money supply., Increase in government’s demand for goods and services., Increase in private demand., l, , l, , l, , l, , l, , l, , l, , Consequences of Excess, Demand and Inflationary Gap, When Aggregate Demand (AD) increases beyond full, employment level, output remains constant., This creates excess pressure on demand at existing level, of output., This excess pressure causes a rise in prices implying a, situation of inflation., Inflation further increases the cost of production,, worsening the situation., l, , l, , l, , l, , Deficient Demand, It refers to the situation when Aggregate Demand (AD) is, short of Aggregate Supply (AS) corresponding to full, employment in the economy, i.e., AD < AS., , Deflationary Gap, The extent to which current aggregate demand falls short of, the actual aggregate demand required for full employment, level, is termed as deflationary gap. It measures the size of, deficient demand., Y, , Aggregate Demand/, Aggregate Supply, , AS = Y =C+S, AD (at full employment), =C+I, AD1 (at under employment), = C1 + I1, , E, , }, E′, , F, Deflationary, gap, , 45°, O, , S, R, Income and Employment Deflationary Gap, , Causes of Deficient, Demand and Deflationary Gap, Decrease in investment demand., Decrease in public expenditure., Decrease in export demand., Decrease in consumption demand., Decrease in disposable income., Decrease in supply of money., Decrease in credit creation., l, , l, , X, , Consequences of Deficient, Demand and Deflationary Gap, Actual stock increases, i.e., there is a situation of unwanted, stock pile up with producers., This forces the producers to reduce their current output, levels., This causes a situation of reduction in employment, further, worsening the situation., l, , l, , l, , Measures to Correct Deficient, Demand and Excess Demand, There are two policy measures to solve the problem of excess, demand and deficient demand which are as follows, , Monetary Measures, In a situation of excess and deficient demand, the RBI uses, various instruments of monetary policy. It refers to the, economic policy of the government relating to currency and, credit money., The instruments of monetary policy are as follows, 1. Quantitative Instruments, It includes the following, (i) Bank Rate Policy It is the rate at which commercial, banks borrow from Central Bank for a period of more, than 90 days. In a situation of deficient demand, the RBI, reduces the bank rate or market interest rate., In case of excess demand, the RBI increases the bank, rate or interest rate which makes the credit dear., (ii) Open Market Operations It refers to buying and selling, of government approved securities in the open market, by the RBI to general public and commercial banks. In, the situation of deficient demand, RBI buys securities, from the open market and releases funds for the banks, and the individuals. In a situation of excess demand, RBI, sells the eligible securities in its possession to, commercial banks., (iii) Cash Reserve Ratio (CRR) It is the fraction of total, deposits that each commercial bank must keep with RBI,, as a part of fractional reserve system. During deficient, demand, RBI reduces the CRR. In a situation of excess, demand, RBI raises the CRR., (iv) Statutory Liquidity Ratio (SLR) It refers to the fraction, of total deposits which each commercial bank must keep, with itself in liquid assets like gold, government securities,, etc. RBI reduces SLR in situations of deficient demand., In a situation of excess demand, RBI raises the SLR., , l, , l, , l, , l, , l, , 2. Qualitative Instruments, It includes the following, (i) Marginal Requirement It is the difference between the, market value of securities provided by the borrower and, the amount of loan granted to him.
Page 65 :
54, There will be reduction in marginal requirement, in a situation of deficient demand while it is raised, to correct the situations of excess demand., (ii) Moral Suasion In this, RBI issues directives to, bank to follow rules and regulations. During, deficient demand, the RBI issues instructions to, member banks to increase the availability of credit, to borrowers for non-essential purposes also. But,, in case of excess demand, RBI imposes restrictions, on commercial banks on granting loans., (iii) Selective Credit Controls It refers to a method in, which the Central Bank gives directions to other, banks to give or not to give credit for certain, purposes to particular sectors. It imposes rationing, of credit to prevent excessive flow of credit., , Fiscal Measures, Fiscal policy is the government’s revenue and, expenditure policy. In a situation of excess demand,, government uses various instruments of fiscal policy to, reduce budgetary deficit. The instruments of fiscal, policy used to control deficient and excess demand are, 1. Revenue Policy In a situation of deficient demand,, the government should reduce taxes which will, , CBSE Term-II Economics XII, increase the purchasing power of the people and they will, spend more on consumption of goods and services. Thus,, aggregate demand will rise., In a situation of excess demand, government raises the rates, of all taxes which reduces the purchasing power of the, people and reduces both consumption and investment, expenditures., 2. Expenditure Policy In a situation of deficient demand, the, government should raise its expenditure which will raise, the level of employment. It will in turn, increase the wages, and the purchasing power. Thus, aggregate demand will, rise., In a situation of excess demand, government reduces its, public expenditure which will result in fall in demand for, goods and services. The fall in government expenditures, should be equal to the inflationary gap., 3. Deficit Financing To correct deficient demand,, government should take resort to deficit financing or, printing of notes to increase purchasing power of the, economy., In order to correct excess demand, government should, reduce the deficit financing or printing of notes to bring the, excess demand down.
Page 66 :
55, , CBSE Term-II Economics XII, , Chapter, Practice, PART 1, Objective Questions, , Ans. (d) Deficit demand occurs due to fall in government, , expenditure, fall in level of autonomous investment, fall in, supply of money and credit and decrease in marginal, propensity to consume., , 5. …… refers to selling of government approved, l, , Multiple Choice Questions, 1. In the AD-AS model, the level of aggregate, demand can influence the level of output., , (a) If and only if aggregate supply has a positive, relationship with the price level, (b) If and only if the price level is constant, (c) If and only if aggregate supply is not invariant with, changes in the price level, (d) If and only if aggregate supply is invariant with, changes in the price level, Ans. (a) In the model, aggregate demand = aggregate supply., The level of aggregate demand can influence the level of, output only if aggregate supply has a positive, relationship with the price level, , 2. When does a situatioin of deficient demand arise, in an economy?, (a) AD > AS, (b) S > I, (c) AD < AS, (d) S < I, Ans. (c) Deficient demand arises when AD is short of AS, corresponding to full employment in the economy., , 3. If an individual deposits a sum of money in a bank,, then the amount of traditional credit that the, banking system can create is, (a) fraction of that sum defined by the cash reserve ratio, (b) a fraction of that sum defined by the statutory liquidity, ratio, (c) a multiple of the sum defined by the cash reserve ratio, (d) None of the above, Ans. (d) The process of credit creation is a multiple of that, , sum defined by the sum of cash reserve ratio and, statutory liquidity ratio., , 4. The main cause(s) of deficit demand is/are, (a) decrease in money supply, (b) increase in public expenditure, (c) decrease in investment demand, (d) Both (a) and (c), , securities by RBI to general public and commercial, banks in case of excess demand., (a) Bank rate, (b) CRR, (c) SLR, (d) Open market operation, Ans. (d) Open market operation, , 6. In order to correct the situation of excess demand, (i) cost of credit is raised, (ii) availability of credit is raised, (iii) availability of credit is reduced, Alternatives, (a) Only (iii), (b) Only (i), (c) Both (i) and (iii), (d) (i), (ii) and (iii), Ans. (c) Both (i) and (iii), , 7. By increasing the tax burden on the producers, the, government intends to, (i) correct the situation of inflationary gap, (ii) correct the situation of excess demand, Which statement is true?, (a) Both (i) and (ii), (b) Only (i), (c) Only (ii), (d) None of the above, Ans. (a) Both (i) and (ii), , 8. In case of an underemployment equilibrium, which, of the following alternative is not true?, (a), (b), (c), (d), , (CBSE 2020), Aggregate demand is equal to aggregate supply., There exist excess production capacity in the economy., Resources are not fully and efficiently utilised., Resources are fully and efficiently utilised., , Ans. (d) Resources are fully and efficiently utilised.
Page 67 :
CBSE Term-II Economics XII, , 56, 9. Match the following., , 14. The central bank can increase availability of credit, , Column I, A. Inflationary gap, , (i) Boom, recession, depression,, recovery, , B. Deflationary gap, , (ii) Excess demand, , C. Taxation, , (iii) Deficit demand, , D. Business cycle, , (iv) Revenue policy, , Codes, A B, (a) (i) (ii), (c) (iii) (ii), Ans. (b) (ii) (iii), , C, D, (iii) (iv), (iv) (i), (iv) (i), , by, , Column II, , A, B C, (b) (ii) (iii) (iv), (d) (ii) (iii) (i), , (a), (b), (c), (d), , Ans. (c) buying government securities, , 15. Which fiscal measure should be adopted for, correcting deficient demand?, D, (i), (iv), , (a) Government should spend more on public works., (b) Taxation should be reduced., (c) Public debt should be reduced., (d) All of the above, Ans. (d) All of the above, , 10. To reduce credit availability in the economy, the, central bank may ............. ., (a), (b), (c), (d), , (CBSE 2018), raising repo rate, raising reverse repo rate, buying government securities, selling government securities, , 16. Match the following., , (CBSE 2020), , Column I, , buy securities in the open market, sell securities in the open market, reduce reserve ratio, reduce repo rate, , Column II, , A. Corrective measure for, deficient demand, , (i) Deficit demand, , B. Qualitative method of, controlling credit, , (ii) Credit rationing, , Ans. (b) sell securities in the open market, , 11. The Cash Reserve Ratio (CRR) refers to, , C. Inflationary gap shows, the measurement of, , (iii) Monetary measures, , (a) the liquid cash that banks have to maintain with the, Reserve Bank of India as a certain percentage of their, demand and time deposits., (b) the cash that banks have to keep in their vaults in order, to meet sudden demand from depositors in times of, crisis., (c) the cash that households have to keep in reserve to meet, sudden increases in the price of essential goods and, services., (d) the cash that the government keeps in reserve so as to be, ready to meet unexpected contingencies., Ans. (a) Cash Reserve Ratio (CRR) refers to the liquid cash, , that banks have to maintain with Reserve Bank of India, as a percentage of their demand and time deposits., , 12. The money multiplier in an economy increases with, (a) increase in cash reserve ratio, (b) increase in statutory liquidity ratio, (c) increase in banking habits of the population, (d) increase in the population of the country, Ans. (c) Money multiplier in an economy increases with the, increase in the banking habits of the population. It, measures the amount of money that commercial banks, would create out of their deposits after keeping certain, fractions as reserve. So, as the banking habits of the, people increase, the deposits will also increase leading to, an increase in the value of money multiplier., , 13. Which of the following is not a tool of monetary, policy?, (a) Tax rate, (b) Interest rate, (c) Cash reserve ratio, (d) Open market operations, Ans. (a) It is not a tool of monetary policy as it does not affect, the demand and supply of money., , Codes, A, (a) (i), (c) (iii), Ans. (b) (iii), , B C, (ii) (iii), (i) (ii), (ii) (i), , A B C, (b) (iii) (ii) (i), (d) (ii) (iii) (i), , 17. With which component of monetary policy, central, bank tries to attain economic stability in the country?, (a) Supply of money, (b) Interest rate, (c) Availability of money, (d) All of these, Ans. (d) Supply of money, interest rate and availability of money., , 18. Inflationary gap shows the measurement of, (a) deficit demand, (b) surplus demand, (c) full employment, (d) None of the above, Ans. (a) deficit demand, l, , Assertion-Reasoning MCQs, Directions (Q.Nos. 1 to 7) There are two statements, marked as Assertion (A) and Reason (R). Read the, statements and choose the appropriate option from the, options given below, (a) Both Assertion (A) and Reason (R) are true and Reason, (R) is the correct explanation of Assertion (A)., (b) Both Assertion (A) and Reason (R) are true, but, Reason (R) is the not the correct explanation of, Assertion (A)., (c) Assertion (A) is true, but Reason (R) is false., (d) Both the statement are false.
Page 68 :
57, , CBSE Term-II Economics XII, , 1. Assertion (A) AS increases proportionate to the, , Ans. (d) SLR is decreased to correct the situation of deflationary, , gap. Lower SLR increases credit creation capacity of, commercial banks which in turn would increase AD and, correct the deflationary gap., , increase in AD as long as there is excess capacity, in the economy., Reason (R) Excess capacity arises because of the, deficiency of demand, so that as demand, increases, supply increases proportionately., , 7. Assertion (A) During periods of economic depression,, economy is caught in a low level equilibrium trap as, investment in the private sector tends to slide to its, bottom., Reason (R) The government can break the deadlock of, low demand side factors by pumping investment into, an economy and there by raising AD till such time the, private investment is revived to achieve higher level, of output and employment., , Ans. (a) Both Assertion (A) and Reason (R) are true and, , Reason (R) is the correct explanation of Assertion (A)., , 2. Assertion (A) In a situation of deficient demand,, there is underemployment equilibrium in an, economy., Reason (R) Owing to deficient AD, equilibrium, between desired AD and desired AS is struck at, a lower level of GDP, lower than the full, employment in an economy., Ans. (a) Both Assertion (A) and Reason (R) are true and, , Reason (R) is the correct explanation of Assertion (A)., , 3. Assertion (A) During periods of economic, downturn, Central Bank raises cash reserve ratio, as a monetary policy tool to stabilise the, economy., Reason (R) This in turn will increase the credit, creation power of the commercial banks and, thus reduces the level of AD in an economy., Ans. (d) Central Bank decreases CRR during periods of, , recession which in turn will increase the credit, creation power of commercial banks and thus expand, the level of AD in the economy., , 4. Assertion (A) Fiscal policy focuses on both the, principles of economic growth and stability., Reason (R) Stability is achieved by correcting, the situation of inflationary and deflationary gap,, while growth is achieved by way of lower, taxation and higher subsidies to the producers., Ans. (a) Both Assertion (A) and Reason (R) are true and, , Reason (R) is the correct explanation of Assertion (A)., , 5. Assertion (A) During the pandemic, income of, the people have fallen and as a result there has, been a reduction in aggregate demand., Reason (R) According the Keynesian economics,, government should follow expansionary fiscal, policy implying a higher level of government, expenditure and lower level of taxes., Ans. (a) Both Assertion (A) and Reason (R) are true and, , Reason (R) is the correct explanation of Assertion (A)., , 6. Assertion (A) SLR is increased to correct the, situation of deflationary gap., Reason (R) Higher SLR increases credit creation, capacity of commercial banks which in turn, increases liquidity in the capital market., , Ans. (a) Both Assertion (A) and Reason (R) are true and Reason, , (R) is the correct explanation of Assertion (A)., l, , Case Based MCQs, 1. Direction Read the following text and answer the, question no. (i) to (vi) on the basis of the same., When an economy undergoes a deflationary shock, the, implications can be both positive and negative for, consumers and businesses., There is a big difference between the, terms disinflation and deflation, which we will first go, over before getting into the causes and effects of, deflationary shocks, and how these shocks can affect, the economy, consumers and businesses., Disinflation usually occurs during a period of, recession and manifests itself by slowing down the, rate at which prices increase; this occurs as a result of, a decrease in consumer sales., If the inflation rate drops to a lower level than before,, technically that difference is disinflation. Deflation,, on the other hand, can be thought as the opposite of, inflation or as negative inflation and it occurs when, the supply of goods or services rises faster than, the supply of money., (i) ……… helps to correct the situation of deflationary, shock in a country through its credit control policy., , (a) Central bank, (b) Commercial bank, (c) Either (a) or (b), (d) None of the above, Ans. (a) Central bank, , (ii) Which of the following statements stands true during, deflationary gap?, (a) Actual output falls short of potential output, (b) Potential output falls short of actual output, (c) Actual demand is less than expected demand, (d) Expected demand is less than actual demand, Ans. (c) Actual demand is less than expected demand
Page 69 :
CBSE Term-II Economics XII, , 58, (iii) Which of the following steps should be taken by, central bank to boost demand in the economy, during deflationary gap?, (a) Decrease tax rate, (b) Deficit financing, (c) Decrease legal reserve requirements, (d) Increase foreign exchange reserve, Ans. (c) Decrease legal reserve requirements, , (iv) What will be the impact on money supply during, deflationary gap?, (a) Increase, (c) Remain constant, Ans. (b) Decrease, , (b) Decrease, (d) Can’t be predicted, , (v) All types of physical goods imported and exported, are known as ........... items., (a) visible, (c) Both (a) and (b), Ans. (a) visible, , (b) invisible, (d) None of these, , (vi) Assertion (A) Excess demand raises the market, value of the output., Reason (R) In situation of excess demand, output, level remaining constant, higher demand leads to a, rise in the general price level, implying a situation, where market value of the output increases in the, economy., Alternatives, (a) Both Assertion (A) and Reason (R) are true and Reason, (R) is the correct explanation of Assertion (A)., (b) Both Assertion (A) and Reason (R) are true, but Reason, (R) is not the correct explanation of Assertion (A)., (c) Assertion (A) is false, but Reason (R) is true, (d) Both the statements are false, Ans. (a) Both Assertion (A) and Reason (R) are true and Reason, (R) is the correct explanation of Assertion (A)., , 2. Direction Read the following text and answer the, question no. (i) to (vi) on the basis of the same., In the simple Keynesian model of income, determination, we assume that there is no, government activity in the economy. If we remove, this assumption to see how the equilibrium level of, income can be determined in the presence of, economic activity of the government, it can be seen, that, the government collects money from the, economy and spends money into the economy., Government expenditures and receipts have an, important effect on the economy., Government budget has two sides viz. the, expenditure side and the receipt side. Money, inflows in the receipt side of the budget are of, three types, i.e. taxation, public borrowing and, sales of goods and services; money outflow in the, , expenditure side of the budget are also of three, types i.e., purchase of goods and services, transfer, payment and repayment of debts. Taxation is a, compulsory contribution made by the people to the, government against which no direct payments are, made by the government., A taxpayer becomes poorer by the amount of taxes., Hence, the income available in the hands of the, people is reduced by the amount of taxes paid., Public borrowing is made through the sale of new, government bonds, which people voluntarily, purchase. Neither their income nor their wealth is, deduted thereby. They simply alter the form and, composition of wealth in the private sector., An increase in the net indebtedness of the, government to the central bank takes place through, the creation of new money by the central bank., (i) If government increase its expenditure on, infrastructural development project, how will this, impact the aggregate demand?, (a) Increase, (b) Decrease, (c) Remains constant, (d) Increase in a three-sector closed economy, Ans. (d) Increase in a three-sector closed economy, , (ii) What will be the impact on aggregate demand, if, the government increase tax rates as it is a main, source of government’s revenue?, (a) Increase, (b) Decrease, (c) Remains constant, (d) Either increase or decrease, Ans. (b) Decrease, , (iii) Public borrowings by the government will lead to, ………… money supply in the economy., (a) increase, (b) decrease, (c) remains constant, (d) increase in a three-sector closed economy, Ans. (a) increase, , (iv) Which of the following statements is/are correct?, (i) Government raises money through sale of treasury, bills and other securities., (ii) Treasury bills are considered as risk free and the, return so achieved is referred as risk free rate of, return., , Alternatives, (a) Both are true, (b) Both are false, (c) (i) is true, but (ii) is false (d) (i) is false, but (ii) is true, Ans. (a) Both are true
Page 70 :
59, , CBSE Term-II Economics XII, (v) The Keynesian solution to deal with a problem of, deficient demand or to correct recessionary gap is to, (a) enhance the level of government expenditure, (b) lower the level of taxes, (c) Both (a) and (b), (d) None of the above, Ans. (c) Both (a) and (b), , (vi) Assertion (A) Central Bank buys government, securities in the open market to correct the, situation of inflationary gap., Reason (R) By buying the securities, the banks, soaks liquidity from the market which is required, to correct inflationary gap., Alternatives, (a) Both Assertion (A) and Reason (R) are true and Reason, (R) is the correct explanation of Assertion (A)., (b) Both Assertion (A) and Reason (R) are true, but Reason, (R) is not the correct explanation of Assertion (A)., (c) Assertion (A) is false, but Reason (R) is true, (d) Both the statements are false, Ans. (d) Central Bank sells government securities in the open, , market to correct the situation of inflationary gap. It is by, selling the securities that the banks soaks liquidity from, the market which is required to correct inflationary gap., , PART 2, Subjective Questions, l, , Short Answer (SA) Type Questions, 1. Explain the concept of inflationary gap. Explain the, role of repo rate in reducing this gap., , (CBSE 2015), , Ans. Inflationary gap is the excess of aggregate demand over, , and above its level required to maintain full employment, equilibrium in the economy. It causes excess demand in, the economy. Owing to excess demand, price levels tend, to rise without any rise in the level of income or, employment in the economy., Repo rate is the rate at which the central bank lends, money to the commercial banks. To correct the situation, of inflationary gap, repo rate is increased. As a follow-up, action, the commercial banks raise the market rate of, interest (the rate at which the commercial banks lend, money to the consumers and the investors) which, reduces demand for credit., Consequently, consumption expenditure and investment, expenditure are reduced implying a reduction in, aggregate demand, as required to correct inflationary, gap., , 2. Keynesian theory tell us that inflationary gap, emerges only when full employment is reached., But, in India we often find high rate of inflation, , along with high rate of unemployment. How can, you explain this paradox?, Ans. Keynesian theory is related to the problem of developed, , economies. In these economies, unemployment occurs, because of the lack of Aggregate Demand (AD). Lack of, AD leads to a cut in planned output. Accordingly, lay-off, occurs and excess capacity emerges. In such situations,, increase in expenditure (implying increase in AD) would, lead to increase in planned output,without any increase in, the price level., The inflationary gap would emerge only when AD, continues to rise even when excess capacity is totally, exhausted and full employment is reached., In developing countries like India , unemployment, occurs not because of the lack of AD, but because of the, lack of production capacity or the lack of capital. Unlike, developed countries, there is no excess capacity in less, developed countries like India. Accordingly, price level, starts rising following increase in AD, even when there is, unemployment in the economy., , 3. What is ‘deficient demand’? Explain the role of, ‘bank rate’ in removing it., , (CBSE 2015), , Ans. Deficient demand refers to a situation when Aggregate, , Demand (AD) is short of Aggregate Supply (AS), corresponding to full employment in an economy., Bank rate is the rate at which the central bank lends, money to the commercial banks. To correct the situation, of deficient demand, bank rate is decreased. As a, follow-up action, the commercial banks lower the market, rate of interest (the rate at which the commercial banks, lend money to the consumers and the investors). This, increases demand for credit., Consequently, consumption expenditure and investment, expenditure are increased, implying an expansion in, aggregate demand, as required to correct deficient, demand., , 4. Explain the concept of deflationay gap and the role, of ‘open market operations’ in reducing this gap., (CBSE 2015), Ans. Deflationay gap is the shortfall in aggregate demand, , from the level required to maintain full employment, equilibrium in the economy. It causes deficient demand in, the economy . Owing to deficient demand, planned level, of output is reduced. Along with reduction in the level of, output, level of income and employment also tend to, reduce. The economy is driven into a state of low level, equilibrium trap., Open market operations is the policy that focuses on, increasing and decreasing the stock of liquidity (or cash, balances) with the people as well as with the commercial, banks, through sale and purchase of securities by the, central bank. During the situation of deflationary gap,, when cash balances need to be increased (to stimulate the, level of aggregate demand), the central banks starts buying, securities. Purchase of securities injects purchasing power, into the money market.
Page 71 :
CBSE Term-II Economics XII, , 60, Cash balances of the commercial banks start picking up., This enhances their capacity to create credit. Flow of, credit increases, leading to increase in AD and, deflationary gap is corrected., , 5. What is ‘excess demand’? Explain the role of, , 8. If government spending leads to multiple times, increase in GDP,, curbed?, , Ans. Government spending leads to multiple times increase, , in GDP only when there is excess capacity in the, economy or when planned output is low owing to lack of, Aggregate Demand (AD)., But, in situations when excess capacity does not exist, (or when AD is not deficient), government spending, would only contribute to inflationary spiral in the, economy. In such situations (when inflation needs to, be curbed), the government must curb fiscal deficit., , ‘reverse repo rate’ in removing it., Ans. Excess demand refers to the situation when aggregate, , demand is in excess of aggregate supply corresponding to, full employment., Reverse repo rate is the rate of interest at which, commercial banks can park their surplus funds with the, central bank, for short period of time. To correct the, situation of excess demand, reverse repo rate is increased., As a follow-up action, the commercial banks will be, encouraged to increase their deposits with the central, bank. This, in return, will reduce their ability to lend, money. Consequently, consumption expenditure and, investment expenditure will be reduced, implying a, reduction in aggregate demand, as required to correct, excess demand., , 6. What is ‘deficient demand’'? Explain the role of, ‘margin requirements’ in removing this gap., (CBSE 2015), Ans. Deficient demand refers to a situation when Aggregate, , Demand (AD) is short of Aggregate Supply (AS), corresponding to full employment in an economy., Margin requirements refer to minimum down payment, that the borrowers have to make as a percentage of their, total borrowing from the commercial banks. To correct the, situation of deficient demand, margin requirement is, reduced. Lower margin requirement acts as an incentive, to borrow. This induces borrowers to raise more credit, implying a rise in aggregate demand, as desired to correct, deficient demand., , 7. Giving valid reasons, state whether the following, statements are true or false., (i) An excess of aggregate demand over full, employment level of aggregate supply, represents a situation of inflationary gap., (ii) If the ratio of Marginal Propensity to Consume, (MPC) and Marginal Propensity to Save (MPS), is 4 : 1, then the value of investment multiplier, will be 4., (CBSE 2019), Ans., , (i) The given statement is true, an excess of aggregate, demand over full employment level of aggregate supply, represents the situation of inflationary gap because when, economy is working at full employment level, there is no, chance of increase in production and aggregate demand, still increases then producers have to increase the general, price level to control the situation., (ii) The given statement is false., Ratio of MPC and MPS is 4:1, 4, 1, 1, MPC = 0.8; MPS = = 0. 2 ⇒ K =, 5, 5, MPS, K = 1 / 0.2 = 5, , Thus, the value of multiplier is 5 not 4., , why should fiscal deficit be, , 9. Explain all the changes that takes place in an, economy when aggregate demand and aggregate, supply are not equal., Ans., , (i) If aggregate demand is greater than aggregate supply, i.e., AD > AS, flow of goods and services in the, economy tends to be less than their demand. The, existing stocks of the producers would be sold out and, the producers would suffer the loss of unfulfilled, demand., To rebuild the desired stocks and avoid the loss of, unfulfilled demand, the producers would plan greater, production. AS would increase to become equal to, AD. This is how AS converges with AD., (ii) If aggregate demend is less than aggregate supply, i.e.,, AD < AS, flow of goods and services in the economy, tends to exceed their demand. As a result, some of the, goods would remain unsold., To clear unwanted stocks, the procedures would plan, a cut in production. Consequently, AS would reduce to, become equal to AD. This is how AS adapts itself to, AD., , 10. Covid-19 has significantly impacted the income, level of the households and thus have reduced the, level of household and investment expenditure and, thereby the level of AD., Examine the economic implications of increase in, government investment expenditure when the, economy is in a state of depression., Ans. During depression, the economy faces a deficient, , demand situation. To correct this situation,the, government takes various fiscal measures. Increase in, government investment expenditure is the principal, instrument to correct the deficiency in demand., Increase in government investment expenditure acts as a, pump priming when the inducement to invest is low,, owing to deficiency of demand., It breaks the vicious circle of ‘low demand-low, inducement to invest-low production-low income-low, demand’. The economy is pulled out of the state of, depression., The GDP growth accelerates in response to increase in, AD, trigged by increase in government investment, expenditure.
Page 72 :
61, , CBSE Term-II Economics XII, , 11. How can the problems of excess and deficient, , 14. Explain the role of taxation in reducing excess, , demand be combated?, Ans. Monetary and fiscal instruments are the key to combat, , demand., , Ans. Excess demand refers to the situation when Aggregate, , the problems of excess and deficient demand. Fiscal, instruments revolve around revenue and expenditure, policy of the government. Monetary instruments relate to, the regulation of money supply in the economy., To combat excess demand, the government needs to curb, its expenditures and raise its revenue. On the monetary, front, it needs to pursue a ‘Dear Money Policy’, making, availability of credit tougher than before and shrinking the, credit creation capacity of the commercial banks., To combat deficient demands, on the other hand,, expenditure needs to be stimulated while revenue needs, to be curbed. On the monetary front, cheap money policy, needs to be pursued, facilitating easy availability of credit, and enhancing credit creation capacity of the commercial, banks., , Demand (AD) is in excess of Aggregate Supply (AS), corresponding to full employment in the economy., Y, , Aggregate Demand/, Aggregate Supply, , AS = Y = C + S, , Ans. The problem of excess demand can be corrected through, , the following measures, , or false with a reason., (i) Excess demand raises the market value of output., (ii) Prices and output increase in a situation of inflationary, gap in an economy., Ans. (i) True, excess demand raises the market value of the, output. Because in a situation of excess demand, output, level remaining constant, higher demand (higher than, the supply) leads to a rise in general price level,, implying a situation when market value of the output, increases in the economy., (ii) False, inflationary gap is the excess of AD over and, above its level required to maintain full employment, equilibrium in the economy. Inflationary gap generates, extra pressure on the existing flow of goods and, services at the level of full employment. Accordingly,, prices tend to rise but output will not increase. Output, remains constant corresponding to full employment, level in the economy., , F, , {E, , Excess demand, , S, R, Income and employment, For employment, , X, , In a situation of excess demand, government raises the, rates of all taxes., This reduces the purchasing power of the people and, reduces both consumption and investment expenditures., A fall in consumption and investment expenditures, reduces the level of aggregate demand and helps to check, the problem of excess demand., , an economy can be corrected., , 13. Read the following statements carefully. Write true, , AD1 (above full employment), = C1 + I 1, AD (at full employment), =C+I, , E′, , 45°, O, , 12. Explain three measures by which excess demand in, , (i) Public expenditure on public works, public welfare and, public investment should be reduced. Reduction in, expenditure will lead to a fall in aggregate demand., (ii) The direct and indirect taxes should be increased. It, will lead to decrease in disposable income and thereby,, decrease in demand., (iii) The repo rate should be increased. It will induce an, increase in the market rate of interest. Consequently,, demand for the funds for the purpose of consumption, expenditure and investment expenditure will reduce., Implying a fall in aggregate demand., , (CBSE 2016), , 15. State which of the following statements are true or, false? Give valid reasons., (CBSE 2019), (i) According to Keynesian theory of employment,, a state of under-employment can never exist in, an economy., (ii) In a two-sector economy, if income is zero,, average propensity to consume will also zero., Ans., , (i) The given statement is false, according to Keynesian, theory of employment, a state of under-employment, can exist. This may occur at that level of income where, equilibrium between AD and AS happens at less than, full employment level., (ii) The given statement is false, because when income is, zero, autonomous consumption may exist in economy for, C, survival, thus APC will never be zero., Y, , 16. Read the following statements carefully. Write true, or false with an appropriate reason., (i) Central bank buys government securities in the, open market to correct the situation of, inflationary gap., (ii) SLR is increased to correct the situation of, deflationary gap.
Page 73 :
CBSE Term-II Economics XII, , 62, , l, , (i) False, Central bank sells government securities in the, open market to correct the situation of inflationary gap., It is by selling the securities that the banks soaks, liquidity from the market which is expected to correct, the inflationary gap., (ii) False, SLR is decreased to correct the situation of, deflationary gap. Lower SLR increases credit creation, capacity of the commercial banks because a cut in the, SLR raises cash balances with the commercial banks., Accordingly, availabiltiy of credit increases in the, capital market. This increases aggregate demand and, deflationary gap is corrected., , Long Answer (LA) Type Questions, 1. Explain the concept of inflationary gap. Also, explain the role of legal reserves in reducing it., (All India, 2012, 2009), , Or Define and represent inflationary gap on a diagram., Explain the role of the varying reserves, requirement in removing the gap., (Delhi 2010C), Ans. Inflationary gap occurs when AD>AS corresponding to, , full employment level. This inflationary gap, i.e, excess of, Aggregate Demand causes inflation in the economy and, price levels tend to rise., Aggregate Demand/, Aggregate Supply, , Y, , It reduces the supply of money and credit creation, capabilities of commercial banks. Due to lesser supply, of money, the Aggregate Demand comes down and the, economy attains equilibrium situation., (ii) Statutory Liquidity Ratio (SLR) It refers to a fixed, percentage of the total assets of a bank in the form of, cash or other liquid assets that is required to be, maintained by the bank. During the situation of, inflationary gap, SLR is increased. This reduces the, credit creation capacity of commercial banks and, reduces the flow of money in the economy. As a result, of that, the Aggregate Demand comes down and, ultimately, the economy attains equilibrium., , 2. In the given figure, what does the gap ‘KT’, represent? State and discuss any two fiscal, measures to correct the situation., (CBSE 2020), Y, , AD1 (C + I + DI), , Aggregate demand, , Ans., , AD(C + I), , K, , T, , Y = AS, 45, F, , A D AE, AD FE, , Inflationary gap, P, , Income, , Ans. ‘KT’ represents inflationary gap which means aggregate, , E, , O, , X, YF, , X, Income/Output, , In this figure,, AD FE = AD at full employment level, AD AE = AD above full employment level, The point E is the equilibrium point where AD = AS. But, there is excess demand (current) at AD AE , where, Aggregate Demand FP is more than the Aggregate, Supply in the economy. This difference of actual, Aggregate Demand and Supply, i.e. EF is the inflationary, gap., Inflationary Gap = Excess Demand = AD AE − AD FE = EF, Role of Legal Reserves to Correct the, Problem of Inflationary Gap, Legal reserves like Cash Reserve Ratio and Statutory, Liquidity Ratio are the tools to correct the problem of, inflationary gap, (i) Cash Reserve Ratio (CRR) Each and every commercial, bank has to keep a certain proportion of its demand and, time deposits in the form of cash and other liquid assets, with the Central Bank. This ratio is termed as Cash, Reserve Ratio. To correct the problem of inflationary, gap, the Central Bank increases the CRR., , demand is more than aggregate supply corresponding to, full employment level. Two fiscal measures to correct the, situation of inflationary gap are, (i) Revenue Policy To correct the situation of inflationary, gap, government raises the rate of all taxes. This reduces, the purchasing power by reducing disposable income, (i.e., after tax income) of the people which in turn will, reduce the aggregate demand in the economy., (ii) Expenditure Policy To correct the situation of, inflationary gap, government should reduce its public, expenditure. This reduces the purchasing power by, reducing total income of the people which in turn will, reduce the aggregate demand in the economy., , 3. What is fiscal policy? What fiscal measures would, you recommend to correct deficient demand?, Ans. Fiscal policy refers to the revenue and expenditure, , policy (or budgetary policy) of the government to correct, the situations of excess or deficient demand., Following fiscal measures are recommended to correct, deficient demand, (i) The government should step up its expenditure on, (a) public works programmes, (b) education and public welfare, (c) subsidies to the producers, (d) defence and law and order
Page 74 :
CBSE Term-II Economics XII, (ii) The government should reduce tax burden on the, households and the producers, so that they are left with, greater cash balances., (iii) The government should raise more funds from the RBI, so that there is a greater flow of liquidity in the, economy. Higher liquidity implies higher level of AD., (iv) The government should plan a cut in public, borrowings, so that people are left with greater, liquidity (or cash balances). Greater cash balances, implies higher AD., Briefly, deficient demand is corrected when the, government steps up its own expenditure and ensures,, that cash balances with the people are high., , 4. Explain the role of government expenditure in, correcting the situation of, (i) deficient demand in the economy, (ii) inflationary gap in an economy, Ans., , (i) In a situation of deficient demand, aggregate demand, (measured in terms of aggregate expenditure) is less, than the aggregate supply corresponding to the full, employment level in the economy., Accordingly, aggregate demand needs to be raised. But, because of poor market sentiments (a characteristic, , 63, feature of the deficient demand), private expenditure, remains low. It is in such a situation that the, government expenditure (which is not driven by profit, motive) can play a significant role. It will act as an, injection of demand into the system and is expected to, induce private expenditure. Accordingly, the situation, of deficient demand will be corrected., (ii) Inflationary gap refers to a situation of excess demand,, when aggregate demand is greater than aggregate, supply corresponding to full employment level in the, economy., During this situation, general price level tends to rise,, causing a rise in the rate of interest and consequently,, a fall in investment and a fall in the growth rate of, GDP., Correction of inflation gap calls for a cut in, expenditure. But owing to rising prices, wage rate, tends to rise (along with other factor cost) which stokes, the rate of inflation. In such a situation, a cut in, government’s non-development expenditure like on, defence, law and order and subsides will cause an, overall cut in aggregate demand. So that excess, aggregate demand is corrected and inflationary gap is, eliminated.
Page 75 :
Chapter Test, Multiple Choice Questions, , 1., , In case of excess demand, RBI …… the bank rate or interest rate which makes the credit dear., (a) increases, (c) deposit, , 2., , (b) decreases, (d) None of these, , …… is equal tothe difference between ‘AD beyond full employment’ and ‘AD at full employment’., (a) Recession, (c) Deflationary gap, , 3., , (b) Inflationary gap, (d) None of these, , Which of the following statements is/are true?, (a) Ex-ante savings is the actual level of savings in the economy., (b) Ex-post investment is the planned investment at a given point of time., (c) Ex-ante saving is always equal to ex-post savings., (d) All of the above statements are false., , 4., , Which of the following can be used to correct the situation of deflationary gap?, (a) Increase in bank rate, (b) Increase in CRR, (c) Reduction in SLR, (d) Increase in margin requirement, , 5., , By increasing the tax burden on the producers, the government intends to, (a) correct the situation of deficient demand, (b) correct the situation of inflationary gap, (c) correct the situation of excess demand, (d) Both (b) and (c), , Short Answer (SA) Type Questions, , 1., , Define effective demand. Discuss how effective demand can be restored, if ex-ante Aggregate Demand (AD) is more, than ex-ante Aggregate Supply (AS)., , 2., 3., 4., , Explain three reasons by which deficit demand in an economy can be corrected., , 5., , Read the following statements carefully. State true or false with an appropriate reason., (i) Full employment implies there is zero unemployment in the economy., (ii) Excess demand refers to the situation when AD> AS, corresponding to underemployment in the economy., , Explain the ‘varying reserve requirements’ method of credit control by the central bank., ‘‘To boost the falling demand in the economy, the reserve Bank of India recently reduced repo rate.’’ Elaborate the, rationale behind the steps taken by the central bank., , Long Answer (LA) Type Questions, , 1., 2., , Explain the concept of deflationary gap. Also, explain the role of margin requirement in reducing it., What is monetary policy? Briefly state how monetary policy is used to correct deficient demand?, , Answers, Multiple Choice Questions, 1. (a), , 2. (b), , 3. (d), , 4. (c), , 5. (d), , For Detailed Solutions, Scan the code
Page 78 :
67, , CBSE Term-II Economics XII, , CHAPTER 01, , Employment and, Unemployment in India, In this Chapter..., l, , Employment, , l, , Unemployment, , l, , Government and Employment, Generation, , Employment, It is an activity which helps an individual to earn his living. It is, basically a relationship between two parties, i.e, the employer, and the employee who are binded in a contract of doing, something valuable or it is an act of employing or state of being, employed., , Workers, All those who are engaged in production activities, in whatever, capacity high or low, are workers., , Types of Workers, 1. Self-Employed The workers who own and operate an, enterprise to earn their livelihood are known as, self-employed. e.g. a farmer working on his own farm. This, category accounts for more than 50% of the workforce., 2. Hired Workers Those people who are hired by others and, are paid wages or salaries as a reward for their services are, called hired workers., Hired workers can be of two types, (i) Casual Workers Those people who are not hired by, their employers on a regular/permanent basis and do, not get social security benefits are said to be casual, workers. e.g. construction workers., , (ii) Regular Salaried Workers When workers are, engaged by someone or by an enterprise and, paid their wages on a regular basis, they are, known as regular salaried employees or regular, workers. e.g. teachers, chartered accountants,, etc., , Important Terms, Terms associated with workers and employment are, stated below, 1. Productive Activities Those activities which, contribute to the gross national product are called, productive activities., 2. Workforce Persons who are engaged in productive, activities are termed as workers and they constitute, the workforce. It is the total number of persons, actually working., 3. Labour Supply It refers to the amount of workers that, are willing to work, corresponding to a particular, wage rate., 4. Labour Force It refers to the number of workers, actually working or who are able to work. It is not, related to wage rate.
Page 79 :
CBSE Term-II Economics XII, , 68, Distribution of Self-Employed and, Hired Workers in India, The distribution of self-employed and hired workers across, different regions and on the basis of gender is discussed below, , 1. According to Region (Rural and Urban), l, , l, , 43% of workers are self-employed and 57% of workers are hired in, urban areas., 56% of workers are self-employed and 44% of workers are hired in, rural areas., Urban Workers, , Rural Workers, , 15%, 43%, , 35%, , 42%, , 56%, , 9%, , Casual Wage Labourers, Regular Salaried Workers, , l, , l, , l, , Casualisation of workforce, Jobless growth, Informalisation of Indian workforce, , Rate of Participation of People in, Employment/Worker Population Ratio, , It refers to participation of people in production activity., It is measured as a ratio of workforce to total population of, the country. Symbolically,, Worker Population Ratio, Total Number of Workers, =, × 100, Total Population, The data on rate of participation of people in employment, in rural and urban areas, are as follows, Worker-Population Ratio in India, 2017-2018, Worker-Population Ratio, , Self-employed, , Sex, , Total, , Rural, , Urban, , Men, , 52.1, , 51.7, , 53.0, , Women, , 16.5, , 17.5, , 14.2, , Total, , 34.7, , 35.0, , 33.9, , Distribution of Employment by Region (2011-12), The above chart shows that the self-employed and casual wage, labourers are found more in rural areas than in urban areas. It is, because in urban areas, people are skilled and work for jobs in, offices and factories. But in rural areas, people work on their, own farms., , 2. According to Gender (Male and Female), , Male Workers, 29%, , 51%, , Female Workers, 31%, , 20%, Casual Wage Labourers, Regular Salaried Workers, , 56%, , %, , l, , 51% of male workers are self-employed and 49% of male workers, are hired., 56% of female workers are self-employed and 44% of female, workers are hired., , 13, , l, , Self-Employed, , Distribution of Employment by Gender (2011-12), The above chart shows that self-employment and hired, employment are equally important for male workers. But female, workers give preference to self-employment than to hired, employment. It is because women, both in rural and urban areas, are less mobile and thus, prefer to engage themselves in, self-employment., , State of Employment in India, The state of employment in India can be adjudged on the basis, of the following factors, l, , l, , Rate of participation of people in employment, Employment in primary, secondary and tertiary sector, , Employment in Primary,, Secondary and Tertiary Sector, , Generally, we divide all the productive activities of an, economy into different sectors which are as follows, 1. Primary Sector It includes agriculture, forestry and, logging, fishing, mining, quarrying, etc., 2. Secondary Sector It includes manufacturing,, electricity, gas and water supply, construction, etc., 3. Tertiary Sector It includes trade, transport, storage,, services, etc., In the course of economic development of a country,, labour flows from primary sector to secondary and tertiary, sector. In this process, workers migrate from rural to, urban areas., Trends in Employment Pattern (Sectorwise), 1972-2012 (in %), Sector, , 1972–73, , 2011–2012, , Primary, , 74.3, , 48.9, , Secondary, , 10.9, , 24.3, , Tertiary/Sector Services, , 14.8, , 26.8, , 100.0, , 100.0, , Total, , The above table reveals that in 1972-73, about 74.3% of, workforce was engaged in primary sector and in 2011-12, this proportion has declined to 48.9%. Secondary and, tertiary/services sectors are showing promising future for, the Indian workforce.
Page 80 :
69, , CBSE Term-II Economics XII, Casualisation of Workforce, , The movement of labour from regular salaried workers to, casual wage workers is known as the process of casualisation, of workforce. Consider the table given below which shows, the statuswise trend in employment pattern, Trends in Employment Pattern (Statuswise), 1972-2012 (in%), Status, , 1972-73, , 2011-2012, , Self-employed, , 61.4, , 52.0, , Regular Salaried Employees, , 15.4, , 18.0, , Casual Wage Labourers, , 23.2, , 30.0, , 100.0, , 100.0, , Total, , The distribution of workforce on the basis of status indicates, that over the last four decades (1972-2012), people have, moved from self-employment to regular salaried, employment and casual wage work implying that, casualisation is picking up., Jobless Growth, , It refers to the situation in which growth in employment, opportunities do not correspond with economic growth. In, other words, it is a phenomenon which means that the, GDP of the country is rising, but without generating, employment., Informalisation of Indian Workforce, , Informalisation of Indian workforce implies that there is a, continuous decline in the percentage of workforce in the, formal sector and a corresponding rise in the percentage of, workforce in informal sector. The explanations of formal, sector and informal sector are given below, 1. Formal Sector All the public sector establishments and, those private sector establishments which employ 10 or, more hired workers are called formal sector, establishments and those who work in such, establishments are formal sector workers. Those who are, working in the formal sector enjoy social security, benefits and they earn more than the workers working in, the informal sector., The workers working in this sector are aware of their, rights and form trade unions which represents them in, meetings with employers and also help them in many, other ways., 2. Informal Sector All other enterprises and workers, working in those enterprises form the informal sector., Informal sector also includes millions of farmers,, agricultural labourers, owners of small enterprises and, people working as self-employed in these small, enterprises which do not have any hired workers., Workers and enterprises in the informal sector do not, get regular income and they do not have any protection, or regulation from the government. Workers are, dismissed without any compensation., , Unemployment, It refers to the situation in which a person is willing and able, to work at the existing wage but he is not getting employment., , Types of Unemployment in India, Following are the types of unemployment in India, 1. Rural Unemployment Unemployment found in rural areas, is referred to as rural unemployment. Rural unemployment, can be of the following three types, (i) Open Unemployment It refers to that situation, wherein the worker is willing to work and has the, necessary ability to work, yet he does not get work, and remains unemployed for full time., (ii) Seasonal Unemployment It refers to a situation, where number of persons are not able to find a job in, a particular season. It occurs in case of agri- culture,, ice-cream factories, woollen factories, etc., (iii) Disguised Unemployment It exists when marginal, physical productivity of labour is zero or sometimes, it becomes negative., 2. Urban Unemployment Unemployment found in urban, areas is referred to as urban unemployment. Urban, unemployment is of three types, (i) Industrial Unemployment It includes those illiterate, persons who are willing to work in industries, mining,, transport, trade, construction activities, etc. Problem, of unemployment in industrial sector has become, acute because of increasing migration of rural people, to urban industrial areas in search of employment., (ii) Educated Unemployment In India, the problem of, unemployment among the educated people is also, quite grave. It is a problem spread across all parts of, the country because the massive expansion of the, education facilities have contributed to the growth of, educated persons who are on the look out for white, collar jobs., (iii) Technological Unemployment Technological, upgradation is taking place in all spheres of activity., People who have not updated their skills in the, latest technology become technologically, unemployed., , Causes of Unemployment, The causes of unemployment in India are given below, 1. Slow Economic Growth In Indian economy, the rate of, economic growth is very slow. This slow growth rate fails, to provide enough employment opportunities to the, rising population. Supply of labour is much more than the, available employment opportunities., 2. Rapid Growth of Population Constant increase in, population has been a grave problem of India. It is one of, the main causes of unemployment. The number of, unemployed persons has actually increased instead of, decreasing during the plan period.
Page 81 :
70, 3. Faulty Employment Planning The Five Year Plans in India, have not been designed for employment generation. A, frontal attack to solve the problem of unemployment was, missing. In the FYPs, it was assumed that economic growth, will take care of unemployment problem., 4. Excessive Use of Foreign Technology There is lack of, scientific and technical research in India due to its high, cost. This has resulted in excessive use of foreign, technology which has led to technical unemployment in, our country., 5. Lack of Financial Resources The expansion and diversification programme of agriculture and small scale industries, have suffered because of lack of financial resources., 6. Agriculture still a Seasonal Occupation Even after, approximately 70 years of independence, agriculture in, India, still does not have access to adequate irrigation, facilities, rendering it to be a seasonal occupation. Because, of this, the workforce engaged in farming activities remain, unemployed for 3-4 months in a year., 7. Decay of Cottage and Small Industries The cottage and, small industries are labour-intensive and generate a, number of employment opportunities. But the British rule, led to their decay and the government of independent, India did not initiate adequate measures for their revival., 8. Low Savings and Investment In India, a low rate of capital, formation prevails due to low savings and investment., Shortage of capital prevents a business to expand and grow,, thus limiting their power to generate employment., 9. Mobility of Labour In India, mobility of labour is quite, low. Because of family obligations, social constraints,, language and cultural barriers, people are unwilling to, move to a new place when offered a job there., , Adverse Effects of Unemployment, Unemployment results in a number of adverse effects which, can be classified as, 1. Economic Effects These effects are visible in terms of loss, which is measurable in monetary terms. The various adverse, effects belonging to this category are explained below, (i) Loss of Output Unemployment is basically, underutilisation of the human resources of the, country leading to loss of output., (ii) Loss of Human Resources Unemployment is a, situation in which the productive capacity of able and, willing persons is wasted. This leads to a waste of, human resources., (iii) Low Productivity Unemployment increases the, dependence on agriculture and this results in low, productivity per labour employed. Low productivity, adversely affects the growth rate of the economy., (iv) Low Rate of Capital Formation Capital formation, depends on the level of income in the country. Due, to unemployment, the income levels are low,, resulting in low rate of capital transformation., , CBSE Term-II Economics XII, 2. Social Effects These effects manifest themselves in, the form of many social problems which are discussed, below, (i) Rise in Poverty Unemployment and poverty are, directly correlated. With increase in, unemployment, the level of poverty in the, country also rises., (ii) Increase in Inequalities Unemployment, generates inequality in the distribution of income, and wealth, thus defying the objective of social, justice and resulting in class conflicts between the, rich and the poor., (iii) Low Standard of Living Unemployment affects, the income of an individual adversely and leads to, a fall in his standard of living., (iv) Social Unrest An unemployed person, creates social unrest by indulging in anti-social, activities such as theft, extortion, kidnapping,, etc. In extreme cases, he can also resort to, terrorism., (v) Results in Depression An unemployed person, considers himself unwanted and useless, and, suffers from depression., , Government and, Employment Generation, Since independence, the Union and State Government, have played an important role in generating employment or, creating opportunities for employment generation. Their, efforts can be broadly categorised as, 1. Direct Employment In this, government employs, people in various departments for administrative, purposes. It also runs industries, hotels and transport, companies and hence provides employment directly to, workers., 2. Indirect Employment When output of goods and, services from government enterprises increases, then, private enterprises which receive raw materials from, government enterprises will also raise their output., Hence, the number of employment opportunities in the, economy increases. This is the indirect generation of, employment opportunities by the government, initiatives in the economy., , Employment Generation Programmes, The government has also initiated various employment, generation programmes such as Prime Minister’s Rozgar, Yojana, Sampoorna Gramin Rozgar Yojana, Mahatma, Gandhi National Rural Employment Guarantee Act, etc., These programmes aim at providing not only employment, but also services in areas such as primary health, primary, education, rural drinking water, nutrition, assistance for, people to buy employment generating assets, development, of community assets by generating wage employment, etc.
Page 82 :
71, , CBSE Term-II Economics XII, , Chapter, Practice, 6. In which type of unemployment, the, , PART 1, Objective Questions, l, , Multiple Choice Questions, 1. Percentage of population participating in production, (b) Workforce, (d) Participation rate, , 2. Worker who are on permanent payroll of their, employer are called, (a) Self-employed workers (b) Casual workers, (c) Regular workers, (d) None of these, Ans. (c) Regular workers, , 3. Agriculture labourers, farmers, owners of small, enterprise which employ less than 10 workers fall in, the category of, (a) formal sector, (c) casual workers, Ans. (b) informal sector, , (a) Disguised unemployment, (b) Involuntary unemployment, (c) Seasonal unemployment, (d) Structural unemployment, Ans. (a) Disguised unemployment, , 7. Unemployment which occurs for the time period, , activity is called ……… ., (a) Labour force, (c) Labour supply, Ans. (d) Participation rate, , marginal productivity of an additional worker is, zero?, , (b) informal sector, (d) regular workers, , 4. Data on unemployment in India can be obtained, from which source?, (a) Reports of census of India, (b) National sample survey organisation, (c) Directorate general of unemployment, (d) All of the above, Ans. (d) All of the above, , 5. Which of the following correctly defines, unemployment rate?, Total Number of Employed, × 100, Total Labour Force, Total Labour Force, (b), × 1000, Total Number of Unemployed, Total Labour Force, (c), × 1000, Total Number of Employed, , (a), , (d) None of the above, Total Number of Employed, Ans. (a), × 100, Total Labour Force, , when workers move from one job to another job is, known as ……… ., (a) Cyclical unemployment, (b) Seasonal unemployment, (c) Technological unemployment, (d) Frictional unemployment, Ans. (d) Frictional unemployment, , 8. Two months ago, Shyam was working as part time, salesman on commission basis in a company. Due, to his excellent performance, company appointed, him as a permanent sales manager on fixed, monthly salary. From the point of view of, employment currently he is a, (a) skilled worker, (b) regular salaried worker, (c) unskilled worker, (d) casual wage labour, Ans. (b) regular salaried worker, , 9. Hired workers are those, (a) who work for others, (b) who are not self-employed, (c) who are engaged in their own business, (d) Both (a) and (b), Ans. (d) Both (a) and (b), , 10. If a person is ready to work at the prevailing wage, rate in the market but he is unable to find the work,, then what type of unemployment would it be, called?, (a) Voluntary unemployment, (b) Involuntary unemployment, (c) Seasonal unemployment, (d) None of the above, Ans. (b) Involuntary unemployment
Page 83 :
CBSE Term-II Economics XII, , 72, 11. A situation where percentage of work force in the, formal sector tends to decline and that in the, informal sector tends to rise as known as, (a) Informalisation, (b) Casualisation, (c) Jobless growth, (d) None of the above, Ans. (a) Informalisation, , 12. The ratio expressing percentage change in, employment of labour in response to a percentage, change in GDP growth is called ……… ., (a) Employment elasticity of growth, (b) Unemployment elasticity of growth, (c) Workforce participation rate, (d) Labour force participation rate, Ans. (a) Employment elasticity of growth, , 13. If new computers are being installed in a company, and some employees are fired from the job due to, lack of computer knowledge, then what kind of, unemployment will it be called?, (a) Disguised unemployment, (b) Structural unemployment, (c) Hidden unemployment, (d) Frictional unemployment, Ans. (b) It is an unemployment that happens because of a, mismatch between the skilled workers and the jobs that are, actually available., , 14. Which of the following is the main source of, employment for majority of workers in India?, (a) Primary sector, (b) Secondary sector, (c) Tertiary sector, (d) All of the above, Ans. (a) Primary sector, , 17. Write the correct pair., Column I, , Column II, , A. Voluntary, unemployment, , (i) Worker is willing to work but, is not getting work, , B. Involuntary, unemployment, , (ii) Worker is not willing to work, at existing wage rate, , C. Frictional, unemployment, , (iii) A worker is not getting work, in a particular season, , D. Disguised, unemployment, , (iv) Marginal productivity of a, worker is zero, , Codes, (a) A-(i), (b) B-(ii), (c) C-(iii), (d) D-(iv), Ans. (d) D-(iv), , 18. Which of the following statements is/are correct?, (i) A worker is an individual who is does some, productive work to earn a living., (ii) Majority of population in India is finding, employment in the service sector which is, growing at a fast pace and growing, continuously., Alternatives, (a) Both are true, (b) Both are false, (c) (i) is true, but (ii) is false, (d) (i) is false, but (ii) is true, Ans. (a) Both are true, , 19. Which one is the cause of unemployment in, India?, , (a) Structural unemployment, (b) Frictional unemployment, (c) Disguised unemployment, (d) All of the above, Ans. (c) Disguised unemployment, , (a) Rapid growth of population, (b) Rising prices, (c) Increasing public expenditure, (d) Defective monetary policy, Ans. (a) The proportion of job-seekers is much higher than, employment opportunities and the skill-gap in the, existing labourforce makes labour market more, competitive., , 16. Which of the following correctly defines disguised, , 20. You are a factory owner and have given, , 15. Which of the given unemployment is predominant in, context of Indian agriculture?, , unemployment?, (a) More number of workers are engaged in a particular work, than required, (b) Marginal productivity of an additional worker is close to zero, (c) Additional workers act as a hindrance towards the, productivity of other workers implying diminishing returns, (d) All of the above, Ans. (d) All of the above, , employment to 400 workers. If 10 workers are, dismissed by you without loss of production then, this situatioin will be described as, (a) casual unemployment, (b) disguised unemployment, (c) structural unemployment, (d) seasonal unemployment, Ans. (b) disguised unemployment
Page 84 :
73, , CBSE Term-II Economics XII, , l, , Assertion-Reasoning MCQs, , Ans. (a) Both Assertion (A) and Reason (R) are true and Reason, , (R) is the correct explanation of Assertion (A)., , Directions (Q.Nos. 1 to 6) There are two statements marked, as Assertion (A) and Reason (R). Read the statements and, choose the appropriate option from the options given below, (a) Both Assertion (A) and Reason (R) are true and Reason, (R) is the correct explanation of Assertion (A)., (b) Both Assertion (A) and Reason (R) are true, but Reason, (R) is not the correct explanation of Assertion (A)., (c) Assertion (A) is true, but Reason (R) is false., (d) Assertion (A) is false, but Reason(R) is true., , 1. Assertion (A) Urban unemployment is a spillover, of rural unemployment., Reason (R) Owing to the lack of opportunities of, employment, people in the rural areas are, compelled to migrate to the urban areas in search, of livelihood., Ans. (a) Both Assertion (A) and Reason (R) are true and, , Reason (R) is the correct explanation of Assertion (A)., , 2. Assertion (A) India is considered as favourite, outsourcing destination leading to increase in, foreign exchange reserve., Reason (R) India’s growth rate of population is, one major concern which makes this country, labour cost efficient., Ans. (a) Both Assertion (A) and Reason (R) are true and, , Reason (R) is the correct explanation of Assertion (A)., , 3. Assertion (A) Lack of training in farming activity, leads to low productivity and growth of, agriculture in India., Reason (R) Reforms in India focused upon, development of industries which was failed to, generate enough employment., Ans. (a) Both Assertion (A) and Reason (R) are true and, , Reason (R) is the correct explanation of Assertion (A)., , 4. Assertion (A) Economic activity means production, activity., Reason (R) There is difference between, production activity and economic activity. It is like, this, economic activity relates to the use of scarce, of resources., Ans. (d) An economic activity is an activity of providing,, , making, buying or selling commodities or services by, people. It includes any activity that deals with the, manufacturing, distributing or utilising of products or, services., , 5. Assertion (A) Entrepreneurial development has, been considered necessary for generating, self-employment opportunities., Reason (R) It is therefore quintessential to, enhance entrepreneurial ability of the people and, aid them in preparation of financial, technical and, professional reports., , 6. Assertion (A) Primary sector is an important source, of labour supply to the secondary and tertiary sectors, of the economy., Reason (R) When productivity rises in agriculture, (owing to the use of innovative technology), less, labour is needed to produce a given level of output., Ans. (a) Both Assertion (A) and Reason (R) are true and Reason, , (R) is the correct explanation of Assertion (A)., l, , Case Based MCQs, 1. Direction Read the following text and answer the, question no. (i) to (vi) on the basis of the same., This paragraph talks about economic inequalities in, India that have been driven by employment patterns, and changes in labour markets, which in turn have, been affected by macroeconomic policies and, processes as well as forms of social discrimination, and exclusion. While many Asian economies have, shown indications of rising inequality in recent, decades, the Indian experience is particularly, remarkable in the way inequalities have intertwined, with the economic growth process., Structural change (or the relative lack of it) and the, persistence of low productivity employment in India, are strongly related to falling wage shares of national, income and growing wage inequalities and the close, relationship between formal and informal sectors is, the sharpest exemplar of this., Patterns of social discrimination alongwith gender, and caste lines have reinforced tendencies to create, segmented labour markets that offer little incentive, for employers to focus on productivity, improvements., (i) Why did the government shift its strategy from, long-term to short-term programmes to remove, unemployment?, , (a) Short-term policies are more effective, (b) Long-term policies do not give appropriate response, (c) Its easy to check the progress, (d) All of the above, Ans. (d) All of the above, , (ii) Women participation in rural areas is found to be, higher in rural areas as compared with areas in India,, due to which of the following reason?, (a) Widespread poverty, (b) Male members do not earn sufficient income, (c) Wages levels are low in rural areas, (d) All of the above, Ans. (d) All of the above
Page 85 :
CBSE Term-II Economics XII, , 74, (iii) Increase in the proportion of casual workers as a, proportion of total workforce is known as ……… ., (a) Casualisation, (b) Informalisation, (c) Employment elasticity of growth, (d) None of the above, Ans. (a) Casualisation, , (iv) Due to introduction of new technology, workers may, be replaced by machines leading to which type of, unemployment?, (a) Disguised unemployment (b) Frictional unemployment, (c) Seasonal unemployment, (d) Structural unemployment, Ans. (d) Structural unemployment, , (v) Which of the following situation correctly explains, the case of structural unemployment?, (a) Web-based advertising has drawn advertisers away from, newspaper ads., (b) Online news media has drawn customers away from, physical newspapers., (c) Ticket machines in train stations has reduced the need, for ticket officers., (d) All of the above, Ans. (d) All of the above, , (vi) Assertion (A) There is a need to bridge the skill-gap, and enhance labour productivity in India., Reason (R) Structural unemployment is a major issue, in India and thus there is a need to tackle with the same., Alternatives, (a) Both Assertion (A) and Reason (R) are true and Reason (R), is the correct explanation of Assertion (A)., (b) Both Assertion (A) and Reason (R) are true, but Reason, (R) is not the correct explanation of Assertion (A)., (c) Assertion (A) is false, but Reason (R) is true, (d) Both the statements are false, Ans. (a) Both Assertion (A) and Reason (R) are true and Reason, (R) is the correct explanation of Assertion (A)., , 2. Direction Read the following text and answer the, question no. (i) to (vi) on the basis of the same., Many developing countries are experiencing an, unprecedented growth of urban population. Since the, early 1970s, the trend has accelerated and it is, expected that the less developed regions of the world, will add about 1,000 million people to its urban, population till the last quarter of this century as, against 400 million people in the preceding quarter., The explosion of this magnitude cannot be without, far-reaching economic, social and political, consequences which will have to be countered, through appropriate public policies., Many observers have feared that rising urban, unemployment, scanty housing, inadequate water, and electricity supply, poor sanitation, transport and, , other services, and an overall decline in the, quality of urban life is in the main course due to, the influx of migrants from the rural areas. Many, developing countries have, therefore, initiated, policies and programmes which aim at, decelerating the growth of urban population, through restricting the scale of rural-urban, migration., (i) Migration of labour in search of employment has, been a major concern for the government. This, was also evident from the movement of labour, during lockdown in India. Which of the reasons, could be accounted for the migration?, (a) Lack of regular source of income, (b) Low level of development of agriculture, (c) Low level of skills, (d) All of the above, Ans. (d) All of the above, , (ii) Which of the following type of unemployment is, prevalent in rural areas in India?, (a) Disguised unemployment, (b) Structural unemployment, (c) Seasonal unemployment, (d) Both (a) and (c), Ans. (d) Both (a) and (c), , (iii) What is the right formula to know the, unemployment rate?, (a) (Total Number of Unemployed / Total Labour Force), × 100, (b) (Total Labour Force / Total Number of Unemployed), × 100, (c) (Total Number of Unemployed / Total Workforce), × 100, (d) (Total Workforce / Total Number of Unemployed), × 100, Ans. (a) (Total Number of Unemployed / Total Labour Force) ×, 100, , (iv) Which of the following is the most preferred form, of employment among women in India?, (a) Self-employment, (c) Both (a) and (b), Ans. (a) Self-employment, , (b) Technical employment, (d) Wage employment, , (v) Which of the following is the major initiative, taken by the GoI which guarantees 100 days of, assured employment to every rural household, who asks for it?, (a) Swarnajayanti Gram Swarozgar Yojana, (b) Mahatma Gandhi National Rural Employment, Guarantee Act, (c) Pradhan Mantri Gram Sadak Yojana, (d) Pradhan Mantri Jan Dhan Yojana, Ans. (b) Mahatma Gandhi National Rural Employment, Guarantee Act
Page 86 :
75, , CBSE Term-II Economics XII, (vi) Assertion (A) Raj owns a Kirana store and has hired, four workers to handle day-to-day work. He comes, under the purview of formal sector., Reason (R) An establishment with four hired, workers is known as formal sector establishment., Alternatives, (a) Both Assertion (A) and Reason (R) are true and Reason, (R) is the correct explanation of Assertion (A)., (b) Both Assertion (A) and Reason (R) are true, but Reason, (R) is not the correct explanation of Assertion (A)., (c) Assertion (A) is false, but Reason (R) is true, (d) Both the statements are false, Ans. (d) All the public sector establishments and those private, sector establishments which employ 10 or more hired, workers are called formal sector establishments. All other, enterprises fall under informal sector., l, , Short Answer (SA) Type Questions, 1. Why is employment considered so important in the, Indian development policy?, , Ans. Employment is considered so important in the Indian, , development policy because of the following reasons, (i) More employment will lead to higher level of, national income since, production and employment, are directly related., (ii) Employment is crucial for removal of poverty., , 2. Give the meaning of labour supply, labour force and, workforce., Ans. Labour supply refers to the number of persons willing to, , work at different wage rates. It depends upon the existing, wage rate and is measured in terms of man-days., Labour force refers to the number of persons actually, working or willing to work. It does not depend upon the, wage rate and is measured in terms of number of days., Workforce refers to the numbers of persons actually, working. This measure does not include those persons, who are willing to work but are not getting work., , 3. (i) Victor is able to get work only for two hours in a, day, rest of the day, he is looking for work. Is he, unemployed? Why? What kind of jobs could, persons like Victor be doing?, (ii) Children are not considered a part of workforce., Given reason for the same., Ans., , (i) No, Victor is employed because he works for two, hours daily for which he is paid. He is a casual, worker. Victor might be doing jobs on a casual basis,, such as painting a house, plumbing work, working as, an electrician, distributing newspaper, milk, etc., (ii) Working population includes able-bodied persons, and adults. Children are unable to perform, productive activities. Also, use of children in work is, equivalent to denying them their childhood, i.e., children right to playing., , 4. ‘‘It is necessary to create employment in the formal, sector rather than in the informal sector.’’ Defend, or refute the given statement with valid arguments., (CBSE 2020), Ans. ‘‘It is necessary to create employment in the formal, , sector rather than in the informal sector.’’ The statement, is defended because workers of the formal sector enjoys, social security benefits and job security which remain, protected by the labour laws. On the other hand, people, engaged in the informal sector do not enjoy any social, security benefits and do not have job security. As a result,, informal workers are generally very poor and live in, slums., , 5. The rate of women participation in workforce of, rural areas is greater than urban areas. Do you, agree? Justify., Or Compared to urban women more rural woman are, found working. Why?, (NCERT), Ans. Yes, I agree with the given statement. The difference in, , participation rates is very high between urban and rural, women. In urban areas, for every 100 urban females,, only about 14 are engaged in some economic activities., In rural areas, for every 100 rural women, about 26, participate in the employment market., It is common to find that where men are able to earn, high incomes, families discourage female members from, taking up jobs. Earnings of urban male workers are, generally higher than rural males and so urban families, do not want females to work., Apart from this, many activities of the households in, which urban women are engaged, are not recognised as, productive work, while women working on farms in the, rural areas are considered a part of the workforce if they, are being paid wages in cash or in the form of food, grains., , 6. “Women in rural areas are ready to work even at, low wages.” Comment., Ans. The given statement is correct because of the following, , reasons, (i) There is widespread poverty in rural areas. Poverty, compels the women in rural areas to accept low, wage occupations., (ii) Women in rural areas are averse to migration. They, are reluctant/unwilling to migrate to urban areas for, jobs. Owing to the lack of education, they are not, even capable of finding jobs outside rural areas., Accordingly, they prefer to be engaged in farm and, non-farm activities but in the rural areas only., , 7. ‘‘Unemployment is related to poverty.’’ Comment., Ans. Poverty and unemployment usually go together. Those, , who fail to get employment become a burden on the, limited family income and thus, depress already low, levels of consumption. Therefore, many programmes, which aim at removing poverty provide employment
Page 87 :
CBSE Term-II Economics XII, , 76, opportunities to the poor like Prime Minister’s Rozgar, Yojana, Swarna Jayanti Shahri Rozgar Yojana, etc. Most of, the urban poors are either unemployed or intermittently, employed as casual labourers. Casual labourers are among, the most vulnerable in society as they have no job security,, no assets, limited skills, sparse opportunities and no surplus, to sustain them. Poverty is therefore, closely related to, unemployment., , 8. Low employment among women is a reflection of, economic backwardness of a country. Suggest some, measures for increased employment opportunities for, women., Ans. I shall suggest the following measures to increase the, , employment opportunities for women, (i) Education and training opportunities for women, should be further expanded, diversified and made, easily accessible., (ii) Residential accommodation for working mothers, should be increased., (iii) There should be much more facilities of creches and, child care during the working hours of mothers., (iv) There should be large scale publicity and building of, public opinion in favour of employment of women., , 9. What role does government play in generating, employment opportunities?, Ans. The government generates employment through direct and, , indirect efforts. The government makes direct efforts at, employing people in various departments for administrative, purposes. It runs various enterprises and when the output, of goods and services of these enterprises increase, it leads, to further increase in employment., The various private enterprises that are linked to the, government enterprises might also benefit from increased, output of these enterprises and thus, increase their output, and employment also. This way government indirectly, generates employment also., , 10. Why is unemployment in India considered to be a, chronic problem?, Ans. Unemployment in India is considered to be a chronic, , problem because it has been a long-term phenomenon., India is facing this problem ever since independence and, has not yet been able to solve this problem. The absolute, number of unemployed is increasing year by year. India has, not been able to generate enough jobs due to lack of capital, and low rate of growth in the industrial sector., , 11. You are residing in a village. If you are asked to advise, the village panchayat, what kinds of activities would, you suggest for the improvement of your village which, would also generate employment?, (NCERT), Ans. I would suggest the following activities to generate, , employment in village, (i) There should be multiple cropping in the village., (ii) Other activities related to agriculture such as, plantation, etc. horticulture, dairying, animal, husbandry, etc. should be encouraged., , (iii) Cottage industry should be encouraged., (iv) More and more facilities of education, health, services, roads, etc should be created in the village., , 12. Mention the salient features of the unemployment, situation in India., Ans. Following are some of the salient features of the, , unemployment situation in India, (i) The incidence of unemployment is much higher in, urban areas than in rural areas., (ii) Unemployment rates for women are higher than, those for men., (iii) Under employment is higher in case of women., (iv) Incidence of unemployment among the educated, is much higher., , 13. How is unemployment an economic as well as a, social problem?, Ans. Unemployment is both an economic and a social, , problem. Unemployment is an economic problem in the, sense that unemployed persons will be consumers only, without being a producer. Non utilisation of human, resources due to unemployment involves double cost of, maintenance and loss of output., Unemployment is a social problem in the sense that it, causes enormous sufferings to unemployed workers due, to their reduced or nil income. Many social evils like, dishonesty, immorality, drinking, gambling, robbery, etc, are the outcome of unemployment. It causes social, disruption in the society and the government has to, incur a heavy unproductive expenditure on law and, order., , 14. Why do people prefer to be voluntarily, unemployed?, Ans. People prefer to be voluntarily unemployed for the, , below mentioned reasons, (i) They do not want to work at the wages that are, being offered., (ii) They are not willing to migrate to the place at which, job is being offered., (iii) They think that the job offered is below their, calibre., While computing the level of unemployment in the, country, people who prefer to be voluntary unemployed, are not taken into consideration. This in turn would not, inflate the unemployment statistic., , 15. “Unemployment in India is stubborn (almost, permanent in nature) while in developed, countries (like USA) it is critical.” Comment., Ans. Unemployment in India is stubborn because it is, , related to the lack of production capacity which is, lacking because of the lack of capital. The problem of, lack of capital is a long period problem, and therefore, stubborn in nature.
Page 88 :
77, , CBSE Term-II Economics XII, In developed countries like USA, unemployment is largely, related to the lack of demand. Lack of demand is not, stubborn, but cyclical in nature. This is why, the problem of, unemployment in these countries is cyclical in nature., l, , Ans. From the given table, following points can be noticed, , about the nature of workforce distribution, (i) Majority of the workforce was residing in the rural, areas in India in the year 1972-73. The total, workforce was 233 million out of which 194 million, workers were from rural areas and 39 million from, the urban areas. Thus, 83% of the total workforce was, rural as compared to 17% of the urban work- force., The reason for this was that a majority of population, was living in rural areas during that period., (ii) The rural workforce comprises of 64% of the male, workforce and 36% of female workforce. On the, other hand, the urban workforce comprises of, about 82% of male workforce and 18% of female, workforce. This shows that participation of males, in both rural as well as urban areas is higher than, that of the females because of lack of opportunities, available to women for acquiring education and, also the social structure and family norms which, did not encourage women to work., (iii) Another feature of workforce distribution is the, difference between urban female workforce and, rural female workforce. Females in the rural areas, formed 36 % of the workforce, whereas, the, females in the urban areas formed only 18% of the, workforce. This may be attributed to the fact that, where men are able to earn high incomes, families, discourage female members from taking up jobs., Earnings of urban male workers are generally, higher than rural males and so the urban families, do not want females to work., Thus, it can be concluded by analysing the above table, that majority of the workforce was from the rural areas, and there was low female participation rate in the, workforce during that period., , Long Answer (LA) Type Questions, 1. (i) Why are less women found in regular salaried, employment?, (ii) Analyse the recent trends in sectoral distribution, of workforce in India, Trends in employment pattern (sector-wise),, 1993 – 2012 (in %), Sector, Primary, , 1993-94, 64, , 1999-200, 60.4, , 2011-2012, 48.9, , Secondary, , 16, , 15.8, , 24.3, , Service, , 20, , 23.8, , 26.8, (CBSE 2020), , Ans., , (i) Less woman are found in regular salaried employment, due to the following reasons, (a) Lack of Education Facilities Female education is, not given due importance in India and hence,, majority of the woman in India do not have the, educational qualification and professional skills, required., (b) Discouragement from Family In India, families do, not want the female member to step out from the, house for work expecially if it is for long hours, as in, regular salaried employment., (c) Family Responsibilities Women are expected to, look after household chores including food, taking, care of children. This posses a restriction for women, to be engaged in regular employment., (ii) The given data indicates that over the given period, the, proportion of workforce in primary sector has gone, down significantly. Whereas, the employment share of, both secondary sector and the service sector has, increased gradually., While the share of secondary sector has gone up by, approximately 9% recently, the corresponding figure, for service sector has gone up by approximately 7.1%., This also shows that dependency on agriculture, remained high as secondary and service sector wasn’t, created enough employment., , 2. The following table shows distribution of workforce in, India for the year 1972-73. Analyse it and give reasons, for the nature of workforce distribution., (NCERT), Place of Residence, , Workforce (in millions), Male, , Female, , Total, , Rural, , 125, , 69, , 194, , Urban, , 32, , 7, , 39, , 3. (i) Comment upon the informalisation of labour, force in India., (ii) Define the worker population ratio. (CBSE 2020), Ans., , (i) Informalisation of labour force in India implies, that there is a continous rise in the percentage of, workforce in informal sector as a percentage of, total work force and a corresponding decline in the, percentage of workforce in formal sector. These, sectors can be understood as follows, (a) Formal Sector All the public sector, establishments and those private sector, establishments which employ 10 or more hired, workers, are known as formal sector, establishments. Those who are working in this, sector, enjoy social security benefits and they, earn more than the informal sector employees., (b) Informal Sector This sector includes all those, private sector enterprises which employ less, than 10 workers. This sector includes farmers,, agricultural labourers, owner of small, enterprises etc. They are not entitled to any, social security benefits.
Page 89 :
CBSE Term-II Economics XII, , 78, (ii) Worker population ratio is an indicator which is used, to analyse the employment situation in the country. It, is measured as a ratio of workforce to total population, of the country., Total Number of Workers, Worker Population =, × 100, Total Population, , 4. The following table shows the population and worker, population ratio for India in 1999-2000. Can you, estimate the workforce (rural and urban) for India?, (NCERT), Region, , Estimates of, Worker, Population Population, (in crore), Ratio, , Rural, , 71.88, , Urban, Total, , Estimated Number, of Workers, (in crore), , 41.9, , 71.88, × 41.9 = 3012, ., 100, , 28.52, , 33.7, , ?, , 100.40, , 75.6, , ?, , Ans. Worker Population Ratio =, , Total Number of Workers, × 100, Total Population, , ∴ Number of Workers, Total Population, =, × Worker Population Ratio, 100, Region, Rural, , Estimates of, Worker, Population Population, (in crore), Ratio, 71.88, , 41.9, , Estimated Number, of Workers (in crore), 71.88, × 41.9 = 3012, ., 100, , Urban, , 28.52, , 33.7, , 28.52, × 33.7 = 9.61124, 100, , Total, , 100.40, , 75.6, , 100.40, × 75.6 = 75.9024, 100, , 5. What should be the main elements of ‘employment, policy’ in India in the present context?, Ans. Following should be the main elements of employment, , policy in India in the present context, (i) The employment policy should emphasise on both, complete and more productive employment., (ii) Employment policy must have the objective of higher, rate of capital formation., (iii) Employment should be generated in the normal, process of development., (iv) Employment policy should give more emphasis to, self-employment., (v) Measures should be taken to increase employment, opportunities for women., (vi) Emergence of destabilising factors in the economy, should be avoided through greater efficiency in, planning., , 6. What is seasonal unemployment? Suggest, measures for reducing this kind of, unemployment in India., Ans. It refers to a situation where a number of persons are, , not able to find job in a particular season. It occurs in, case of agriculture, ice-cream factories, woollen, factories, etc. Following measures may be suggested to, reduce seasonal unemployment, (i) Promotion of multiple cropping, i.e., raising more, than one crop on the same piece of land in a year., (ii) Development of activities allied to agriculture, such as animal husbandry, dairy farming,, horticulture, etc to provide extra employment, throughout the year., (iii) Public investment in rural areas in such fields as, irrigation, drainage, flood control, land and, environment, improvement of rural roads, schools,, hospitals, etc., (iv) Promotion of on-farm investment. Overhaul of, machinery, training of farm labour and, programmes for eradication of illiteracy during, slack seasons., (v) Mechanisation of peak season activities so that a, proportion of the labour force is permanently, shifted from agriculture to non-seasonal activities, and surplus labour in the slack season is reduced., (vi) Establishment of a variety of industries which, operate at different times of the year so that labour, may be kept employed almost throughout the year, by shifting from one seasonal industry to another., , 7. How is unemployment different from, underemployment? How is unemployment, measured in India?, Ans. Unemployment is a situation in which people are, , willing to work and capable to work, but still they are, not getting work. Underemployment, on the other, hand, is a situation in which an individual is working, much below his potential. As per 27th round of NSSO,, three types of estimates are available, (i) Usual Status Unemployment It is measured in, number of persons who remained unemployed for, a major part of the year., (ii) Weekly Status Unemployment It is measured in, number of persons who did not find any work even for, an hour during the week proceeding the survey week., (iii) Daily Status Unemployment Daily status, unemployment is measured in terms of number of, man days a person was not getting work on a day, during the week proceeding the survey week., Out of these three, the daily status unemployment, concept is most appropriate because it takes into, consideration both open and under employment., Unemployment Rate by Daily Status, Daily Status Unemployment, =, ×100, Number of Man Days Available
Page 90 :
Chapter Test, Multiple Choice Questions, , 1., , A worker who owns and operates his own enterprise is said to be a ……… ., (a), (b), (c), (d), , 2., , casual wage worker, self-employed worker, regularly employed worker, None of the above, , Workers enjoy job security in, (a) private sector, (c) organised sector, , 3., , (b) unorganised sector, (d) agricultural sector, , Female worker participation is, (a) higher in urban areas, (c) higher in rural areas, , 4., , Unemployment is defined as, (a), (b), (c), (d), , 5., , (b) lower in rural areas, (d) None of these, , a section of the population is not capable of being employed, a section of population willing to work but unable to find employed, the section of population that is waiting to be employed, the section of population that are without the skill needed by employers, , The problem of unemployment in India is largely, (a) seasonal, (c) structural, , (b) frictional, (d) cyclical, , Short Answer (SA) Type Questions, , 1., 2., 3., , Briefly define casual wage labourers., , 4., , There are several examples in the rural areas of India where there are more workers in the family but gross income of, the family is low. How do you explain this paradox?, , 5., , How can the problem of educated unemployment be solved?, , Explain briefly the different categories of hired workers., A modest transformation in occupational structure of India only points to its modest achievement in the area of growth, and development. Do you agree?, , Long Answer (LA) Type Questions, , 1., , (i) Empowerment of women is related to employment of women. Comment., (ii) Government has initiated many unemployment reduction programmes. Describe any two such programmes., , 2., , There is a mismatch between ‘GDP growth’ and ‘employment growth’ in India. How do you justify this statement?, , Answers, Multiple Choice Questions, 1. (b), , 2. (c), , 3. (c), , 4. (b), , 5. (c), , For Detailed Solutions, Scan the code
Page 91 :
CBSE Term-II Economics XII, , 80, , CHAPTER 02, , Infrastructure, in India, In this Chapter..., l, , Infrastructure, , l, , Health Sector : Component of, Social Infrastructure, , Infrastructure, It is a basic physical and organisational structure needed for, the operation of a society or an enterprise. It provides, supporting services in the main areas of industrial and, agricultural production, domestic and foreign trade and, commerce., , Types of Infrastructure, Infrastructure is broadly categorised as social and economic, infrastructure., They are discussed below, 1. Social Infrastructure It refers to the core, elements of social change which serve as a foundation for, the process of social development of a country., It contributes to economic processes indirectly and from, outside the system of production and distribution., For example, educational institutions, hospitals, sanitary, conditions and housing facilities, etc., 2. Economic Infrastructure It refers to all such elements, of economic change which serve as a foundation for the, process of economic growth., These help in the process of production directly. For, example, transportation, communication, energy/, power, etc., , Importance of Infrastructure in Development, l, , l, , l, , l, , l, , It helps to increase the productivity of factors of, production., It induces investment., It generates linkages in production., It enhances size of the market., It enhances ability to work., , The State of Infrastructure in India, The state of infrastructure in India is highly inadequate., India is lagging behind on various sectors of infrastructure, from not only developed countries but also from many small, and developing countries. Also, in addition to concentrating, on basic infrastructure such as irrigation, transportation and, power generation, proper attention should also be given to, develop banking, finance and communication sector., Traditionally, the government has been solely responsible for, developing the country’s infrastructure. But it was found that, the government’s investment in infrastructure was not, adequate., So, in joint partnership with the public sector, the private, sector has started playing a very important role in, infrastructural development. But, still India invests only 5%, of its GDP in infrastructure.
Page 92 :
81, , CBSE Term-II Economics XII, Infrastructural development and economic development go, hand-in-hand. If proper attention is not paid to infrastructure, development, then economic development will also be, adversely affected., , 1. Primary Healthcare Primary healthcare system in, India includes, (i) Education concerning prevailing health problems, and methods of identifying, preventing and, controlling them., (ii) Promotion of food supply and proper nutrition and, adequate supply of water and basic sanitation., (iii) Maternal and child healthcare., (iv) Immunisation against major infectious diseases and, injuries., (v) Promotion of health and provision of essential, drugs., 2. Secondary Healthcare When condition of a patient is, not managed by PHCs, they are referred to secondary, or tertiary hospitals. Healthcare institutes having better, facilities for surgery, X-ray, ECG (Electro Cardio, Graph) are called secondary healthcare institutes., 3. Tertiary Healthcare In tertiary sector, there are the, hospitals which have advanced level equipments and, medicines and undertake all the complicated health, problems, which could not be managed by primary and, secondary hospitals., For exmaple, All India Institute of Medical Sciences, (AIIMS), Post Graduate Institute (PGI), Chandigarh,, Jawaharlal Institute of Postgraduate Medical Education, and Research (JIPMER), Pondicherry, National, Institute of Mental Health and Neuro Sciences, (NIMHNS), Bangalore and All India Institute of, Hygiene and Public Health, Kolkata., , Infrastructure in Rural Area, State of infrastructure in rural India can be understood from, the following points, Inspite of the technological progress, women of rural India, are still using bio-fuels to meet their daily energy, requirement. About 90% of the rural households use, bio-fuels for cooking., The Census 2001 shows that in rural India, only 56%, households have an electricity connection and 43% still use, kerosene., Tap water availability is limited to only 24% rural, households. About 76% rural population drinks water from, open resources such as wells, ponds, etc. Women go long, distances to fetch water for their basic needs., Access to improved sanitation in rural areas was only 20%., l, , l, , l, , l, , Health Sector: Component of, Social Infrastructure, A person’s ability to work depends largely on his health., Good health enhances the quality of life. Health is not only, the absence of disease but also the ability to realise one’s, potential. It is a yardstick of one’s well-being., , Health Infrastructure in India, Health infrastructure includes hospitals, doctors, nurses and, other para-medical professionals, beds, equipment required, in hospitals and a well developed pharmaceutical industry., Only the presence of infrastructure is not enough to have, healthy people, but it should also be accessible to all the, people easily. In India, health infrastructure comprises both,, the public sector and the private sector., , Health Infrastructure in Public Sector, The government has the constitutional obligation to guide, and regulate all health related issues such as medical, education, adulteration of food, drugs and poisons, medical, profession, vital statistics, mental deficiency and lunacy., Central council of health and family welfare collects, information and renders financial and technical assistance to, state governments, union territories and other bodies for, implementation of important health programmes in the, country. India’s health infrastructure and healthcare is made, up of a three-tier system which is as follows, , Health Infrastructure in Private Sector, In recent time, private health infrastructure has grown largely., Private sector health infrastructure is explained below, About 70% of the hospitals running in India belong to, private sector., Nearly 60% of dispensaries are run by the same private, sector. They provide healthcare for 80% of out-patients and, 46% of in-patients., It has also been contributing significantly in medical, education and training, medical technologies and, diagnostics, manufacture and sale of pharmaceuticals,, hospital construction and medical services., There are large number of hospitals run by voluntary, agencies and the private sector, equipped with, professionals and para-medical professionals trained in, medical, pharmacy and nursing colleges., It provides quality healthcare services at reasonable cost, and has also earned foreign exchange for the country by, promoting medical tourism., l, , l, , l, , l, , l
Page 93 :
CBSE Term-II Economics XII, , 82, Problems Related to, Health Infrastructure in India, The following problems are related to health infrastructure, in India, 1. Urban-rural and Poor-rich Divide Differences in, medical healthcare between urban-rural and poor-rich, can be understood from the points given below, Only one-fifth of total hospitals are located in rural, areas. Rural India has about half the number of, dispensaries. People in rural areas do not have, sufficient medical infrastructure., This leads to difference in the health status of people., Out of 6.3 lakh beds in government hospitals, roughly, 30% are available in rural areas., There are only 0.36 hospitals for every one lakh people, in rural areas while urban areas have 3.6 hospitals for, the same number of people., The PHCs located in rural areas do not offer even, X-ray or blood testing facilities which, for a city, dweller, constitute basic healthcare. Even though 380, recognised medical colleges produce 44,000 medical, graduates every year, still there is shortage of doctors, in rural areas. One-fifth of these doctors migrate from, one country to another for better job opportunities., The poorest 20% of Indians living in both urban and, rural areas spend 12% of their income on healthcare,, while the rich spend only 2%., 2. Women’s Health Women constitute about half the total, population in India. They suffer many disadvantages as, compared to men in the areas of education,, participation in economic activities and healthcare., The child sex ratio has been deteriorated from 927 in, 2001 to 914 in 2011. There is growing incidence of, female foeticide in the country., Close to 3,00,000 girls under the age of 15 are not only, married but have already borne children at least once., More than 50% of married women between the age, group of 15 and 49 years suffer from anaemia caused by, iron deficiency., It has contributed to 19% of maternal deaths. Abortions, are major cause of maternal morbidity and mortality in, India., l, , l, , l, , l, , Measures to Improve Health Sector, The following measures should be undertaken to improve the, health sector, Public health services should be decentralised., For long-term benefits, education and health infrastructure, should be improved., The importance of telecom and IT sector in spreading, health awareness should be recognised., Primary healthcare centres should be improved., The divide between the urban and rural healthcare should, be checked because it can destabilise the socio-economic, fabric of our country., l, , l, , l, , l, , l, , Indicators of Health : A Critical Appraisal, The following indicators will help the students to assess, health and health infrastructure in India, The infant mortality rate is quite high in India. In 2013, it, was 41., The under-5 mortality rate is also high at 53., Only 67% of the births in India are monitored by skill, attendants., Only 72% of the population is fully immunised., Government spends only 4% of its GDP on health. It is, 4.5% of the total government spending., India bears a frightening 20% of the Global Burden of, Diseases (GBD). More than half of GBD is accounted for, by communicable diseases such a diarrhoea, malaria and, tuberculosis., Every year around five lakh children die of water-borne, diseases. Malnutrition and inadequate supply of vaccines, lead to the death of 2.2 million children every year. AIDS, is also a major threat., Less than 20% of the population utilises public health, facilities. This is because only 38% of PHCs have the, required number of doctors and only 30% of PHCs have, adequate stock of medicines., l, , l, , l, , l, , l, , l, , l, , l, , Indian Systems of Medicine (ISM), India has its own well–developed alternate system of health, care, namely AYUSH consisting of six systems, Ayurveda,, Yoga, Unani, Siddha, Naturopathy and Homeopathy., At present, there are 3167 ISM hospitals, 26,000 dispensaries, and 7 lakhs registered practitioners in India.
Page 94 :
83, , CBSE Term-II Economics XII, , Chapter, Practice, PART 1, Objective Questions, l, , Multiple Choice Questions, 1. The structure which contributes directly to the, economic process within the system of production, and distribution is known as, , (a) Social infrastructure, (b) Political infrastructure, (c) Technological infrastructure, (d) Economic infrastructure, Ans. (d) Internal facilities of a country make business activity, possible, such as communication transportation and, distribution networks, financial institutions and markets, and energy supply systems., , 2. Which of the given statement(s) explain the, relevance of infrastructure?, (a) Modern agriculture is highly dependent on, infrastructural facilities, (b) Infrastructure helps in increasing productivity of, factors of production, (c) It helps in improving quality of life of people, (d) All of the above, Ans. (d) All of the above, , 3. Which of the following statements is incorrect with, regards to infrastructure?, (a) Infrastructure contributes to economic development., (b) Infrastructure provides support service., (c) All infrastructural facilities have a direct impact on the, production of goods and services., (d) Inadequate infrastructure can have multiple adverse, effects on health., Ans. (c) Some infrastructural facilities have a direct impact on, production of goods and services while others give indirect, support by building the social sector of the economy., , 4. Match the following., Column I, (Economies), , Column II, (Infrastructural Needs), , A. Low income economies, , (i) Telecommunications, and power, , B. Developing economies, , (ii) Health, housing and, sanitation, , C. Developed economies, , (iii) Irrigation and, transportation, , Codes, A, (a) (i), (b) (iii), (c) (ii), (d) (i), Ans. (b) (iii), , B, (ii), (ii), (i), (iii), (ii), , C, (iii), (i), (iii), (ii), (i), , 5. Which of the following programmes was launched, in 2006 with the objective of correcting regional, imbalances in provision of healthcare?, (a) Pradhan Mantri Swasthya Suraksha Yojana, (b) National Rural Health Mission, (c) Janani Suraksha Yojna, (d) Integrated Disease Surveillance, Ans. (a) Pradhan Mantri Swasthya Suraksha Yojana (PMSSY), aims at correcting the imbalances in the availability of, affordable healthcare facilities in the different parts of the, country. The scheme was approved in March 2006., , 6. Indian system of medicine comprises of ……, systems., (a) three, (b) four, (c) five, (d) six, Ans. (d) India’s medicine system comprises of Homeopathy,, Allopathic, Unani,Yoga, Siddha and Naturopathy.
Page 95 :
CBSE Term-II Economics XII, , 84, 7. Which of the following statements is/are correct?, (a) Social infrastructure directly contributes in the, production activities., (b) ‘Jail Cost of Living’ index was introduced by Amartya, Sen., (c) Poverty line of rural areas has been set below poverty, line of urban areas., (d) India’s infant mortality rate is higher than that of, Bangladesh., Ans. (d) India’s infant mortality rate is higher than that of, Bangladesh., , 8. Write the correct pair., Column I, , Column II, , A. Mid-day Meal Scheme, , (i) This scheme was launched, on 2nd October, 1975, , B. Valmiki Ambedkar, Awaas Yojana, , (ii) It seeks to improve the, living conditions of slum, dwellers in urban areas, , C. Pradhan Mantri, Gramodya Yojana, , (iii) This scheme was launched, in 2007, , D. Integrated Child, Development Scheme, , (iv) Under it, cooked meal is, provided to students, studying in government, schools, , 12. Which of the following comes under the purview of, primary healthcare system in India?, (a) Immunisation, proper nutrition and health education, (b) Surgery, research and specialised healthcare, (c) X-rays and ECG, (d) All of the above, Ans. (a) Immunisation, proper nutrition and health education, , 13. Vaccination, proper diet, promotion of food supply,, sanitation, maternal and child healthcare, provision, of essential drugs, etc. health services are provided, by ............. in India., (a) primary healthcare system, (b) secondary healthcare system, (c) tertiary healthcare system, (d) All of the above, Ans. (a) primary healthcare system, , 14. Morbidity is defined as …… ., (a) proneness to fall ill, (b) high infant mortality rate, (c) high maternal mortality rate, (d) low life expectancy rate, Ans. (a) The term morbidity refers to the rate at which a disease, occur in a population., , 15. Which of the following is not a function of primary, , Codes, (a) A-(i), , (b) B-(ii), , (c) C-(iii), , (d) D-(iv), , Ans. (b) B-(ii), , 9. Health infrastructure includes..... ., (a) nurses, (b) pharmaceutical industries, (c) doctors, (d) All of these, Ans. (d) Health infrastructure includes advanced machine,, specialised doctor, nurses and other paramedic, professionals and pharmaceutical industries., , 10. Infrastructure contributes to economic development, of the country through…… ., (a) improving the quality of life., (b) raising the productivity of factors of production., (c) Both (a) and (b), (d) None of these, Ans. (c) Both (a) and (b), , 11. Write the correct pair., Column I, , Column II, , A. Primary healthcare, centres, , (i) Facilities for surgery, , B. Secondary, healthcare centres, , (ii) Maternal and child, healthcare only, , C. Tertiary healthcare, centres, , (iii) Advanced level equipment, and specialised healthcare, , Codes, (a) A-(i), (c) C-(iii), Ans. (c) C-(iii), , (b) B-(ii), (d) None of these, , health care?, (a) Spreading education concerning prevailing health, problems, (b) Promoting food supply and proper nutrition, (c) Conducting research, (d) Providing essential drugs, Ans. (c) The main functions of primary health care are, treatment and care of people with health problem,, promoting good health, preventing health problems,, early intervention, managing ongoing and long-term, conditions., , 16. Which of the given state is not lagging behind in, terms of healthcare system?, (a) Kerala, (b) Bihar, (c) Uttar Pradesh, (d) Madhya Pradesh, Ans. (a) Kerala continued to top the list for the best performing, State in the health sector among the 21 large States., , 17. Which plan is to provide at least one community, health worker for every village at a norm of 1,000, population?, (a) JSY, (b) National Health Programme, (c) NRHM, (d) IDPS, Ans. (a) JSY, Janani Suraksha Yojana (JSY) under the overall, umbrella of National Rural Health Mission (NRHM). The, objective is to reduce overall maternal mortality ratio and, infant mortality rate.
Page 96 :
85, , CBSE Term-II Economics XII, , 18. AYUSH is a part of Indian systems of medicine. It, , Ans. (b) Infrastructure contributes to the economic development, , of a country both by increasing the productivity of the, factors of production and improving the quality of life of, its people., , does not include ............. ., (a) Allopathy, (b) Naturopathy, (c) Homeopathy, (d) Ayurveda, Ans. (a) AYUSH stands for Ayurveda, Yoga, Unani, Siddha,, Naturopathy and Homeopathy., l, , 5. Assertion (A) The health status of India has, surpassed those of Europe and North America., Reason (R) India still has high birth rate as, compared to developed nations. Frequent births of, children adversely affect the health of mothers., Unhealthy mothers give birth to unhealthy child., , Assertion-Reasoning MCQs, Directions (Q.Nos. 1 to 7) There are two statements, marked as Assertion (A) and Reason (R). Read the, statements and choose the appropriate option from the, options given below, , Ans. (d) In developing countries, children are needed as a, , labour force and to provide care for their parents in old, age. In these countries, fertility rate is higher due to the, lack of access to contraceptives and generally lower level, of female education., , (a) Both Assertion (A) and Reason (R) are true and Reason, (R) is the correct explanation of Assertion (A)., (b) Both Assertion (A) and Reason (R) are true, but Reason, (R) is not the correct explanation of Assertion (A)., (c) Assertion (A) is true, but Reason (R) is false., (d) Assertion (A) is false, but Reason (R) is true., , 6. Assertion (A) The distribution of our existing health, infrastructure is inequitable., Reason (R) About 70 percent of India’s population, lives in urban area but only one-fifth of hospitals, are located in urban areas., , 1. Assertion (A) Economic infrastructure and social, infrastructure are interdependent on each other., Reason (R) Infrastructure such as power, water,, transport, communication, etc. are used as inputs, for production in the directly productive sector., , Ans. (c) Access to health care is very much asymmetric, , between rural and urban India. While urban residents, have a choice between public or private providers, the, rural residents face far fewer choices., , Ans. (b) Both economic and social infrastructures are, , 7. Assertion (A) There has been a reduction in infant, , interdependent and complementary to each other. While, economic infrastructure fosters economic growth, social, infrastructure enhances the quality of standard of living, and thereby leads to the welfare of the economy as a, whole., , mortality rate in India., Reason (R) Factors contributing to this slowing, decline include the lower social, cultural and health, status of women in India. Thus, improving female, education and nutrition, as well as increasing the use, of health services during pregnancy and delivery, would lower child mortality., , 2. Assertion (A) It is imperative to develop the status, of both social and economic infrastructure., Reason (R) It enhances overall productivity and, expands the dimensions of economic development., , Ans. (a) Both Assertion (A) and Reason (R) are true and Reason, , (R) is the correct explanation of Assertion (A)., , Ans. (b) Social infrastructure plays an important role in both, , the economic development of a nation and the, development of society’s quality of life. Social, infrastructure enhances social well being and furthers, economic growth by providing basic services and, facilities which allow businesses to develop and flourish., , 3. Assertion (A) Government has launched the, ‘National Infrastructure Pipeline’ for period of, 2020-2030., Reason (R) The objective of the NIP is to provide, equitable access to infrastructure to all., Ans. (d) The National Infrastructure Pipeline (NIP) is a group, , of social and economic infrastructure projects in India, over a period of five years with an initial sanctioned, amount of ` 102 lakh crore., , 4. Assertion (A) Infrastructure is a support system on, which the efficient working of a modern industrial, economy depends., Reason (R) The quality of transport and, communication can affect access to healthcare., , l, , Case Based MCQs, 1. Direction Read the following text and answer the, question no. (i) to (vi) on the basis of the same., India is now the fourth largest and one of the, fastest growing economy in the world. However, it, faces both a tremendous backlog and a growing, demand for infrastructure. The Indian economy, expanded significantly in fiscal year 2006., According to advance estimates released by the, central statistical organisation, the economy, recorded a Gross Domestic Product (GDP) growth, rate (at factor cost) of 9.2% at constant prices,, compared with 9% in the previous year., The increase in growth rates in recent years is, reflected in the 11th five-year plan (FY 2007–FY, 2012) average annual growth target of 9%, compared with the 10th plan target of 8%.
Page 97 :
CBSE Term-II Economics XII, , 86, High quality infrastructure is essential to harness, the growth impulses in the economy. The planning, commission (equivalent to a ministry of planning), has observed that poor infrastructure is India’s, ‘‘Achilles’ heel’’ which is estimated to cost India, 3-4% of lost GDP a year. The planning commission, has estimated that India needs to increase its, spending on infrastructure from 4-5% to 9% of, GDP, if it is to achieve its growth targets., (i) Which of the following are advantages of a sound, infrastructure in India?, (a) Cost effectiveness, (b) Attracts foreign capital, (c) Improves growth process, (d) All of the above, Ans. (d) All of the above, , (ii) ……… is not a component of economic, infrastructure., (a) Energy, (b) Education, (c) Communication, (d) Transport, Ans. (b) Roads, railways, telecommunication systems,, waterways, airways, financial institutions, electricity,, water supply etc are the examples of economic, infrastructure., , (iii) GDP, growth and infrastructure are …………, proportionate., (a) directly, (b) increasing, (c) indirectly, (d) declining, Ans. (a) directly, , (iv) Infrastructural development in India has been a, responsibility of government sector only. Private, sector has not been actively involved in, infrastructural development. Which of the, following is/are the reason(s) for the same?, (a) Huge cost involvement (b) Long gestation period, (c) Less profitability, (d) All of these, Ans. (d) All of these, , (v) Assertion (A) India is a case of an ‘over-urbanised’, country., Reason (R) Most of the large cities in India do not, have adequate infrastructure., Alternatives, (a) Both Assertion (A) and Reason (R) are true and Reason, (R) is the correct explanation of Assertion (A)., (b) Both Assertion (A) and Reason (R) are true, but Reason, (R) is not the correct explanation of Assertion (A)., (c) Assertion (A) is false, but Reason (R) is true, (d) Both the statements are false, Ans. (a) Both Assertion (A) and Reason (R) are true and Reason, (R) is the correct explanation of Assertion (A)., , (vi) Who is an ANM?, (a) Auxiliary Nursing Midwife, (b) Auxiliary National Medication, (c) Auxiliary Neuropathic Medicine, (d) Auxiliary Nursing Method, Ans. (a) Auxiliary Nursing Midwife is the first person who, provides primary health care in rural areas., , 2. Direction Read the following text and answer the, question no. (i) to (vi) on the basis of the same., Infrastructure is often called as the lifeline of the, economy of a nation. It comprises of a well, established and well knit network of power, telecom,, ports, airports, roads, civil aviation, railways and, road transport in a country. Countries need adequate, infrastructure so that various economic activities in, an economy are executed efficiently, smoothly and, above all in time., The deficiencies in the infrastructural needs of a, nation cannot be made up through imports rather, the best approach is that it must be created within, the domestic economy to put it on through the, higher growth trajectory., However,building of infrastructure requires large, and lumpy investment and has a relatively long, gestation period., Due to this fact, infrastructural facilities are either, built or run by the government and public sector, enterprises and if private sector is permitted to, make investment and run infrastructural projects,, they must be regulated in order to ensure quality, infrastructure to one and all in the society., (i) Identify the main category of infrastructure, mentioned in the above paragraph., (a) Social, (c) Personal, Ans. (b) Economic, , (b) Economic, (d) Financial, , (ii) The demand-supply gap of major infrastructural, facility like power, transport can be met through, .......... ., (a) active role of public and private sector, (b) active role of public sector only, (c) active role of private sector only, (d) None of the above, Ans. (a) active role of public and private sector, , (iii) ‘Infrastructure is often called as the lifeline of the, economy of a country,as it helps in increasing the, productivity of the factors of production and, enhancing the quality of life’., (a) True, (c) Partially true, Ans. (a) True, , (b) False, (d) Partially false
Page 98 :
87, , CBSE Term-II Economics XII, (iv) Infrastructure enhances economic growth through, (a) improved health and educational status, (b) bridging regional development, (c) provision of employment opportunities, (d) All of the above, Ans. (d) All of the above, , 2. Explain the two categories into which infrastructure, , (v) Assertion (A) Infrastructure is the basic fundamental, structure of economics development of a country., Reason (R) Economic impact has a direct bearing, withthe production activity of an economy., Alternatives, (a) Both Assertion (A) and Reason (R) are true and Reason, (R) is the correct explanation of Assertion (A), (b) Both Assertion (A) and Reason (R) are true, but Reason, (R) is not the correct explanation of Assertion (A), (c) Assertion (A) is true, but Reason (R) is false, (d) Assertion (A) is false, but Reason (R) is true, Ans. (b) Economic infrastructure definitely shows the mobility, of labour and capital within the economy. It results in the, overall growth of towns and cities. Infrastructure provides, for a lot of employment generation and employment, opportunities., , (vi) Match the following, Column I, A. Social infrastructure, , Column II, (i), , The poor, , B. Nonconventional energy, , (ii) Education, , C. Health infrastructure, biased against, , (iii) Outsourcing, , D. Essential indication of, good health, , (iv) Biomass, , E. Infrastructural facilities, , (v), , Codes, A, (a) (ii), (b) (i), (c) (iii), (d) (v), Ans. (a) (ii), , Ans. Infrastructure is divided into two categories, i.e., , economic infrastructure and social infrastructure., Infrastructure associated with energy, transportation and, communication are included in the former category, whereas those related to education, health and housing, are included in the latter., Economic infrastructure and social infrastructure are, interdependent on each other. For example, the, development and expansion of transport and, communication network requires a team of qualified and, skilled persons. Similarly, a strong infrastructure of, education and health becomes meaningless, if it is not, supported by a good transport and communication, system., , 3. Some infrastructural facilities have a direct impact, on production of goods and services while others, give indirect support by building the social sector, of the economy. Using the above information,, differentiate between social and economic, infrastructure., as follows, Basic, , High expectancy of life, , B, C, D, E, (iv) (i) (v) (iii), (ii) (iii) (iv) (v), (iv) (i) (iii) (v), (iv) (iii) (ii) (i), (iv) (i) (v) (iii), , Short Answer (SA) Type Questions, 1. Explain the term ‘infrastructure’., , is divided. How are both interdependent?, , Ans. Difference between social and economic infrastructure is, , PART 2, Subjective Questions, l, , power stations, oil and gas pipelines, telecommunication,, schools and colleges, hospitals, sanitary system and also, the monetary system including banks, insurance and, other financial institutions. Infrastructure provides, support system to economic and social development., , (NCERT), , Ans. Infrastructure refers to the supporting services in the, , main areas of industrial and agricultural production,, domestic and foreign trade and commerce. These, services include roads, railways, ports, airports, dams,, , Social Infrastructure Economic, Infrastructure, , Meaning, , Social infrastructure, helps the economic, system from outside (i.e., indirectly)., , Economic infrastructure, helps the economic, system from the inside, (i.e. directly)., , Resource, improvement, , Social infrastructure, improves the quality of, human resources., , Economic infrastructure, improves the quality of, economic resources., , Expenditure, , Expenditure on it will, raise the stock of human, capital over time. Social, infrastructure leads to, economic infrastructure., , Expenditure on it will, raise the stock of, physical capital over, time.Economic, infrastructure leads to, social infrastructure., , Example, , Health, education and, housing., , Energy, transport and, communication., , 4. How are economic growth and infrastructure, development related to each other?, Ans. Infrastructure Promotes Growth Sufficient availability, , of the power, water, transport, etc. may result in optimal, utilisation of assets. Infrastructure developments such as, transport, power, finance, etc. expand the size of markets, and improve productivity significantly. Infrastructure, brings modern technology in all sectors.
Page 99 :
CBSE Term-II Economics XII, , 88, There is a close association between infrastructure, spending and GDP growth. Around 6.5 % of the total, value added is contributed by infrastructure services in, UDCs, 9 % in developing countries and 11 % in, developed countries. Infrastructural development is, important not only for economic growth, globalisation, technological innovation in manufacturing but also for, poverty reduction., Growth Promotes Infrastructure Growth increases, demand of infrastructure. Obviously, as income, increases, people will demand more of transport,, communication, energy, etc. Consequently, in UDCs,, basic infrastructure such as water, irrigation is most, important. In developing economies, demand for, transport grows fast. In developed economies,, power and telecommunication occupy more, importance., , 5. How is the national income of a country related to, the level of infrastructural development? Explain., Ans. The composition of infrastructure requirements changes, , significantly with the increase in country’s national, income. Basic infrastructure facilities such as irrigation,, transport and power are more important for low income, countries., However, as economies grow and they are able to satisfy, their basic consumption demand, the share of, agriculture in the economy shrinks and more service, related infrastructure become important. Thus, the, share of power and telecommunication infrastructure is, greater in high income countries., , 6. How does infrastructure impact productivity and, induce investment?, Ans. Impact on Productivity Infrastructure plays a major, , role in raising the productivity of primary, secondary, and tertiary sector., Productivity of primary sector has increased due to the, provision of better irrigation facilities. Productivity of, secondary sector has increased because of development, in energy sector and tertiary sector has benefitted by, changes in transportation and communication sector., Induces Investment A well-developed infrastructure, attracts foreign investors. Thus, infrastructure induces, investment and increases profitability., , 7. Expansion of one industry facilitates the expansion, of the other. How economic growth can become a, dynamic process and a self-propelling activity of, change?, Ans. Availability of proper means of transport and, , communication, ample sources of energy and, a developed system of banking and finance generate an, environment of inter-industrial linkages., In this situation, expansion of one industry facilitates the, expansion of the other. Accordingly, growth becomes a, dynamic process and a self-propelling activity, of change., , 8. What is the state of rural infrastructure in India?, (NCERT), Ans. State of infrastructure in rural India can be, , understood from the following points, (i) Inspite of the technological progress, women of rural, India are still using bio-fuels to meet their daily, energy requirements. About 90% of the rural, households use bio-fuels for cooking., (ii) The Census 2001 shows that in rural India, only 56%, households have an electricity connection and 43%, still use kerosene., (iii) Tap water availability is limited to only 24% rural, households. About 76% of the population drinks, water from open resources such as wells, ponds, etc., Women go long distances to fetch water for their, basic needs., (iv) Access to improved sanitation in rural areas was only, 20%., , 9. Why do medical tourists come to India?, Ans. Medical tourists come to India to avail our health services, , which combine latest medical technologies with qualified, professionals and are cheaper for foreigners as compared to, costs of similar healthcare services in their own countries., They come for surgeries, liver transplants, dental and even, cosmetic care. In the year 2004-05, as many as 1,50,000, foreigners visited India for medical treatment., , 10. Write a note on the various healthcare centres in, India., (i) Primary healthcare centre, (ii) Secondary healthcare centre, (ii) Tertiary healthcare centre, Ans. (i) Primary healthcare centres are small hospitals, managed by a single doctor, a nurse and a limited, quantity of medicines. They are located in villages, and small towns., (ii) Secondary healthcare centres are better healthcare, centres and provide facilities for surgery, ECG and, X-ray. They are located in bigtowns and district, headquarters., (iii) Tertiary healthcare institutions are specialised, medical centres and undertake complicated, healthcare problems., , 11. Give an account of the contribution of community, and non-profit organisation to healthcare in India., Ans. Community participation functions with the idea that the, , people can be trained and involved in Primary Healthcare, System. Trade unions have built Healthcare services to, give low-cost healthcare to their members as well as the, people from nearby villages. For instance, Shahid hospital, was built in 1983 and is sustained by the workers of, Chhattisgarh mines Shramik Sangh in Durg, Madhya, Pradesh. SEWA in Ahmedabad and ACCORD in Nilgiris, are examples of some non-profit organisations that, contribute to healthcare in India.
Page 100 :
89, , CBSE Term-II Economics XII, , PHCs located in rural areas do not have even X-ray or, blood test facility. 20% of doctors passing leave the, country for better prospects., Many others are interested in urban areas, rare are the, ones interested in rural areas. The poorest one fifth, spends 12% of their income on health while rich spend, only 2% of their income on health., , 12. Highlight the points that reflect development in, the health services after independence in India., Ans. The following are the points that reflect development in, , the health services after independence in India, (i) Decline in Death Rates Death rate has come down, from as high as 27.4 per thousand in 1951 to 6.3 per, thousand in 2015., (ii) Reductions in Infant Mortality Infants mortality, rate has significantly reduced from 140 per thousand, in 1951 to 32 per thousands in 2015., (iii) Rise in Life Expectancy Expectancy of life has risen, from 50 years in 1951 to 68.3 years in 2012., , 13. A study estimates that medical costs alone push, down 2.2% of the population below the poverty line, each year. How?, Ans. Public health facilities are highly inadequate in our, , country. These facilities are also lacking in quality. So, even poor and middle class people do not prefer to use, these facilities., So, in case of a medical emergency, they are forced to, avail expensive services of private hospitals and health, centres. These expenses prove to be a heavy burden, on these families and they are forced to sell whatever, valuables they have, to fund the treatment. This pushes, the families below poverty line., , 14. Do you think regional inequality exists even in health, infrastructure in India? Give reasons for your answer., Ans. Yes, the development of health infrastructure has shown, , gender, income and regional biasness in India. Rural, areas do not have access to or cannot afford medical care., Even though majority of population lives in rural areas,, only one-fifth of India’s hospitals are located in rural, areas with only half the number of dispensaries. Out of, 6.3 lakh beds, roughly 30% of them are available in rural, areas. The PHCs in rural areas do not offer basic medical, care like X-ray or blood testing devices., In rural areas, the percentage of people who have no access, to proper aid has risen from 15 in 1986 to 24 in 2003. States, like Bihar, Madhya Pradesh, Rajasthan and Uttar Pradesh, are relatively lagging behind in health care facilities., , 15. Health care in India is suffering from urban-rural, and rich-poor divide. Explain how?, Ans. It is rightly said that health care in India suffers from, , urban-rural and rich-poor divide. 70% population is, living in rural areas while only 20% of the hospitals are, located in rural areas. It means 80% hospitals are serving, 30% population. There are only 0.36% hospitals for one, lakh people in rural areas whereas there are 3.6%, hospitals per one lakh population in urban areas, i.e., number of hospitals in urban areas is 10 times the, number of hospitals in rural areas., In villages, specialised medical care is completely, missing like paediatrics, gynaecology, anaesthesia and, obstetrics., , l, , Long Answer (LA) Type Questions, 1. Infrastructure provide supporting service in the, main areas of industrial and agricultural, production. In the context of the above statement,, explain how infrastructural facilities boost-up the, production?, , Ans. Infrastructural facilities increases production of the, , country both by increasing the productivity of the factors, of production and improving the quality of life of its, people. Infrastructure plays a major role in raising the, productivity in all the three sectors, viz. primary,, secondary and tertiary sector., (i) Productivity in primary sector is increased because, irrigation facilities have reduced the dependence on, monsoon., (ii) Production in the secondary sector has increased, due to the improvements made in the energy sector., (iii) Production in the tertiary sector has increased due, to the improvements made in the means of, transportation and communication., Also, social infrastructure increases the quality of life of, workers, thereby increasing their efficiency. Health care, centres, educational institutions and other such facilities, develop the skills of the workers, which increases the, ability and efficiency to work. Thus, we can conclude that, infrastructure boosts production., , 2. Infrastructure contributes to the economic, development of a country. Do you agree? Explain., (NCERT), Ans. Yes, infrastructure acts as a support system for production, , activity in the economy and thereby, contributes to, economic development., The following points will further explain the role of, infrastructure in the economic development of a country, (i) Infrastructure Increases Productivity Social and, economic infrastructure facilitates production. The, availability of quality infrastructure guarantees, increase in production and productivity. Infrastructure, ensures easy movement of goods and raw materials,, thereby, reducing inefficiencies and lead to efficient, utilisation of scarce resources and eliminate wastages., (ii) Infrastructure Encourages Investment, Infrastructure provides an environment conducive, to investment. Lack of facilities discourage, investment. For example, an investor will not invest, in absence of basic infrastructure such as transport, and communication.
Page 101 :
CBSE Term-II Economics XII, , 90, (iii) Infrastructure generates Linkages in Production, Infrastructure promotes economic development by, way of various forward and backward linkages. In, other words, infrastructure provides scope for, expansion of one industry due to the expansion of, the other by way of forward and backward linkages., The process of economic growth becomes a, dynamic process in the presence of sufficient, infrastructure facilities. This can be explained with, the help of a forward linkage. For example, if, irrigation facilities boost agricultural production,, then the related industries that depend on, agriculture for the supply of raw materials, simultaneously experience increased production., (iv) Infrastructure enhances Size of the Market, Infrastructure widens the size of the market. The, fast and cost effective movement of raw materials, and finished goods in bulk enables a producer to, offer its products across the country and even, across international boundaries., , 3. Describe the meaning of public health. Discuss, the major public health measures undertaken by, the state in recent years to control diseases., (NECRT), Ans. The science and practice of protecting and improving, , the health of a community, as by preventive medicine,, health education, control of communicable diseases,, application of sanitary measures and monitoring of, environmental hazards, is called public health. In the, recent years, government has built up a vast health, infrastructure equipped with trained manpower at, different levels., The following measures have been initiated by the, state in recent years to promote public health, (i) Establishing health care institutions., (ii) Expanding the health facilities., (iii) Expanding the facilities for medical education., (iv) Promoting preventive medicine., All these measures have helped to control diseases like, smallpox, malaria, TB, etc., , 4. How can we increase the effectiveness of, healthcare programmes?, , (NCERT), , Ans. We can increase the effectiveness of healthcare, , programmes in the following manner, (i) The wide gap between rural and urban areas, poor, and rich in utilising health care facilities must be, addressed through more investment in health, facilities in rural and backward areas by the, government as private investment is not, forthcoming in these areas., (ii) Women’s health across the country should be, taken into greater focus as a healthy mother gives, birth to a healthy off spring and health status of, population can be improved., (iii) Regulated private sector health services, NGOs, and community participation can improve the, , effectiveness of health care facilities and play an, important role in spreading health awareness., (iv) Indian system of medicine including ayurveda and, naturopathy should be explored and used to support, public health as they are based on natural healing and, are of preventive nature., , 5. Differentiate the six systems of Indian medicine., (NCERT), , Or Explain the six systems of Indian medicine., Ans. The six systems of Indian medicine can be differentiated, , from the points below, (i) Ayurveda Atharvaveda, the last of the four great, bodies of knowledge known as Vedas, contains 114, hymns related to formulations for the treatment of, different diseases., The Ayurvedic practitioners recommend diet and, lifestyle changes alongwith drug therapy. The methods, of Ayurveda such as applying herbs and massage can, simultaneously be used alongwith other systems., (ii) Yoga It is being practised in India from thousands of, years. It has references in Upanishads and Puranas, composed by Aryans in the Vedic period. The main, credit for systematising Yoga goes to Patanjali who, wrote ‘Yoga Sutra’ which is the most important and, basic text on Yoga. Yoga is defined as an art of, righteous living or an integrated system for the benefit, of the body, mind and inner spirit., (iii) Unani This also means ‘Greek medicine’, and is a form, of traditional medicine widely practised in South Asia., Unani medicine is based on the concept of the four, humours, Phlegm, Blood, Yellow bile and Black bile., Unani medicine first arrived in India with, establishment of Delhi Sultanate (1206–1527 CE) and, muslim rule over North India and subsequently, flourished under Mughal empire., (iv) Siddha It comes from the word Siddhi which means, an object to attain perfection or heaven. Siddhi is, attained through meditation which cures mental, illness and promotes mental, emotional and physical, well-being., (v) Naturopathy It heals with the power of nature as it, assumes that all healing powers are within our body. It, uses the inbuilt immune system of the human body for, curing. Naturopathy regards that we fall ill only when, we go against nature. An ailing body can purify and, recover itself with thorough rest and fasting or having, natural diet which helps in healing., (vi) Homeopathy It consists of two words ‘homeo’, meaning similar and ‘pathos’ meaning suffering. In, this system, a drug and a disease that produces similar, symptoms are believed to be having a neutralising, effect on each other. Thus, the homeopathic treatment, is based on symptoms the body is showing and, medication is given accordingly. It is popular among the, people due to its remarkable healing capacity. Also, its, remedies are free from side effects.
Page 102 :
Chapter Test, Multiple Choice Questions, , 1., , Why are education, health and housing called social infrastructure?, (a), (b), (c), (d), , 2., , Core elements of social change, Helps in development, Necessary for growth, Help in increasing per capita income, , Which programme was launched in 2006 with objective of correcting regional imbalances in provision of health care?, (a) Pradhan Mantri Swasthya Suraksha Yojana, (b) National Rural Health Mission, (c) Janani Suraksha Yojana, (d) Integrated Disease Surveillance, , 3., , Since independence, the eradication of smallpox, guinea worms were possible with the help of, (a), (b), (c), (d), , 4., , increase in circulation of money, creation of education system, expansion of health infrastructure, raise in income level, , In which city, All India Institute of Medical Science has been set up?, (a) Chennai, (c) Karnataka, , 5., , (b) Pune, (d) New Delhi, , The hospitals which have better facilities such as surgery, X-ray, ECG are called ……… ., (a), (b), (c), (d), , Primary health care provider, Secondary health care institutions, Community health care centres, Sub-centres, , Short Answer (SA) Type Questions, , 1., 2., 3., 4., , Why is it important to have strong infrastructure?, Explain tertiary health care as a component of public health system in India., How has women’s health become a matter of great concern?, Write a short note on ‘Private Sector Health Infrastructure in India’., , Long Answer (LA) Type Questions, , 1., 2., , What are the main characteristics of health of the people of our country?, Discuss the main drawbacks of our healthcare system., , Answers, Multiple Choice Questions, 1. (a), , 2. (a), , 3. (c), , 4. (d), , 5. (b), , For Detailed Solutions, Scan the code
Page 103 :
CBSE Term-II Economics XII, , 92, , CHAPTER 03, , Environment and, Sustainable, Development, In this Chapter..., Environment, State of India’s Environment, Sustainable Development, , Environment, It is defined as the total planetary inheritance and the totality of, all natural resources. It includes all the biotic (e.g, birds,, animals, plants, forests, etc.) and abiotic (e.g. water, sun, land,, mountains, etc) factors that influence each other., Functions of Environment, Environment performs four vital functions, which are as follows, 1. Supply Resources for Production Resources include both, renewable and non-renewable sources of energy. Resources, which can be used without any fear of getting depleted are, renewable sources of energy. e.g. Trees, fishes, etc., Non-renewable sources are those which are getting depleted, or exhausted. e.g. Fossil fuel, etc. Environment supplies all, these resources, so that the production process can be, carried out in the society., 2. Assimilates Waste Production and consumption activity, generates wastes. Environmental components help in their, degradation, thereby preventing their accumulation., 3. Sustains Life Sun, water, soil and air are part of the, environment. Life without them is impossible. Therefore,, environment helps in the existence of life on Earth., 4. Enhances Quality of Life Environmental surroundings, include forests, rivers, waterfalls, oceans, mountains, etc., Man finds peace and tranquility in these surroundings,, enhancing his quality of life., , Environmental Crisis, The environment performs its functions without any, interruption as long as the demand of these functions is, within its carrying capacity., This means that if the rate of extraction of resources will be, above the rate of their regeneration, the environment will, not be able to sustain life and this results an environmental, crisis., Resources are becoming extinct and wastes are generated, beyond the absorptive capacity of the environment. All this, has led to the environmental crisis. It refers to ecological, crisis that occurs when the environment of a species or a, population changes and destablises its survival., Consequences of Environmental Crisis, Development has polluted and dried up rivers and other, aquifiers making water an economic good., Intensive and extensive excavation of both renewable and, non-renewable resources has exhausted some of the vital, resources, compelling to spend a huge amount of money, on technology and research to explore new resources., Decline in air and water quality have resulted, in increased number of respiratory and water borne, diseases, with the consequence that expenditure of health, care is also rising., The above consequences of environmental crisis have, increased the opportunity costs of negative environmental, impacts., l, , l, , l
Page 104 :
93, , CBSE Term-II Economics XII, Global Environmental Issues, The environmental issues which affect the whole world are, called global environmental issues, such as global warming and, ozone depletion. These issues are discussed below, 1. Global Warming The gradual increase in the average, temperature of Earth’s lower atmosphere is called global, warming. It occurs due to greenhouse gases, (carbon, dioxide, methane and other gases which have the capacity, to absorb heat) through burning of fossil fuels (coal and, petroleum) and deforestation (increases the carbon dioxide, level in atmosphere). Much of the recent observed and, projected global warming is human induced., 2. Ozone Depletion It refers to the phenomenon of reduction, in the amount of ozone layer in the stratosphere. It is caused, by high levels of chlorine and bromine compounds in the, stratosphere. Origin of these compounds are Chloroflurocarbons (CFCs), used as cooling substances in air conditioners, and refrigerators or as aerosol propellants and bromoflurocarbons (halons) used in fire extinguishers., , Some of the priority issues are discussed below, 1. Land Degradation in India Land in India suffers from, varying degrees and types of degradation mainly due to, excessive use and inappropriate management practices., The factors responsible for land degradation in India are, Loss of vegetation occurring due to deforestation., Unsustainable fuel, wood and fodder extraction., Shifting cultivation and reduction of forest lands., Forest fires and overgrazing., Non-adoption of adequate soil conservation, measures., Improper crop rotation., Indiscriminate use of agro chemicals such as, fertilisers and pesticides., Improper planning and management of irrigation, system., Extraction of ground water in excess of the, regenerative capacity., Poverty of the agriculture-dependent people., Open access to resources., l, , l, , l, , l, , l, , l, , l, , l, , l, , l, , l, , State of India’s Environment, India is rich in natural resources. It is clear from the following, points, India has rich quality of soil, hundreds of rivers and, tributaries, lush green forests, plenty of mineral deposits, beneath the land surface, vast stretch of the Indian ocean,, range of mountains, etc., The black soil of the Deccan Plateau is particularly suitable, for cultivation of cotton. It has lead to concentration of textile, industries in this region., The Indo Gangetic plains spread from Arabian Sea to the, Bay of Bengal are one of the most fertile, intensively, cultivated and densely populated regions in the world., India’s forests though unevenly distributed, provide green, cover for majority of its population and natural cover for its, wildlife., Large deposits of iron-ore, coal and natural gas are found in, the country. India alone accounts for nearly 20% of the, world’s total iron-ore reserves., Bauxite, copper, chromate, diamonds, gold, lead, lignite,, manganese, zinc, uranium, etc are also available in different, parts of the country., l, , l, , l, , l, , l, , l, , Threat to India’s Environment, The developmental activities in India have resulted in pressure, on its finite natural resources, besides creating impacts on, human health and well-being. Air pollution, water, contamination, soil erosion, deforestation and wildlife, extinction are some of the most pressing environmental issues, of India., , 2. Loss of Biodiversity Biodiversity is the variety of all life, forms including animals and plants that can be found, either in just one location or on the whole planet. Loss, of biodiversity means that some of the species of, animals and plants will be lost as a consequence of, environmental degradation., Deforestation at such a large scale has the following, consequences, It leads to soil erosion. According to an estimate,, quantity of nutrients lost due to soil erosion each, year ranges from 5.8 to 8.4 million tonnes., The forests sustain all types of life forms. Destruction, of these forests means losing the various life forms, sustained by these forests., 3. Air Pollution Pollution from vehicles and industries are, the major sources of air pollution. These are as follow, Vehicle emissions are of particular concern since, these are ground level sources and thus, have the, maximum impact on the general pollution., India is one of the ten most industrialised nations of, the world. This status has brought with it unwanted, and unanticipated consequences like unplanned, urbanisation, pollution and the risk of accidents., 4. Management of Fresh Water Water is an equally, important element of life and its pollution is equally, serious. Water becomes polluted when chemicals and, other waste materials are dumped into it. Polluted, water is the principal cause of diseases like diarrhoea, and hepatitis. Thus, the management of fresh water is, essential to sustain life., l, , l, , l, , l
Page 105 :
CBSE Term-II Economics XII, , 94, , 5. Solar Power through Photovoltaic Cells India is naturally, endowed with a large quantity of solar energy in the form, of sunlight. Now, with the help of photovoltaic cells, solar, energy can be converted into electricity., 6. Bio Composting The use of chemical fertilisers has, adversely affected the waterbodies, ground water system,, etc. So, farmers should be encouraged to use organic, fertilisers for production. Cattles should be maintained, because their waste is very useful in the form of fertiliser., Earthworm can also be used to convert organic matter, into compost faster than the normal composting process., 7. Mini-Hydel Plants Mountainous regions have streams, everywhere. Most of such streams are perennial., Mini-hydel plants use the energy of such streams to move, small turbines which generate electricity., 8. Traditional Knowledge and Practices Traditionally,, Indian people have been close to their environment. If we, look back at our agricultural system, healthcare system,, housing, transport, etc we find that all practices have been, environment friendly., But in recent years, we have been moving away from, these practices. This has caused large scale damage to our, environment. For sustainable development we should, revert back to these practices., 9. Biopest Control With the advent of green revolution, the, country entered into the use of chemical pesticides to, produce more which had adverse impacts on soil, water, bodies, milk, meat and fishes. To meet this challenge,, better methods of pest control should be used like, pesticides based on plants like neem etc., , 5. Management of Solid Waste It is very essential that, solid waste should be treated chemically. Efforts should, be made for effective management of non-biodegradable, waste. Also biodegradable waste should be converted, into compost., , Sustainable Development, According to the United Nations Conference on, Environment and Development (UNCED), sustainable, development can be defined as “development strategy that, meets the need of present generation without compromising, the ability of future generation to meet their own needs.”, Features of Sustainable Development, Sustained rise in real per capita income and economic, welfare., Rational use of natural resources., No reduction in the ability of future generations to meet, their own needs., Check on pollution., l, , l, , l, , l, , Strategies for Sustainable Development, These are as follows, 1. Use of Non-conventional Sources of Energy India, heavily depends on thermal and hydro power plants to, meet its power needs. Both of these have adverse, environmental impacts. Thermal power plants emit large, quantities of carbon dioxide, which is a greenhouse gas., If it is not used properly, it may cause land and water, pollution. Therefore, the use of non-conventional, sources such as solar, wind and nuclear energy should be, encouraged to achieve the objective of sustainable, development., 2. LPG, Gobar Gas in Rural Areas Rural households in, India generally use wood, dungcake (upla) or other, biomass as fuel. This practice has several adverse, implications like deforestation, reduction in green cover, and air pollution. To rectify the situation, subsidised, LPG should be provided. It does not create any, household pollution and also wastage is minimised., Besides it, gobar gas plants should be encouraged, through easy loans and subsidy., 3. CNG in Urban Areas In Delhi, the use of Compressed, Natural Gas (CNG) as fuel in public transport system has, significantly lowered air pollution and the air has, become cleaner in the last few years. Steps should be, taken to popularise this fuel in other parts of the country., 4. Wind Power In areas where speed of wind is usually, high, wind mills can provide electricity without any, adverse effect on the environment., , Measures to Achieve Sustainable Development, According to Herman Daly, leading environmental economist,, the following measures should be undertaken to achieve, sustainable development, Limiting the human population to a level within the carrying, capacity of the environment. Daly compared the carrying, capacity to ‘plimsoll line’ of the ship, which is the load limit, mark in a ship. According to him, if the population exceeds, the ‘plimsoll line’ sustainable development cannot be, achieved., Technological progress should be input efficient and not, input consuming., Renewable resources should be extracted on a sustainable, basis, i.e., rate of extraction should not exceed rate of, regeneration., For non-renewable resources, rate of depletion should not, exceed the rate of creation of renewable substitutes., Inefficiencies arising from pollution should be corrected., l, , l, , l, , l, , l
Page 106 :
95, , CBSE Term-II Economics XII, , Chapter, Practice, PART 1, Objective Questions, l, , Multiple Choice Questions, 1. Which of the following conditions is/are necessary for, sustainable development?, , (a) Conservation of natural resources, (b) Eco-friendly environment, (c) Use of renewable resources on sustainable basis, (d) All of the above, Ans. (d) All of the above, , 2. Out of the following, which is not the function of, environment?, (a) It supplies resources, (b) It assimilates waste, (c) It sustains life by providing non-genetic and, non-biodiversity, (d) It provides aesthetic services like scenery, Ans. (c) The environment includes the sun, soil, water, and air,, which are essential for human life. It sustains life by, providing genetic and biodiversity., , 3. The environment performs four vital functions and, the environment is able to perform these functions, without any interruptions as long as the demand on, these functions is within its carrying capacity. In the, statement ‘carrying capacity’ implies to, (i) the resource extraction is not above the rate of, regeneration., (ii) wastes generated are beyond the absorptive capacity of, the environment., (iii) the resource extraction is not below the rate of, regeneration., (iv) the resource and the waste generated are within the, assimilating capacity of the environment., , Alternatives, (a) (i), (ii) and (iv), (b) Both (ii) and (iv), (c) Both (i) and (iv), (d) All of the above, Ans. (c) Both (i) and (iv), , 4. Out of the following, what is/are the correct, reason(s) of high opportunity cost of negative, environmental impact?, (a) Spending amount on technology and research to, explore alternative resource, (b) Health cost of degraded environmental quality, (c) Global warming, (d) All of the above, Ans. (d) All of the above, , 5. What do we mean when we say “Think Globally, Act, Locally” in relation to environmental problems?, (a) Global environmental problems are essential issues, (b) Environmental problems have to be thought at a, global level, (c) Extensive research and thinking has been carried, out by global level, (d) Think about global impact of local activities, Ans. (d) Think about global impact of local activities, , 6. Match the following., Column I, , Column II, , A. Global warming, , (i), , Caused by rising population, consumption, , B. Ozone depletion, , (ii) Caused by high level of, chlorine and bromine, , C. Environmental crisis (iii) Gradual increase in average, temperature of earth, , Codes, A B, C, (a) (i) (ii) (iii), (c) (ii) (i) (iii), , A B C, (b) (iii) (ii) (i), (d) (i) (iii) (ii), , Ans. (b) (iii) (ii) (i), , 7. What are the consequences of environmental crisis?, (a) Polluted and dried up rivers and other aquifers, (b) Extinction of vital resources, (c) Decline in air and water quality, (d) All of the above, Ans. (d) All of the above
Page 107 :
CBSE Term-II Economics XII, , 96, 8. Global warming is mainly caused by ……… ., , 14. Which household waste has an excellent recycling, potential?, , (a) burning of coal and petroleum products, (b) deforestation, (c) release of methane gas from animal waste, (d) All of the above, Ans. (d) All of the above, , (a) Vegetable scraps, (c) Plastic, Ans. (a) Vegetable scraps, , 15. Use of non-conventional sources of energy is, , 9. Mercury and lead are toxic elements that cause …… ., (a) land contamination, (c) water pollution, Ans. (a) land contamination, , (b) air pollution, (d) noise pollution, , 10. Which of the following is not used as a strategy for, sustainable development?, , (b) Metal, (d) Rubber, , (CBSE 2020), , (a) Use of bio-gas, (b) Use of solar power, (c) Use of thermal power, (d) Use of hydel power, Ans. (c) For thermal power, water is heated with the help of coal., As coal is non-renewable source of energy, so using it can’t, be beneficial in sustainable development., , (i) Crude oil, (ii) Solar, (iii) Wind, (iv) Wood, (v) Coal, (vi) Nuclear, Alternatives, (a) (ii), (iv), (vi) and (v), (b) (ii), (iii), (iv), (v) and (vi), (c) (i), (ii), (iii), (iv), (v) and (vi), (d) (ii), (iii) and (vi), Ans. (d) (ii), (iii) and (vi), , 16. Environment has many resources for us. A, resource that can be totally replaced or is always, available naturally, or that is practically, inexhaustible is known as ……… ., , 11. Use of which of the following has resulted in a, sufficient reduction in Delhi’s pollution?, (a) LPG at homes, (b) Solar cell for electricity, (c) Thermal power plant, (d) CNG in public transport, Ans. (d) CNG in public transport, , (a) Conventional resource, (b) Renewable resource, (c) Non-renewable resource, (d) Non-conventional resource, Ans. (b) Renewable resource, , 12. Which of the following is not a part of sustainable, , 17. After mining, the huge holes left behind are used, , development goal target to be achieved by 2030?, (a) Providing free primary and secondary schooling to, boys and girls, (b) Universal access to a quality higher education, (c) Equal access to affordable vocational training, (d) Free higher education to all, Ans. (d) Free higher education to all, , strategy for sustainable development. Out of the, following, which are the non-conventional sources, of energy?, , all, , 13. With reference to solar water pumps, consider the, following statements., (i) Solar power can be used for running surface pumps and, not for submersible pumps., (ii) Solar power can be used for running centrifugal pumps, and not the one with piston., Which of the statements given above is/are correct?, (a) Only (i), (b) Only (ii), (c) Both (i) and (ii), (d) Neither (i) nor (ii), Ans. (d) Pumps can be classified as submersible and surface, pumps based on their placement. Solar power can be used, for both running surface pumps and for submersible, pumps. The pumping action is cyclic and can be driven by, piston, screw, gear, roller, diaphragm and vanes., , for ……… ., (a) waste water storage, (c) waste disposal, Ans. (c) waste disposal, , (b) waste and water storage, (d) waste storage, , 18. What is the other word for landscaping?, (a) Reduction, (c) Removing topsoil, Ans. (b) Restoration, , (b) Restoration, (d) Restore, , 19. What does a firm seek for when the price of the, mineral remain high?, (a) New countries, (c) New miners, Ans. (d) New deposits, , (b) Remains the same, (d) New deposits, , 20. Which of the following options is/are correct, when we only accomplish two out of three pillars, of sustainable development?, (a) Economic+ Environmental Sustainability = Viable, (b) Social + Environmental Sustainability = Bearable, (c) Social + Economic Sustainability = Equitable, (d) All of the above, Ans. (d) All of the above
Page 108 :
97, , CBSE Term-II Economics XII, , l, , environmental sound policy do not harm the, environment or deplete the natural resources., , Assertion-Reasoning MCQs, Directions (Q. Nos. 1 to 7) There are two statements marked, as Assertion (A) and Reason (R). Read the statements and, choose the appropriate option from options given below, (a) Both Assertion (A) and Reason (R) are true and, Reason (R) is the correct explanation of Assertion (A)., (b) Both Assertion (A) and Reason (R) are true, but Reason, (R) is not the correct explanation of Assertion (A), (c) Assertion (A) is true, but Reason (R) is false, (d) Assertion (A) is false, but Reason (R) is true, , 6. Assertion (A) Non-renewable resources are, abundant in nature., Reason (R) Non-renewable resources will get, exhausted after several years of usage., Ans. (d) Non- renewable resources are fixed in amount and, , will get exhausted after several years of usage., , 7. Assertion (A) All resources are not exhaustible., Reasoning (R) Renewable resources can become, non-renewable., , 1. Assertion (A) Presently, global atmosphere is, warming up., Reason (R) The depletion of stratospheric ozone, layer has resulted in increase in ultraviolet radiations, reaching the earth., Ans. (b) Global warming is the overheating of the earth due to, , the increased concentration of greenhouse gases., Greenhouse gases generally trap the radiation of the earth, which leads to increase in the temperature of the earth and, global warming., , 2. Assertion (A) The crude oil reserves are going down, for the entire world and the countries need to find, substitute fuel for crude oil., Reason (R) A country that is dependent on import for, crude oil will demand more crude oil in future., Ans. (b) This is because, if the crude oil reserves gets depleted, , then it will be necessary to find an alternative sources and, the countries depending on other countries for crude oil, will demand more., , 3. Assertion (A) Sustainable development is essential, for economic growth of the country., Reason (R) Sustainable development ensures that, environment friendly measures are adopted for, carrying out production process., Ans. (a) Both Assertion (A) and Reason (R) are true and Reason, , (R) is the correct explanation of Assertion (A), , 4. Assertion (A) Sustainable development must be, adopted to save environment from degradation., Reason (R) It is a matter of discussion among, different countries of the world., Ans. (c) Assertion (A) is true, but Reason (R) is false, , 5. Assertion (A) Sustainable development is critical to, well-being of human society., Reason (R) Environmentally sound policies do not, harm the environment or deplete the natural, resources., Ans. (b) A sustainable society focuses on the current and future, , well-being of its citizen and the environment. Presently, our, national policies are dedicated to producing the highest, possible rate of economic growth and consumption while, , Ans. (b) Depending upon the abundance and availability,, , natural resources are classified into two categories i.e,, exhaustible and inexhaustible. Few examples of, inexhaustible resources are air, clay and fungi., l, , Case Based MCQs, 1. Direction Read the following text and answer the, question no. (i) to (vi) on the basis of the same., In recent years, awareness of the harmful effect of, chemical-based fertilizers and pesticides on our, health is on a rise. Conventional agriculture relies, heavily on chemical fertilizers and toxic pesticides, etc., which enter the food supply, penetrate the, water sources, harm the livestock, deplete the soil, and devastate natural eco-systems., Efforts in evolving technologies which are, eco-friendly, are essential for sustainable, development and one such technology which is, eco-friendly is organic farming., In short, organic agriculture is a whole system of, farming that restores, maintains and enhances the, ecological balance. There is an increasing demand, for organically grown food to enhance food safety, throughout the world., (i) In context of sustainable development, which of, the following is/are strategies to achieve it?, , (a) Use of sustained methods of farming, (b) Use of bio-pest, (c) Use of natural manure, (d) All of the above, Ans. (d) All of the above, , (ii) Green revolution was a major reason of rise in, productivity of farming. What are the advantages, of conventional farming methods?, (a) Higher output, (b) Cost effective, (c) Wider range, (d) All of the above, Ans. (d) All of the above
Page 109 :
CBSE Term-II Economics XII, , 98, (iii) ………… is more popular non-farm activity after, farming., (a) Horticulture, (c) Plantation, Ans. (b) Pisciculture, , (b) Pisciculture, (d) Animal husbandry, , (iv) ……… helps in maintaining ecological balance., (a) Organic food, (c) Dairy, Ans. (a) Organic food, , (b) Conventional food, (d) Protein, , (v) Assertion (A) A country rich in natural resources, has mainly relied on oil extraction for revenue, generation. However, scientists predict that the, country may become poor in the future if other, means of generating income are not devised., Reason (R) Oil is a non-renewable resource, and it, is likely to get exhausted if not used judiciously., Alternatives, (a) Both Assertion (A) and Reason (R) are true and Reason (R), is the correct explanation of Assertion (A)., (b) Both Assertion (A) and Reason (R) are true, but Reason, (R) is not the correct explanation of Assertion (A)., (c) Assertion (A) is false, but Reason (R) is true, (d) Both the statements are false, Ans. (a) Both Assertion (A) and Reason (R) are true and Reason, , (R) is the correct explanation of Assertion (A)., , (vi) Which of the following statements is/are correct?, (i) Sustainable development is synonymous with the, conservation of the environment., (ii) The environment is able to perform its functions, without any interruption as long as the resource, extraction increases the rate of regeneration., , Alternatives, (a) Both are true, (b) Both are false, (c) (i) is true, but (ii) is false, (d) (i) is false, but (ii) is true, Ans. (a) The environment is able to perform its functions, without any interruption as long as the resource, extraction does not exceed the rate of regeneration., , 2. Direction Read the following text and answer the, question no. (i) to (vi) on the basis of the same., Sustainable development is synonymous in the, minds of many with the colour green and for good, reason. Twenty years ago, at the first Earth Summit, in Rio de Janeiro, leaders set out what today is, conventional wisdom human progress—both social, and economic—cannot be divorced from, environmental protection. Unless both are, advanced together, both will flounder or fail., Sustainable development is as much about health,, education and jobs, as it is about ecosystems. It is, , about ever widening inclusion and movement away, from decisions that erode democratic space and do, not address social inequality, intolerance and, violence. Sustainable development is about change, that transforms impoverished peoples, communities, and countries into informed, educated, healthy and, productive societies. It is about wealth creation that, generates equality and opportunity; it is about, consumption and production patterns that respect, planetary boundaries; it is about increasing, tolerance and respect for human rights., Building on the human development legacy that, originated with Amartya Sen and Mahbub-Ul-Haq, and was captured by the first human development, report in 1990, UNDP has long promoted, alternative approaches to measuring human, progress, including with the human development, index. Today, we are building on this legacy by, exploring how to adjust the index to reflect, environmental sustainability, so that governments, and citizens might better track real progress, towards truly sustainable development. This must, be our collective objective., Source UNDP Report, June, 2012, , (i) Which of the following are ways to attain the goal, of sustainable development?, (a) Use of cleaner fuels, (b) Use of traditional knowledge and practices, (c) Spreading awareness, (d) All of the above, Ans. (d) All of the above, , (ii) As per United Nations, following is/are the broader, issue(s) of human development?, (a) Education, (b) Public health, (c) Standard of living, (d) All of the above, Ans. (d) All of the above, , (iii) The word ‘Sustainable Development’ came in, existence in ……… ., (a) 1980, (c) 1987, Ans. (a) 1980, , (b) 1982, (d) 1990, , (iv) Sustainable development and economic growth, ………… proportional., (a) directly, (b) increasing, (c) indirectly, (d) decreasing, Ans. (a) directly
Page 110 :
99, , CBSE Term-II Economics XII, (v) Assertion (A) Sustainable development is about, changes that transform impoverished people,, communities, and countries into informed, educated,, healthy and productive societies., Reason (R) Sustainable development advocates about, wealth creation that generates socio-economic, equality and opportunity., Alternatives, (a) Both Assertion (A) and Reason (R) are true and Reason (R), is the correct explanation of Assertion (A)., (b) Both Assertion (A) and Reason (R) are true, but Reason (R), is not the correct explanation of Assertion (A)., (c) Assertion (A) is false, but Reason (R) is true, (d) Both the statements are false, Ans. (a) Both Assertion (A) and Reason (R) are true and Reason, , (R) is the correct explanation of Assertion (A)., , (vi) The Sustainable Development Goals (SDGs), recognise that all countries must stimulate action in, the following key areas, (a) people, planet, prosperity, peace and partnership., (b) people, planet, prosperity, plants and planning., (c) people, planet, prosperity, plants and partnership., (d) people, planet, prosperity, peace and planning., Ans. (a) people, planet, prosperity, peace and partnership, , 3. Direction Read the following text and answer the, question no. (i) to (vi) on the basis of the same., Along with being a basic human need, water is also a, basic constituent for the survival of eco-systems of, which people and their cultures are important, components. The water resources distribution in, India, predominantly an agrarian economy, is highly, asymmetric and has been accompanied by severe, decline in per capita water availability during the past, 50 years, with agriculture being the maximum water, user, leading to over-exploitation of ground water and, steadily depleting water tables along with a heavy, energy bill., Gujarat State falls in a water stressed zone of the, country and is also the victim of intra-state, asymmetric water availability leading to an unwanted, socio-economic disparity, with the following results, A poor literacy rate in water-deficit districts;, concentration of industry and housing in regions with, better water resources endowment; and demographic, change, e.g. the shift of the prime workforce from, drought-prone districts to water-surplus districts., This in turn denies the right to life, development,, health, food, education and work for these migrant, communities., , To ensure a balanced development when there is, less than one acre per capita of cultivable, landholding and over 14,000 villages out of 18,563, are suffering from water scarcity, there is no other, alternative but to transfer water from surplus to, scarce areas of the state., (i) Which of the following is/are not an objective(s) of, sustainable development?, (a) Control over growth rate of population, (b) Maintain ecological balance, (c) Maintain a dynamic balance of water resources by, reducing water consumption, (d) To bring about a gradual and sometimes,, catastrophic transformation of environment, Ans. (d) To bring about a gradual and sometimes,, catastrophic transformation of environment, , (ii) Which of the following is not included in the, strategies of sustainable development?, (a) Maintain carrying capacity of environment, (b) Maintain inter and intra-generation equity, (c) Bring gender disparity and diversity, (d) None of the above, Ans. (d) None of the above, , (iii) The ……… commission emphasises on protecting, the future generation., (a) Brundtland, (b) Mundell, (c) Indian, (d) French, Ans. (a) Brundtland, , (iv) Water is an important resource for all biotic, components. Over use of water has posed a, serious threat on the future generations. Which of, the following measures can be taken to improve, availability of water across generations?, (a) Encouraging rain water harvesting, (b) Check on overuse of ground water level, (c) Spreading awareness about water conservation, (d) All of the above, Ans. (d) All of the above, , (v) Assertion (A) Environmentalists have used the, term sustainability in an attempt to classify the, defined balance between economic growth and, environment conservation., Reason (R) A developmental path is sustainable if, the stock of overall capital assets remains constant, or increases over time.
Page 111 :
CBSE Term-II Economics XII, , 100, Alternatives, (a) Both Assertion (A) and Reason (R) are true and Reason (R), is the correct explanation of Assertion (A)., (b) Both Assertion (A) and Reason (R) are true, but Reason (R), is not the correct explanation of Assertion (A)., (c) Assertion (A) is false, but Reason (R) is true, (d) Both the statements are false, Ans. (a) Both Assertion (A) and Reason (R) are true and Reason, , (R) is the correct explanation of Assertion (A)., , (vi) Match the following, Column I, , Column II, , A. Condition of sustainable, development, , (i) Industrial machines, , B. Reason for noise, pollution, , (ii) Long term increase in, real per capital income, , C. Cause of environmental, degradation, , (iii) Reduction in level of, pollution., , D. Non-renewable, resources, , (iv) Rapid industrialisation, , E. Economic growth, , (v) Exhausted after use, , Codes, A B, (a) (ii) (iv), (b) (i) (ii), (c) (iii) (i), (d) (v) (iv), Ans. (c) (iii) (i), , 3. Explain how the opportunity costs of negative, environmental impacts are high?, , (NCERT), , Ans. Opportunity cost of negative environmental impacts are, , high in terms of the following, (i) The past development has polluted and dried up, rivers and other acquifers making water an, economic good., (ii) Due to excessive utilisation of natural resources’,, we are compelled to spend huge amount of money, on technology and research to discover new, resources., (iii) Health cost of degraded environment is rising., (iv) Global environmental issues such as global, warming and ozone depletion have also, contributed to increased financial commitments for, the government., , 4. Is environmental crisis a recent phenomenon? If, C, (i), (iii), (iv), (iii), (iv), , D, (v), (iv), (v), (ii), (v), , so, why?, , E, (iii), (v), (ii), (i), (ii), , early days, when civilisation just began, before the, phenomenal increase in population and growth of, industrialisation, the demand for environmental, resources was within the carrying capacity of the, environment and so the pollution was also within the, absorptive capacity of the environment. Therefore,, environmental problems did not arise., But with the advent of the industrialisation and out, break of the population, environmental problems arisen, and the resources for both production and consumption, proved to be beyond the rate of regeneration of the, resources and the absorptive capacity of the, environment., , Short Answer (SA) Type Questions, 1., , (i) What is meant by environment?, (ii) What happens when the rate of resource extraction, exceeds that of their regeneration?, (NCERT), Ans. (i) Environment is defined as the total planetary, inheritance or the totality of all resources. It includes, all biotic (birds, animals, plants, forest, etc.) and a, abiotic (water, sun, land, mountains, etc.) factors that, influence or depend on each other., (ii) When the rate of resource extraction exceeds that of, regeneration, then environment fails to perform its, important functions and it leads to the situation of, environmental crisis., , 2. What are the functions of the environment?, , (NCERT), , Ans. The environment performs four important functions, , (i) It supplies resources, both renewable and, non-renewable resources., , (NCERT), , Ans. Yes, environmental crisis is a recent phenomenon. In, , PART 2, Subjective Questions, l, , (ii) It absorbs waste., (iii) It sustains life by providing genetic and, biodiversity., (iv) It also provides aesthetic services like scenery, etc., , 5. Write a brief note on ozone depletion., Ans. Ozone depletion means the thinning of the ozone layer, , present in the upper atmosphere which is harmful to, the nature and atmosphere. Ozone layer depletion is, one of the major problem for all the living beings, including flora and fauna on this earth. These ozone, depletion substances float and then reach the, stratosphere., Therefore, the formation of chlorine and bromine takes, place and these chemicals causes the depletion of the, ozone layer at a very high speed. They are capable of, breaking down the molecules of the ozone layer. One, chlorine molecule has the capacity to breakdown, thousands of molecules present in ozone layer., , 6. “India has abundant natural resources”., Substantiate the statement., , (NCERT), , Ans. India has plenty of natural resources at its disposal., , This becomes clear from the following facts
Page 112 :
101, , CBSE Term-II Economics XII, (i) India has abundant natural resources in terms of rich, quality of soil, hundred of rivers and tributaries, lost, green forests, plenty of mineral deposits beneath the, land surface, vast stretch of the Indian ocean, ranges of, mountains, etc., (ii) The black soil of the Deccan plateau is particularly, suitable for cultivation of cotton, leading to, concentration of textile industries in this region., (iii) The Indo-Gangetic plains spread from the Arabian sea, to the Bay of Bengal are one of the most fertile, intensively cultivated and densely populated regions, in the world., (iv) India alone accounts for nearly 20% of the world’s total, iron-ore reserve. Bauxite, copper, chromate, diamonds,, gold, lead, lignite, manganese, zinc, uranium, etc. are, also available in different parts of the country., However, the developmental activities in India have, resulted in pressure on its finite natural resources, besides creating impacts on human health and well, being., , 7. (i) State any four pressing environmental concerns of, India., (ii) Correction for environment damages involves, opportunity costs. Explain., (NCERT), Ans., , (i) Four pressing environmental concerns of India are, (a) Land degradation and solid waste management, (b) Bio-diversity loss, (c) Air pollution with special reference to vehicular, pollution in urban cities, (d) Management of fresh water., (ii) Correction for environmental damages involves, opportunity costs as the industrial development in past, has polluted and dried up rivers and other aquifers, making water an economic good., , 8. Write a brief note on global warming., Ans. Global warming refers to the increase in average global, , temperature since the industrial revolution. The average, global temperature has increased by about one degree, celsius (1.8 degrees fahrenheit) since 1880. Global warming, is an ongoing process; scientists expect the average global, temperature to rise an additional 0.3 to 0.7 degrees celsius, (0.54–1.26 degrees fahrenheit) through 2035. Higher, concentrations of these greenhouse gases in the atmosphere, trap more heat on earth, causing an anthropogenic (i.e.,, human-caused) rise in global temperatures. Climate, scientists agree that human activity is the main driver, behind the global warming we are experiencing., , 9. Identify six factors contributing to land degradation, in India., , (NCERT), , Ans. Land degradation means loss of fertility of land. Six of the, , factors responsible for land degradation are, (i) Loss of vegetation occurring due to deforestation., (ii) Unsustainable fuel, wood and fodder extinction., , (iii) Extraction of groundwater in excess of the, recharge capacity., (iv) Non-adoption of adequate soil conservation, measures., (v) Improper crop rotation., (vi) Indiscriminate use of agro chemicals such as, fertilizers and pesticides., , 10. Give two instances of, (i) overuse of environmental resources., (NCERT), (ii) misuse of environmental resources., Ans. Instances of overuse of environmental resources and, misuse of environmental resources are as under, (i) Overuse of environmental resources, (a) Soil degradation due to improper crop rotation, and crop shifting., (b) Drying up of rivers due to overuse of water, from them through dams and reservoirs., (ii) Misuse of environmental resources, (a) Excess use of electricity leads to depletion of, resources like coal and water from which, electricity is generated., (b) Excess use of petrol and diesel in vehicles., , 11. Highlight any two serious adverse environmental, consequences of development in India. India’s, environmental problems pose a dichotomy-they are, poverty induced and at the same time arise due to, affluence in living standards, is it true? (NCERT), Ans. Two serious adverse environmental consequences of, , development in India are, (i) Land degradation, (ii) Air pollution, Yes, it is true, the threat to India’s environment is of two, dimension- threat of poverty induced environmental, degradation and the threat to pollution from affluence., Environmental crisis is poverty induced in the sense, that poor people depend on natural assets for their, survival. They collect forest products and firewood for, their survival. On the other hand, due to affluent, consumption and production standards of the rich, generate huge amount of wastes. For example, rich, people in India own motor vehicles, air conditioners, which heavily contribute to air pollution., , 12. How has population explosion and the advent of, industrial revolution resulted in environmental, crisis?, Ans. With population explosion and with the advent of, , industrial revolution, to meet the growing needs of the, expanding population, the demand for resources for both, production and consumption has gone beyond the rate of, regeneration of the resources and due to this, the, pressure on environment has increased tremendously., The increasing population has led to increased demand, for housing and this has led to widespread deforestation.
Page 113 :
CBSE Term-II Economics XII, , 102, In order to accelerate the process of industrialisation,, natural resources are being used up at a much faster pace., We are now faced with increased demand for, environmental resources and services but their supply is, limited due to overuse and misuse of these resources., Hence, the environmental issues of waste generation and, pollution have become critical today., , 13. Explain the supply demand reversal of environmental, resources., , Future generation have also the right to enjoy the same, quality of life that is enjoyed by the present generation., Hence, future generation should not suffer at the cost of, present generation well-being., , 17. Distinguish between economic development and, sustainable development., Ans., , Economic, Developement, , Sustainable, Developement, , Concept, , It refers to long term, increase in national, income and per capita, income., , It implies an increase in, national income and, welfare of both the, present as well as future, generations., , Environment, Protection, , It does not take into, It emphasises on, account pollution and environmental, environmental, protection., protection., , Exploitation, of Natural, Resources, , In the process, natural In the process, natural, resources are, resources are rationally, exploited., utilised to give benefits, to the future generation., , Basis, , Ans. Before the advent of the industrial revolution, the rate of, , resource extraction was less than the rate of regeneration of, these resources, i.e., demand was less than supply. But with, the expanding population and its growing needs, the, demand for resources for both production and consumption, went beyond the rate of regeneration of the resources. This, has resulted in a reversal of supply-demand relationship for, environmental resources as now there is very high demand, for environmental resources and services, but their supply, is limited and even these limited resources are being, overused and misused., , 14. “Sustainable development is a paradigm shift in, development thinking”. Comment., Ans. Sustainable development implies meeting the basic needs, , of all and extending to all the opportunity to satisfy their, aspirations for a better life, without compromising the, needs of future. The strategies for sustainable development, imply the use of non-conventional sources of energy to, minimise the adverse environmental impacts., Promotion of natural resources, conservation, preserving, regenerative capacity of ecological system and avoiding the, imposition of environmental rules on future generations, would lead to sustainable development., , 15. Why is sustainable development so often associated, with protecting the environment?, Ans. In the 1970s, environmental groups sounded the alarm about, , the boom in economic the environment. Their efforts to, sensitise people to the ecological downside of development, bore fruit and gradually there emerged an environmental, awareness in societies around the world., This explains why for many people, it is still a valid, association. But sustainable development is really a much, broader concept, which puts human beings at the heart of, decision-making. It brings a new way of conceiving and, carrying. In the 1980s, the concept of sustainable, development was associated with protecting the, environment and development in which economic, social, and environmental considerations are all taken into, account., , 16. Explain the relevance of intergenerational equity in, the definition of sustainable development., , (NCERT), , Ans. Sustainable development is the development that meets the, , needs of the present generation without compromising the, ability of the future generation to meet their own needs., This definition of sustainable development is most, appropriate and justified., , l, , Long Answer (LA) Type Questions, 1. “Today development has become a burden on, nature/environment”. Comment., , Ans. The present thinking with regard to relationship, , between nature and development is that there should, be maximum exploitation of natural resources for, development. As a result, people are using nature, beyond its carrying capacity. Our present technology is, creating a number of environmental problems. A, number of non-degradable materials are being, produced in present day through the production, technology. Following are the some important reasons, responsible for the heavy burden on nature, (i) Rise in human population in underdeveloped, countries., (ii) Affluent consumption style in developed countries., (iii) Misuse of production technology in almost all the, countries and poor planning of development., As a result of above, there is a reckless use of resources, creating negative effects on the society., The negative effects of development on nature are:, (i) Pollution, (ii) Degradation of resources, , 2. What is meant by global warming? Give any five, effects of global warming., Ans. The gradual increase in average temperature of Earth’s, , lower temperature is called global warming., Different effects of global warming are described below, (i) During the past century the atmospheric, temperature has risen by 1.10°F (0.60°C).
Page 114 :
103, , CBSE Term-II Economics XII, (ii) Melting of polar ice resulted in increase in sea level, (during the past century, sea level has risen by, several inches) and the risk of coastal flooding has, increased., (iii) Disruption of drinking water supplies, dependent, on snow melts., (iv) Extinction of species., (v) More frequent tropical storms., , 3. How do the following factors contribute to the, environmental crisis in India? What problem do, they pose for the government?, (NCERT), (i), (ii), (iii), (iv), (v), (vi), (vii), (viii), (ix), (x), Ans. (i), , (ii), , (iii), , (iv), , (v), , (vi), , (vii), , Rising population, Air pollution, Water contamination, Affluent consumption standards, Illiteracy, Industrialisation, Urbanisation, Reduction of forest coverage, Poaching, Global warming, Rising Population The high rate of growth of, population adversely affects the environment. It, certainly leads to soil and water pollution., Air Pollution India is one of the ten most, industrialised nations of the world. It has led to, unplanned urbanisation, pollution and the risk of, accidents. The CPCB (Central Pollution Control, Board) has identified 17 categories of industries, which are significant polluters., Water Contamination Many states in India are on, the edge of famine. Whatever water is available, it, is polluted or contaminated. It causes diseases like, diarrheao and hepatitis., Affluent Consumption Standards With affluent, consumption standards, people use more air, conditioners. CFCs are used as cooling agents in, air conditioers which leads to ozone depletion., Illiteracy Illiteracy and ignorance about the use of, non- renewable resources and alternative energy, sources, lead to environmental crisis., Industrialisation With rise in national income or, economic activity, there is rise in industrialisation, and urbanisation. This raises pollution of air, water, and noise. There are accidents, shortage of water,, housing problems, etc. In other words, with rise in, national income, there is ecological degradation, which reduces welfare of the people., Urbanisation Whenever there is large migration of, population from rural to urban areas, it leads to fast, growth of slum areas. There is excess of load on the, existing infrastructural facilities. It causes, environmental degradation and ill-health., , (viii) Reduction of Forest Coverage The per capita forest, land in the country is only 0.08 hectare. There is an, excess felling of about 15 million cubic meter forests, over the permissible limit., Indiscriminate felling of trees has led to destruction of, forest cover., Once forests have been cut down, essential nutrients, are washed out of the soil all-together. This leads to, soil erosion. It leads to disastrous flooding since there, is no soil to soak up the rain., (ix) Poaching Poaching leads to extinction of wildlife., Generally, wild species which are endangered are, poached leading to the danger of them becoming, extinct., (x) Global Warming The long-term results of global, warming are, (a) Melting of polar ice caps with a resulting rise in, the sea level and coastal flooding., (b) Disruption of drinking water supplies as snow, melts., , 4. Outline the steps involved in attaining sustainable, development in India., Ans. Sustainable development refers to the achievement of, , economic development by careful and judicial utilisation of, the natural resources so that the present generation needs, are fulfilled without compromising that of the future, generations’. Aligned with the view of a leading, environmental economist, Herman Daly, India has taken, the following steps to achieve the aim of sustainable, development, (i) Population Control Measure India has promoted, various measures to arrest population explosion. The, various population control measures include spread of, awareness and knowledge of birth control measures, and literacy., (ii) Use of Environment Supportive Fuel As the fuels, such as petrol and diesel emit huge amount of carbon, dioxide that leads to global warming so, the Indian, government has promoted the use of CNG and LPG., These clean, eco-friendly fuels emit lesser smoke., (iii) Use of Solar and Wind Energy India, being a, moderate country, is enriched with sunlight and wind, power. These are two free gifts of nature are nonexhaustible. It solves the problem of economic growth, with due focus on sustainable development., (iv) Recycling and Ban on Plastic Bags The industrial, and household wastes are accumulated on daily basis., There is a need to develop the habit of recycling of, waste products in order to sustain the environment., Household waste can be used as manure for organic, farming. A very recent step taken by the Indian, government is banning the use of plastic bags. This is, a very good step as plastic bags do not get, decomposed easily and leads to pollution while, recycling.
Page 115 :
CBSE Term-II Economics XII, , 104, 5. Briefly discuss any four strategies of sustainable, development., Ans. Four strategies of sustainable development are as follows, , (i) Use of Non-conventional Sources of Energy India is, hugely dependent on thermal and hydro power plants, to meet its power needs. Both of these have adverse, environmental impacts, thermal power plants emit, large quantities of carbon dioxide which is a green, house gas while hydroelectric project inundate forests, and interfere with the natural flow of water in, catchment areas and the river basins., (ii) LPG, Gobar Gas in Rural Areas Households in rural, areas generally use wood, dung cake or other bio-mass, as fuel. This practice has several adverse implications, like deforestation, reduction in green cover, wastage of, cattle dung and air pollution. To rectify the situation,, subsidised LPG is provided and gobar gas plants are, provided. LPG is a clean fuel, which reduces, household pollution to a large extent. Also, energy, wastage is minimised., (iii) Solar Power through Photovoltaic Cells India is, naturally endowed with a large quantity of solar, energy in the form of solar energy through sunlight., We use it in different ways., , For example, we use sunlight to get the clothes, drains dried, to keep our body warm in winter with, the help of photovoltaic cells, etc. Solar energy can, be converted into electricity., These cells use special kind of materials to capture, solar energy and then convert the energy into, electricity., This energy is extremely useful for remote area, and for place where supply of power through grid, or power lines are either not possible or are very, costly., (iv) Mini–hydel Plants In mountainous regions,, stream can be found almost everywhere. A large, percentage of such streams are perennial. Minihydel plants use the energy of such streams to, move small turbines which generate electricity, that can be used locally., Such power plants are more or less environmentfriendly as they do not use pattern in areas where, they are located., They generate enough power to meet local, demands. This shows that they can reduce the, requirement of large scale transmission tower and, cables and avoid transmission loss.
Page 116 :
Chapter Test, Multiple Choice Questions, , 1., , The maximum number of individual that can be supported by a given environment is called, (a) Biotic potential, (c) Carrying capacity, , 2., , (b) Environmental resistance, (d) Population size, , An adulterated element leak into the ground filtration and are carried into a ground water reservoir is known as ……… ., (a) Land contamination, (c) Water pollution, , 3., , (b) Noise pollution, (d) Air pollution, , When the consumption of natural resource is equal to the nature’s ability to replenish, then sustainability is ……… ., (a) not sustainable, (b) steady state economy, (c) environmentally sustainable (d) None of these, , 4., , What is ‘3E’?, (a), (b), (c), (d), , 5., , Energy, Economy and Environment, Reduce, Reuse and Recycle, Energy, Economy and Envision, Ergonomics, Evolution and Economy, , Which of the following relates the three elements of ‘3E’?, (a), (b), (c), (d), , Energy from fossil fuels, Energy from natural gas, Renewable energy sources and technology, Economy, , Short Answer (SA) Type Questions, , 1., 2., 3., , Explain carrying capacity of environment with examples., , 4., 5., , ‘‘Water has become an economic commodity.’’ Justify the statement., , How population growth is the cause of depletion of natural resources?, (i) How does thermal power plant cause pollution?, (ii) How do animals help in bio-pest control?, , Explain the term ‘affluence trap’., , Long Answer (LA) Type Questions, , 1., 2., , How does air pollution contribute to the environmental crisis in India?, Give the benefits and limitations of using solar power., , Answers, Multiple Choice Questions, 1. (c), , 2. (c), , 3. (b), , 4. (a), , 5. (c), , For Detailed Solutions, Scan the code
Page 117 :
CBSE Term-II Economics XII, , 106, , CHAPTER 04, , Comparative Development, Experience of India and, Its Neighbours, , In this Chapter..., l, , India and its Neighbours, , l, , Comparative Study between Countries, , l, , Development Strategies-An Appraisal, , India and its Neighbours, The process of globalisation has made the whole world a global, village. Because of this, there is an increasing eagerness in, various nations to try and understand the developmental, strategies pursued by their neighbouring nations as it helps, them to comprehend their own strengths and weaknesses., Therefore, it is necessary for India to understand, the developmental strategies pursued by two of its most, important neighbours viz. Pakistan and China., , Development Strategies of, India, China and Pakistan, India, China and Pakistan have many similarities in their, development strategies which are as follows, All the three countries had started planning their, development strategies in similar ways. India announced its, Five Year. Plan in 1951-56, while Pakistan announced its, First Five Year Plan in 1956, which is called Medium Term, Plan. China announced its First Five Year Plan in 1953., India and Pakistan adopted similar strategies such as, creating a large public sector and raising public expenditure, on social development., Till the 1980s, all the three countries had similar growth, rates and per capita incomes., l, , l, , l, , l, , Economic reforms took place in all the three countries., Reforms started in India in 1991, in China in 1978 and in, Pakistan in 1988., , Development Strategies of India, Some of the prominent strategies of India are discussed, below, 1. Sound Trade System India initiated economic reforms, in 1991 and introduced globalisation, liberalisation and, privatisation as measure to encourage global and, domestic trade. These reforms formed a basis of a, sound trade system and encouraged economic growth., 2. Reduction in Poverty India has adopted several, poverty alleviation programmes to reduce poverty in, India. This helped in increasing per capita income and, rise in nutrition level of poor., 3. Rural Development Under this strategy, India, adopted various measures for the development of areas, that were lagging behind in the rural economy., 4. Employment Generation Several economic reforms, were initiated to generate employment in the country., Many employment generation programmes were also, initiated with an aim to provide gainful self-employment.
Page 118 :
107, , CBSE Term-II Economics XII, , Development Strategies of China, Certain development strategies of China are discussed below, 1. Great Leap Forward (GLF) Campaign This campaign, initiated in 1958, aimed at industrialising the country on a massive, scale. People were encouraged to set up industries in their backyards. In rural areas, communes were started under which,, people collectively cultivated land. However, this campaign met with many problems, important among them are, A severe drought caused havoc in China, killing about 30 million people., Due to a political conflict, Russia withdrew its professionals from China which were sent to help in the industrialisation, process., l, , l, , 2. Great Proletarian Cultural Revolution (1966-76) In this revolution, students and professionals were sent to work and, learn from the countryside. Unlike GLF campaign, the cultural revolution did not have an explicit economic rationale., 3. 1978 Reforms Since 1978, China began to introduce many reforms in phases. The reforms were initiated in agriculture,, foreign trade and investment sector. In agriculture, lands were divided into small plots which were allocated to individual, households. In later phase, reforms were initiated in industrial sector. All enterprises which were owned and operated by, local collectives in particular, were allowed to produce goods., , Development Strategies of Pakistan, The development strategies of Pakistan are discussed below, 1. Mixed Economy Pakistan follows a mixed economy system where both public and private sectors co-exist., 2. Import Substitution Pakistan adopted a regulatory policy framework in the late 1950s and 1960s for import substitution, industrialisation. The policy combined tariff protection for manufacturing of consumer goods together with direct import, controls on competing foreign goods., 3. Green Revolution This was introduced to increase the productivity and self-sufficiency in food. This increased the output, of foodgrains and changed the agrarian structure dramatically., 4. Nationalisation of Capital Goods Industries In 1970s, nationalisation of capital goods industries took place. Pakistan, shifted its policy orientation in 1970s and 1980s when private sector got encouragement., , Comparative Study Between Countries, We will have a comparative study between India, China and Pakistan with respect to demographic indicators, GDP and HDI., , Demographic Indicators, We shall compare some demographic indicators of India, China and Pakistan, Out of every six persons living in this world, one is an Indian and one is Chinese. The population of Pakistan is very small, and accounts for roughly about one-tenth of China or India. Though China is the largest nation and geographically occupies, the largest area among the three nations, its density is the lowest., One child norm was introduced in China in late 1970s to check the problem of population growth. This measure led to, decline in the sex ratio. Although sex ratio is biased against females in all three countries, in recent times, all three countries, are trying to adopt various measures to improve the situation., The fertility rate is low in China and very high in Pakistan., Urbanisation is high in both Pakistan and China. China and Pakistan have more proportion of urban people than India., Selected Demographic Indicators, 2017-18, l, , l, , l, , l, , Country, , Estimated Population, (in million), , Annual Growth of, Population, , Density, (per sq km), , Sex Ratio, , Fertility, Rate, , Urbanisation, , India, , 1352, , 1.03, , 455, , 924, , 2.2, , 34, , China, , 1393, , 0.46, , 148, , 949, , 1.7, , 59, , 212, , 2.05, , 275, , 943, , 3.6, , 37, , Pakistan, , Source World Development Indicators, www.worldbank.org
Page 119 :
CBSE Term-II Economics XII, , 108, Gross Domestic Product and Sectors, , According to the latest data available, we find, China has the second largest GDP (PPP) of US$ 22.5 trillion whereas, India’s GDP (PPP) is US$ 9.03 trillion and Pakistan’s, GDP (PPP) is US $ 0.94 trillion, roughly about 11% of India’s GDP., In 1980s, Pakistan was ahead of India, China was having double-digit growth and India was at the bottom., In 2015-17, there has been a decline in Pakistan and China’s growth rate, whereas India met with moderate increase in, growth rates., In China, the area suitable for cultivation is relatively small; only about 10% of its total land area. The total cultivable area in, China accounts for 40% of the cultivable area in India., Until the 1980s, more than 80% of the people in China were dependent on farming as their sole source of livelihood. In, 2018-19, with 26% of its workforce engaged in agriculture, its contribution to GDP in China is 7%., Sectoral Share of Employment and GVA (%) in 2018-19, l, , l, , l, , l, , l, , Contribution to GVA, Sector, , India, , Agriculture, , 16, , 7, , 24, , 43, , 26, , 41, , Industry, , 30, , 41, , 19, , 25, , 28, , 24, , Service, , 54, , 52, , 57, , 32, , 46, , 35, , 100, , 100, , 100, , 100, , 100, , 100, , Total, , China, , Distribution of Workforce, , Pakistan, , India, , China, , Pakistan, , Source Human Development Report 2019; Key Indicators of Asia and Pacific 2019, l, , l, , l, , l, , l, , In both India and Pakistan, the contribution of agriculture to GVA were at 16% and 24% respectively. In Pakistan, about, 41% of people work in agriculture whereas in India it is 43%., The sectoral share of output and employment also shows that in all the three economies, service sector contributes highest, share of GVA. Service sector is emerging as major player of development., 24% of Pakistan workforce is engaged in industry but it produces 19% of GVA. In India, industry workforce account for 25%, but produces goods worth 30% of GVA. In China, industries contribute to GVA at 41% and employ 28% of workforce., The proportion of workforce engaged in industry in India and Pakistan were low at 25 and 24% respectively., In the 1980s India, China and Pakistan employed 17, 12 and 27% of its workforce in the service sector respectively. In 2019,, it has reached the level of 32, 46 and 35% respectively., Trends in Output Growth in Different Sectors, 1980–2015, 1980–90, Country, , Agriculture, , Industry, , Service, , Agriculture, , Industry, , Service, , India, , 3.1, , 7.4, , 6.9, , 3.1, , 6.9, , 7.6, , China, , 5.9, , 10.8, , 13.5, , 3.1, , 5.3, , 7.1, , 4, , 7.7, , 6.8, , 1.7, , 4.8, , 5.0, , Pakistan, l, , l, , l, , 2014–2018, , In the last five decades, the growth of agriculture sector, which employs the largest proportion of workforce in all the three, countries has declined., In the industrial sector, China has maintained annear double-digit growth rate in 1980s, but began showing decline in, recent years. Whereas, for India and Pakistan, growth rate has declined., In case of service sector, China was able to maintain its rate of growth during 1980-1990 while there was a positive and, increasing growth of India’s service sector output.
Page 120 :
109, , CBSE Term-II Economics XII, , Human Development Indicator, The performance of India, China and Pakistan in some of the selected indicators of human development are given below, Some Selected Indicators of Human Development, 2017–19, Items, Human Development Index (Value), , India, , China, , Pakistan, , 0.645, , 0.761, , 0.557, , Rank (Based on HDI), , 130, , 87, , 154, , Life expectancy at birth (Years), , 69.7, , 76.9, , 67.3, , 6.5, , 8.1, , 5.2, , 6,681, , 16,057, , 5,005, , Mean years of schooling (% aged 15 and above), GDP per capita (PPP US $), People below poverty line (%) (National), , 21.9*, , 1.7**, , 24.3*, , Infant mortality rate (Per 1,000 live births), , 29.9, , 7.4, , 57.2, , Maternal mortality rate (Per 1 lakh births), , 133, , 29, , 140, , 60, , 75, , 60, , Population using at least basic sanitation (%), Population using at least basic drinking water source (%), Percentage of children under nourished, , 93, , 96, , 91, , 37.9, , 8.1, , 37.6, , Note *For the year 2011;, ** For the year 2015, Sources Human Development Report 2019 and 2020 and World Development Indicators (www.worldbank.org), Key indicators for Asia and, the Pacific 2019, Asian Development Bank (ADB)., , From the data, we would be able to conclude that, China is moving ahead of both India and Pakistan in terms of indicators of human development., China and Pakistan are ahead of India in reducing proportion of people below the poverty line and also its performance in, sanitation., In China, for one lakh births, only 29 women die whereas, in India 133 women die and in Pakistan 144 women die., All the three countries report providing improved drinking water sources for most of its population. China has a smallest, share of poor among the three countries., l, , l, , l, , l, , Development Strategies-An Appraisal, The success and failures of development strategies pursued by China and Pakistan have been discussed below, , Success of Structural Reforms in China, l, , l, , l, , l, , There was existence of infrastructure in the areas of education and health and land reforms., There was decentralised planning and existence of small enterprise., Through the commune system, there was more equitable distribution of foodgrains., There was extension of basic health services in rural areas., , Failures of Structural Reforms in China, l, , l, , l, , There was slow pace of growth and lack of modernisation in the Chinese economy under the Maoist rule., Maoist vision of economic development based on decentralisation, self-sufficiency and shunning of foreign technology, had failed., Despite extensive land reforms, collectivisation, the great leap forward and other initiatives, the per capita gain in output in, 1978 was the same as it was in the mid-1950s., , Success of Structural Reforms in Pakistan, l, , l, , l, , l, , Pakistan has succeeded in more than doubling its per capita income inspite of high growth rate of population., Pakistan has achieved self-sufficiency in the production of food., Pakistan has succeeded in developing its service and industry sectors at a fast rate., The use of modern technology is improving in Pakistan., , Failures of Structural Reforms in Pakistan, l, , l, , Growth rate of GDP and its sectoral constituents have fallen in 1990s., Poverty and unemployment are still areas of major concerns.
Page 121 :
CBSE Term-II Economics XII, , 110, , Chapter, Practice, PART 1, Objective Questions, l, , Multiple Choice Questions, , B, (v), (ii), (v), , C D E, (i) (ii) (iv), (iii) (iv) (v), (i) (ii) (iv), , (b), (d), , A B C D E, (iv) (ii) (i) (v) (iii), (ii) (i) (iv) (iii) (v), , 5. Name any two areas where India is ahead of, , 1. Which of the following is the feature of Indian, economy?, (a) Contribution of industry to GDP is the highest, (b) Contribution of agriculture to employment is the largest, (c) High level of human development, (d) Poor growth of service sector, Ans. (b) Contribution of agriculture to employment is the, largest, , 2. Which of the following features relates to the, Chinese economy?, (a) Very high fertility rate, (b) Growth due to service sector, (c) Growth due to manufacturing sector, (d) High density of population, Ans. (c) Growth due to manufacturing sector, , 3. Special Economic Zones are set up by China to, (a) attract foreign investors, (b) to develop the backward regions, (c) to maintain income equality, (d) to promote private sector, Ans. (a) Policy regarding special economic zones were meant, to incentivise foreign investors by providing low-cost, labour, specifically planning economic zones with ports, and airports so that goods and material could be easily, exported, reducing corporate income tax and even, offering tax exemption., , 4. Match the following., Column I, , Codes, A, (a) (iii), (c) (i), Ans. (a) (iii), , Column II, , A. Economic development in China, , (i) Mao, , B. India’s new development policy, , (ii) China, , C. The great leap forward, , (iii) 1978, , D. Commune, , (iv) Pakistan, , E. First contribution in 1956, , (v) 1991, , Pakistan?, (a) Human development index and rate of GDP, (b) Rate of GDP and infant mortality rate, (c) Improvement in health sector and rate of GDP, (d) Rate of GDP and per capita income., Ans. (d) Rate of GDP and per capita income., , 6. The LPG model of development in context of, Indian economy aimed at ……… ., (a) export led growth strategy as against import, substitution strategy, (b) import led growth strategy as against export led growth, (c) encouraging FDIs to support the growth process, (d) Correctly explained by (a) and (c), Ans. (d) The LPG model of 1991emphasized the role of private, sector and advocated more liberal and market driven, pattern of development., , 7. Which particular year marked the introduction of, economic reforms in Pakistan?, (a) 1978, (b) 1980, (c) 1988, (d) 1991, Ans. (c) In 1988, Pakistan adopted the model of liberalisation,, , stabilisation and structural adjustment., , 8. Find the correct sequence explaining the commencement of five year plans in chronological order., (a) India, China and Pakistan, (b) Pakistan, China and India, (c) China, India and Pakistan, (d) India, Pakistan and China, Ans. (a) India commenced its five year plan s in 1951 while, China in 1953 and Pakistan in 1956., , 9. Arrange the given events in chronological order and, choose the correct alternative., (i) Great Proletarian Cultural Revolution, (ii) Great Leap Forward Campaign, (iii) Introduction of Economic Reforms, (iv) First Five Year Plan
Page 122 :
111, , CBSE Term-II Economics XII, Alternatives, (a) (ii), (iv), (iii), (i), (c) (ii), (iv), (i), (iii), Ans. (b) (iv), (ii), (i), (iii), , 16. Choose the correct statement from the following., (b) (iv), (ii), (i), (iii), (d) (iv), (i), (ii), (iii), , 10. ……… is the population density, the ……… is the, pressure of population on land and more are the, economic problems., (a) Lower, higher, (b) Lower, lower, (c) Higher, lower, (d) Higher, higher, Ans. (d) The population density of an area can greatly affect, that area’s economy and social conditions., , 11. Structural changes are ……… ., (a) changes in the relative contribution of tertiary sector, of Indian economy, (b) changes in relative structure of primary sector of, Indian economy, (c) All of the above, (d) changes in the relative contribution of primary sector, of Indian economy, Ans. (d) A structural change is an economic condition that, occurs when an industry or market changes. How it, functions or operates an instance of such a change or, improvement., , 12. In Pakistan, the reforms were introduced as a result, , (a) China’s economy growth is mainly contributed by the, service sector., (b) One child norm policy was adopted in India., (c) The largest share in national income comes from, agriculture in India., (d) Pakistan is ahead of India in providing improved, sanitation facilities., Ans. (d) Pakistan is ahead of India in providing improved, sanitation facilities., , 17. Which of the following is not an indicator of human, development index?, (a) National income, (b) GDP per capita, (c) Life expectance at birth, (d) Literacy rate, Ans. (a) National income, , 18. Which of the following nation has most skewed sex, ratio?, (a) India, (b) China, (c) Pakistan, (d) None of these, Ans. (a) Sex ratio is the number of female per thousand males., Amongst the given three nations, India has the lowest sex, ratio of 929 females per thousand males., , of the pressure from, (a) IMF, (b) World Bank, (c) Swis Bank, (d) Both IMF AND World Bank, Ans. (d) Both IMF and World Bank, , 13. The reason for slow growth rate and re-emergence, of poverty is ……… ., (a) earning more foreign exchange, (b) growing dependence on foreign loan, (c) decline in poverty rate, (d) All of the above, Ans. (b) There was an increasing dependence on foreign loan, and repayment of these loans became difficult. New loans, were taken to repay older ones and thus, interest, obligation mounted over years., , 14. ……… has followed the classical development, pattern of gradual shift from agriculture to, manufacturing and then to service., (a) Pakistan, (c) China, Ans. (c) China, , (b) India, (d) All of these, , 15. Per capita GNI means, (a) how much is country’s national income, (b) how much is country’s GDP, (c) how much on average a person earns, (d) how much on an average a country earns, Ans. (c) how much on an average a person earns, , 19. The main reason that can be argued for high, growth of population in context of India and, Pakistan is ……… ., (a) high level of illiteracy and high fertility rates, (b) low level of illiteracy and low fertility rates, (c) high level of illiteracy and low fertility rates, (d) low level of illiteracy and high fertility rates, Ans. (a) In 2012, fertility rates in Pakistan, India and China, were 3.3, 2.6 and 1.6 respectively., , 20. Highlight the success which is not common, between India and Pakistan?, (a) Reduction in poverty, (b) Self sufficient in food production, (c) Rise in GDP per capita, (d) Dismal fiscal management, Ans. (d) Dismal fiscal management, l, , Assertion-Reasoning MCQs, Direction (Q. Nos. 1 to 6) There are two statements, marked as Assertion (A) and Reason (R). Read the, statements and choose the appropriate option from the, options given below, (a) Both Assertion (A) and Reason (R) are true and, Reason (R) is the correct explanation of Assertion (A)., (b) Both Assertion (A) and Reason (R) are true, but, Reason (R) is not the correct explanation of Assertion (A), (c) Assertion (A) is true, but Reason (R) is false, (d) Assertion (A) is false, but Reason (R) is true
Page 123 :
CBSE Term-II Economics XII, , 112, 1. Assertion (A) India and Pakistan adopted the mixed, economic model., Reason (R) Mixed economic model allows both, public and private sector to work hand-in-hand, thereby allowing for efficiency., Ans. (a) Both Assertion (A) and Reason (R) are true and Reason, , (R) is the correct explanation of Assertion (A)., , 2. Assertion (A) The major policy initiatives, i.e. land, reforms and green revolution helped India to, become self-sufficient in food grain production., Reason (R) The proportion of people depending on, agriculture did not decline as excepted., Ans. (b) The green revolution has made India self-sufficient in, , food grain production. India has adopted a new strategy in, the field of agriculture. In this, insecticides and pesticides, were used which resulted in great production of wheat and, rice. Due to green revolution, highest rate of growth was, achieved in Punjab and Haryana., , 3. Assertion (A) Every year the government fixes a, target for disinvestment of private sector enterprise., Reason (R) Disinvestment is an excellent tool for, discarding the loss incurring public sector enterprise., Ans. (d) Disinvestment targets are set under each union budget, , and every year the target changes. The government takes, final decision on whether to raise disinvestment target or, not. Disinvestment means sale or liquidation of assets by, the government, usually of central and state public sector, enterprises, projects and other fixed assets., , 4. Assertion (A) Regional and economic groups are, formed to strengthen the economies of member, nations., Reason (R) It helps to understand the development, process followed by member countries and evaluate, our own strength and weakness., Ans. (a) Both Assertion (A) and Reason (R) are true and, , Reason (R) is the correct explanation of Assertion (A)., , 5. Assertion (A) India, Pakistan and China have started, planning their developmental strategies in the same, way., Reason (R) India, China and Pakistan have started, working on their developmental plans at the same, time., Ans. (b) China announced its first five year plan in 1953. India, , and Pakistan adopted similar strategies such as creating a, large public sector and raising public expenditure on, social development. Till the 1980s, all the three countries, have similar growth rate and per capita income., , 6. Assertion (A) There was low population growth in, China., Reason (R) One child policy was adopted by China., Ans. (a) Both Assertion (A) and Reason (R) are true and Reason, , (R) is the correct explanation of Assertion (A)., , l, , Case Based MCQs, 1. Direction Read the following text and answer the, question no. (i) to (vi) on the basis of the same., Though India, Pakistan and China have totally, different political systems but all of them have, followed plans for their economic and social, development. India and Pakistan have followed the, path of mixed economy. China, on the other hand,, had command economy. All the three countries, launched their economic development programme, almost simultaneously in the early part of the, decade of 1950s. While India and Pakistan, depended heavily on the public sector for giving a, big push to the economy, China was absolutely the, state controlled economy. Till the early 1980s, the, major development indicators of all the three, nations such as growth rate, sectorial distribution of, output/income and employment and human, development were more or less similar. The level of, development was also low in all these three, countries. But with the introduction of economic, reforms, changes in their level of development, became visible. As a result of various policy, measures in three countries, China has surpassed, both India and Pakistan in terms of social and, economic development., (i) What is peculiar about the structural transformation, process in context of Indian and Pakistan economy?, , (a) Balanced development of all the sectors with equal, contribution to the GDP, (b) Direct jump from agriculture to services with later, contributing more to the GDP, (c) Transformation in the economic outlook- from, agrarian to industrial, (d) A jump from agriculture to industry with later, contributing more to the GDP, Ans. (b) The ‘structural change’ theory argues that with, development, the share of agriculture sector declines and, that of industry becomes dominant and at higher levels of, development, the service sector contributes more than, the other two sectors. However, in context of India and, Pakistan, there has been a jump directly from agriculture, to services in context of GDP contribution., , (ii) Which of the following pair is incorrectly matched, with regard to the introduction of economic, reforms in context of the given three nations?, Column I, A. India, , Column II, (i), , 1991, , B. China, , (ii), , 1998, , C. Pakistan, , (iii), , 1988, , Codes, (a) A-1, (b) B-2, (c) C-3, (d) None of these, Ans. (b) Reforms were introduced in China in 1978.
Page 124 :
113, , CBSE Term-II Economics XII, (iii) Which of the following factor is relates close to the, Chinese economy?, (a) Very high fertility rate, (b) Growth due to the service sector, (c) Growth due to the manufacturing sector, (d) High density of population, Ans. (c) China’s growth is primarily encouraged by the growth, of the manufacturing sector., , (iv) As against India’s rank at 131, the HDI rank of, Pakistan for the year 2020 is 154. The given, statement is, (a) True, (b) False, (c) Partially true, true for India and false for Pakistan, (d) None of the above, Ans. (a) True, , (v) Which of the following factors is not considered, while constructing the HDI Index?, (a) Long and healthy life measured by life expectancy at, birth, (b) Knowledge as measured by the adult literacy rate, (c) A good environment as measured by appropriate, environment policies, (d) A decent standard of living as measured by GDP per, capita, Ans. (c) A good environment as measured by appropriate, environment policies, , (vi) Assertion (A) Dual price policy in China was an, attempt to encourage industrialisation., Reason (R) Special Economic Zones were an, attempt to attract foreign capital in the country., Alternatives, (a) Both Assertion (A) and Reason (R) are true and Reason, (R) is the correct explanation of Assertion (A)., (b) Both Assertion (A) and Reason (R) are true, but, Reason (R) is not the correct explanation of, Assertion (A)., (c) Assertion (A) is false, but Reason (R) is true, (d) Both the statements are false, Ans. (b) Chinese economic reformers took the view that the, best way was to keep the existing planned economy, but, gradually to build up a free market system alongside., , 2. Direction Read the following text and answer the, question no. (i) to (vi) on the basis of the same., Since its independence in 1947, India has faced, two major financial crises and two consequent, devaluations of the rupee. These crises were in, 1966 and 1991 and this paragraph highlights the, case of 1991., Foreign exchange reserves are an extremely critical, aspect of any country’s ability to engage in, commerce with other countries. A large stock of, , foreign currency reserves facilitates trade with, other nations and lowers transaction costs, associated with international commerce. If a nation, depletes its foreign currency reserves and finds that, its own currency is not accepted abroad, the only, option left to the country is to borrow from, abroad., 1991 is often cited as the year of economic reform, in India. Surely, the government’s economic, policies changed drastically in that year., The Import-Export Policy of 1985-1988 replaced, import quotas with tariffs., This represented a major overhaul of Indian trade, policy as previously, India’s trade barriers mostly, took the form of quantitative restrictions., After 1991, the Government of India further, reduced trade barriers by lowering tariffs on, imports. In the post-liberalisation era, quantitative, restrictions have not been significant., While the devaluation of 1991 was economically, necessary to avert a financial crisis, the radical, changes in India’s economic policies were, to some, extent, undertaken voluntarily by the government, of P V Narasimha Rao., (i) The reforms under liberalisation in the above, situation were referred to as ……… ., (a) depreciation, (b) devaluation, (c) appreciation, (d) revaluation, Ans. (b) devaluation, , (ii) Which of the following reason(s) is/are responsible, for removal of licensing policy in India?, (a) To reduce inefficiency of public sector, (b) Increase the role of private sector, (c) To attract foreign investment, (d) All of the above, Ans. (b) Increase the role of private sector, , (iii) As compared to India, Pakistan opted for which of, the following policies during the economic reforms, of 1988?, (a) Liberalisation, (b) Privatisation, (c) Globalisation, (d) All of these, Ans. (d) All of these, , (iv) Which of the following reginal economic groups, are formed between India, China and Pakistan?, (a) ASEAN, (c) SAARC, Ans. (d) All of these, , (b) G-8, (d) All of these
Page 125 :
CBSE Term-II Economics XII, , 114, (v) Assertion (A) China has done better than India, and Pakistan, as it is a socialist economy., Reason (R) In socialism, government can, implement policies which are in interest of, people., Alternatives, (a) Both Assertion (A) and Reason (R) are true and, Reason (R) is the correct explanation of Assertion (A)., (b) Both Assertion (A) and Reason (R) are true, but, Reason (R) is not the correct explanation of, Assertion (A)., (c) Assertion (A) is false, but Reason (R) is true, (d) Both the statements are false, Ans. (a) Both Assertion (A) and Reason (R) are true and, Reason (R) is the correct explanation of Assertion (A)., , (vi) Read the following statements given below and, choose the correct alternative., Statement I In 1980s, India, China and Pakistan, had similar growth rate., Statement II Fertility rate in India was lowest in, 2017-18., Alternatives, (a) Both are correct., (b) Both are incorrect, (c) Statement I is correct and Statement II is incorrect., (d) Statement I is incorrect and Statement II is correct., Ans. (c) Fertility rate in China was lowest in 2017-18., , PART 2, Subjective Questions, l, , Short Answer (SA) Type Questions, 1. What are the various means by which countries are, trying to strengthen their own domestic, economies?, , (NCERT), , Ans. The various means used by countries to strengthen their, , own domestic economies are, (i) Countries are forming regional and economic groups, such as SAARC, European union, G-8, G-20, etc., (ii) Countries try to understand the development, processes followed by their neighbouring countries, as it helps them to better understand their strength, and weakness., (iii) Nations have also resorted to liberalise their, economies by minimising government interference, in economic activities. The economy is governed by, market forces which promote efficiency and, strengthen the economy., , 2. What similar development and strategies have India, and Pakistan followed for their respective, development paths?, , (NCERT), , Ans. They followed following similar strategies in their, , respective development plans, (i) Both India and Pakistan have followed five year, planning. India announced its first plan in 1951and, Pakistan in 1956., (ii) Both nations adopted a strategy of creating a large, public sector and raising public expenditures on, social development., (iii) Both of them have adopted the mixed economic, system involving the co-existence of both the public, and the private sector., , 3. China’s rapid industrial growth can be traced back, to its reforms in 1978. Do you agree? Elucidate., (NCERT), Ans. Yes, it cannot be denied that China’s rapid industrial, , growth is an aggregate outcome of the various economic, reforms that were introduced in phases since 1978. In the, initial phase, reforms were initiated in agriculture, foreign, trade and investment sectors. The system of collective, farming known as Commune System was implemented., In the later phase, reforms were initiated in the industrial, sector. During this phase, the private firms, village and, township enterprises were allowed to produce goods and, services and to compete with the state owned enterprises., The reforms also included dual pricing., The reforms also included setting up of special economic, zones to attract foreign investors. Therefore, China’s rapid, industrial growth is attributable to the success of different, phases of its economic reforms., , 4. Critically appraise the development strategies of, Pakistan., Ans. The development strategies of Pakistan are summarised, , below, (i) Mixed Economy Pakistan follows a mixed economy, system where both the public and private sectors, co-existed., (ii) Import Substitution Pakistan adopted a regulatory, policy framework in the late 1950s, and 1960s for, import industrialisation., The policy combined tariff protection for, manufacturing of consumer goods together with, direct import controls on competing imports., (iii) Green Revolution This was introduced to increase, productivity and self-sufficiency in food. This, increased the output of food grains. This had changed, the agrarian structure dramatically., In 1970’s, nationalisation of capital goods took place., Pakistan shifted its policy orientation in 1970’s and, 1980’s when the private sector got, encouragement.
Page 126 :
115, , CBSE Term-II Economics XII, , 5. (i) What is the important implication of the ‘one, child norm’ in China?, (ii) Explain the great leap forward campaign of, china as initiated in 1958., (NCERT), Ans., , (i) One child policy was introduced in china in the late, 1970s. This policy resulted in a decline in the, growth of population. It has an important, implication also. After a few decades, there will be, more elderly people in proportion to young people., This will compel China to initiate step to provide, social security measures with fewer workers, (ii) The great leap forward campaign initiated by China, in 1958 aimed at industrialising the country on a, massive scale. Under this programme, people were, encouraged to set up industries in their backyards., The system of collective farming known as commune, system was implemented., , 9. Critically assess pre and post-reform period in China., Ans. Pre-reform Period, , (i) There was massive establishment of infrastructure in, the areas of education and health., (ii) Extensive land reforms were introduced to bring, about changes in the ownership of land holdings and, encourage equity., (iii) Development of small enterprises was promoted on, a large scale., Post-reform Period, (i) Reforms in agriculture brought about prosperity to a, vast number of poor people., (ii) Reforms created conditions for the subsequent, phenomenal growth in rural industries., (iii) Strong support base was built up for more reforms., , 10. ‘‘India, China and Pakistan have many similarities, in their development strategies.’’ Elaborate., , 6. Mention the salient demographic indicators of, China, Pakistan and India., , (NCERT), , Ans. India, China and Pakistan have many similarities in, , development strategies which are as follows, (i) All the three countries had started planning their, development strategies in similar ways. India, announced its five year plan in 1951-56, while, Pakistan announced its first five year plan in 1956,, which is called ‘Medium Term Plan’ China announced, its first five year plan in 1953., (ii) India and Pakistan adopted similar strategies such as, creating a large public sector and raising public, expenditure on social development., (iii) Till the 1980s, all the three countries had similar, growth rates and per capita incomes., (iv) Economic reforms took place in all the three, countries, reforms started in India in 1991, in China, in 1978 and in Pakistan in 1988., , Ans. The salient demographic indicatiors of China, Pakistan, , and India are discussed below, (i) China is the most populous country followed by India, with 1352 million and Pakistan with 212 million., (ii) China has the lowest density of population and India, has the highest with 455. For Pakistan this figure is, 275., (iii) Sex ratio is baised against females in all the three, nations. It is estimated at 924, 949 and 943 for India,, China and Pakistan respectively., (iv) Urbanisation is high in both Pakistan (37 %) and, China (59%). In India, 34% of people are living in, urban areas., , 7. Write a brief note on the commune system in China., Ans. Commune system was started in the rural areas of China,, , under which people collectively cultivated lands., Commune lands were divided into small plots. These, plots were allocated to individual households for, cultivation, not ownership. Households were allowed to, keep all income from the land after paying specified, taxes. In 1958, there were 26,000 communes covering, almost all the farm population. The commune system, resulted in more equitable distribution of food grains in, China., , 8. State the factors which created a conducive, environment for new investments in Pakistan., Ans. Following factors created conducive environment for new, , investments in Pakistan, (i) Adoption of green revolution, (ii) Shift of the orientation of nationalisation policy to, denationalisation and encouragement to private sector, (iii) Financial support from western nations, (iv) Growing remittances from Pakistani workers in the, middle-east., , 11. (i) Enumerate the reasons of success of structural, reforms in China., (ii) Enumerate the failures of the structural reforms, in China., Ans., , (i) The reasons of success of structural reforms in China, are enumerated below (any two), (a) There was existence of infrastructure in the areas of, education, health and land reforms., (b) There was decentralised planning and existence of, small enterprise., (c) Through the commune system, there was more, equitable distribution of foodgrains., (d) There was extension of basic health services in rural, areas., , (ii) Following are the failure of structural reforms in, China (any two), (a) There was slow pace of growth and lack of, modernisation in the Chinese economy under the, Maoist rule.
Page 127 :
CBSE Term-II Economics XII, , 116, (b) Maoist vision of economic development is based on, decentralisation, self-sufficiency and shunning of, foreign technology had failed., (c) Despite extensive land reforms, collectivisation, the, great leap forward and other initiatives, the per, capita gain in output in 1978 was the same as it was, in the mid-1950s., , 12. Explain briefly the various development strategies, of China., Ans. Certain development strategies of China are discussed, , below, (i) Great Leap Forward (GLF) Campaign This, campaign initiated in 1958, aimed at industrialising, the country on a massive scale. People were, encouraged to setup industries in their backyards. In, rural areas, communes were started. Under the, commune system, people collectively cultivated, land., (ii) Great Proletarian Cultural Revolution (1966-76) In, 1965, Mao Tse Tung started a cultural revolution on a, large scale. In this revolution, students and, professionals were sent to work and learn from the, countryside., (iii) 1978 Reforms Since 1978, China began to, introduce many reforms in phases. The reforms were, initiated in agriculture, foreign trade and investment, sector. In agriculture, lands were divided into small, plots which were allocated to individual households., They were allowed to keep all income from the land, after paying taxes. In later phase, reforms were, initiated in industrial sector. All enterprises which, were owned and operated by local collectives in, particular, were allowed to produce goods., (iv) One Child Norm The Chinese government, introduced one-child norm to check its growing, population. Couples were allowed to have only one, child. In case, they gave birth to second child, social, assistance was stopped., , 13. Comment on the growth rate trends witnessed in, China, India and Pakistan in the last two decades., (NCERT), Ans. China has a second largest GDP (PPP) of $ 2.5 trillion in, , the world where as India’s GDP (PPP) $ 9.03 trillion and, Pakistan GDP (PPP) is $ 0.94 trillion, roughly about 11%, of India’s GDP. In 1980, Pakistan was ahead of India., China was having double digit growth and India was at, the bottom. In 2015-2017, there was a decline in Pakistan, and China’s growth rate, whereas India met with, moderate increase in growth rate., In both India and Pakistan, the contribution of, agriculture was 16 and 24% respectively but the portion, of workforce that work in this sector is more in India. In, Pakistan, about 41% of people work in agriculture, whereas in India it is 43%., , 14. ‘‘India, China and Pakistan have travelled more, than seven decades of developmental path with, varied results.’’ Explain the given statement with, valid arguments., (CBSE 2020), Ans. ‘‘India, China and Pakistan have travelled more than, , seven decades of developmental path with varied, results.’’ This statement can be explained with the help of, following arguments, (i) Till the late 1970s, all of them were maintaining the, same level of low development. The last three, decades have taken these countries to different, levels., (ii) Indian economy performed moderately, but majority, of the population depends on agriculture and 1/4th, of the population lives below poverty line., Infrastructure is also lacking in many parts of the, country., (iii) Pakistan economy was slowdown because of political, instability, over dependence on remittances and, foreign aid along with volatile performance of, agriculature sector., (iv) China used the market system without losing, political commitment and succeeded in raising the, level of growth along with alleviation of poverty., Public intervention in providing social infrastructure, bought positive results in human development, indicators in China., , 15. Compare India and Pakistan on the basis of their, demography., , (CBSE 2020), , Ans. India and Pakistan can be compared on demographic, , front as follows, (i) The population of Pakistan is very small and, accounts for roughly about 1/10th of India., (ii) Pakistan have more proportion of urban people than, India., (iii) The fertility rate is very high in Pakistan as, compared to India., (iv) The sex ratio of the two nations stand quite near to, each other, showing preference of male child in both, the nations. India stands at 924 females per 1,000, males and Pakistan stands at 943 females per 1,000, males., , 16. Define liberty indicators. Give some examples of, liberty indicators., , (NCERT), , Ans. ‘Liberty indicators’ are those indicators which represent, , the degree of civil and political freedom to individuals in, a country. They should also be considered alongwith, indicators of income, health and education in the human, development index., One such indicator has actually been added as a measure, is ‘the extent of democratic participation in social and, political decision-making’ but it has not been given any, extra weight.
Page 128 :
117, , CBSE Term-II Economics XII, Some other ‘liberty indicators’ are measures of ‘the extent, of constitutional protection given to rights of citizens’ or, the extent of constitutional protection of the, ‘Independence of the Judiciary’ and the ‘Rule of Law’, which have not been introduced in HDI till now., Without including such indicators and giving them, adequate weightage, the construction of a human, development index remains incomplete and its usefulness, remains limited., , 17. In which areas India has an edge over Pakistan?, Ans. In the area of skilled manpower, research and, , development institutions, India is better placed than, Pakistan., Indian scientists excel in the areas of defence technology,, space research, electronics and avionics, genetics, tele, communications, etc. The number of PhDs produced by, India in science and engineering every year (about 5000), is higher than the entire stock of PhDs in Pakistan. Issues, of health facilities in general and infant mortality in, particular are better addressed in India., l, , Long Answer (LA) Type Questions, , 1. Describe the path of development initiatives taken, by Pakistan for its economic development. (NCERT), Ans. For economic development Pakistan followed the mixed, , economy model with co-existence of public and private, sectors., The different policies adopted by Pakistan are stated, below, (i) A variety of regulated policy frameworks were, introduced in late 1950s and 1960s., (ii) Protection of consumer goods, domestic industries, through tariff harriers., (iii) The introduction of green revolution and, mechanisation in agriculture sector., (iv) Public investment in infrastructure in selected areas., (v) Nationalisation of capital goods, industries was, introduced in 1970s., (vi) In 1980s, denationalisation and encouragement to, private sector., (vii) In 1988, economic reforms were initiated in the, economy., , 2. What are the reasons for slow growth and, re-emergence of poverty in Pakistan?, Ans. Reasons for the slow growth and re-emergence of, , poverty in Pakistan, (i) Traditional Method in the Agricultural Sector The, agricultural production method was not based on, institutional basis of technology. As a result of a good, harvest system, agricultural production remained, unstable and highly vulnerable to climatic, conditions. Good harvest relies largely on a good, monsoon. If the conditions were not good, then the, economic growth showed a negative trend., , (ii) High Dependence on Public Sector Enterprises, Great emphasis on the significant role of the public, sector was given in the process of growth as they, rely on huge investment of the government. As, public sector enterprises lack operational efficiency, and poor management of scarce resources, it led to, slow progress in productivity., (iii) High Dependence on Foreign Loans Generally, the, balance of payment crisis was set right by borrowing, funds from external sources such as International, Monetary Fund (IMF) and World Bank. Foreign, exchange earnings are one of the essential, components where a country can earn through, sustainable export of manufactured goods. In, Pakistan, major foreign exchange was earned from, the remittances of Pakistani workers in the Middle, East and export of highly unstable agricultural, products. There was a high dependence on foreign, loans and this increased the problem to repay the, loan amount., (iv) Lack of Political Stability Huge public expenditure, was incurred on law and order to stabilise the, unfavourable political situation. This unproductive, expenditure caused a drain on economic resources., (v) Inadequate Infrastructure Pakistan was not able to, attract foreign investment and trade activities, because they lack infrastructural facility for business, development., , 3. Compare and contrast the development of India,, China and Pakistan with respect to some salient, human development indicators., (NCERT), Ans. The development of India, China and Pakistan with, , respect to some salient human development indicators, can be assessed and compared with the help of the, following points, (i) China is ahead of India and Pakistan in human, development indicators. China has better ranking in, terms of income indicator such as GDP per capita or, proportion of population below poverty line or, health indicators such as mortality rates, access to, sanitation, literacy, life expectancy or, malnourishment., (ii) India is ahead of Pakistan in reducing proportion of, people below the poverty line as per Human, Development Report 2019., (iii) India’s performance in education, sanitation and, access to water is better than Pakistan., (iv) Maternal mortality is very high in India and Pakistan, as compared to China. In China, for one lakh births,, only 29 women die whereas in India and Pakistan,, more than 130 women die., (v) All the three countries provide improved water, sources for most of their population., (vi) Considering the international poverty rate of $ 2 a, day, India has the largest share of poor among the, three countries in absolute terms.
Page 129 :
CBSE Term-II Economics XII, , 118, 4. Write a brief note on the following international, organisations, (i) SAARC, (iii) European Union, (v) G-20, Ans., , (ii) ASEAN, (iv) G-8, (vi) BRICS, , (i) SAARC South Asian Association for Regional, Cooperation (SAARC) was established on 8th, December, 1985 to encourage cooperation among, member countries in the fields of agriculture, health,, population control, anti-terrorism measurs, rural, development, science and technology and narcotics, control Afghanistan, Bangladesh, Bhutan, India,, Maldives, Nepal, Sri Lanka and Pakistan are its, members. It was formed on the proposal of, Zia-Ur-Rehman, the then President of Bangladesh., Its head quarter is in Kathmandu., (ii) ASEAN Association of South East Asian Nation, (ASEAN) was created on 8th August, 1967 by, Indonesia, Malaysia, the Philippines, Singapore and, Thailand with objectives to accelerate economic, growth, social progress, regional stability and to, resolve their differences peacefully. Subsequently,, Brunei, Cambodia, Laos, Myanmar and Vietnam also, joined this association. It is headquartered at Jakarta., (iii) European Union It is a political and economic, union of 27 member states that is primarily located, in Europe. It was formed to develop an internal, single market regulated by a same set of laws to, ensure free movement of people, goods and services, between the member nations. A common currency, ‘Euro’ circulates in all the member nations. Austria,, France, Germany, Italy, Spain and Sweden are, important member nations. Brussels is the defacto, capital of the European Union., , (iv) G-8 It is an inter-governmental political forum of, the industrialised economies of the world, which are, democratic in character. Initially, formed in 1975,, with six member countries, viz., France, Germany, Italy, Japan, The United Kingdom, and The United States, this association came to be, known as G-8 with the inclusion of Canada in 1976, and of Russia in 1997. However, in 2014 Russia has, been expelled from the membership of G-8,, temporalily. This forum represents about 65% of the, world economy., (v) G-20 It is an international form comprising of the, governments and Central Bank governors of 20, major economies. It was founded in 1999 with an, objective to study, review and promote high-level, discussions of measures to promote international, financial stability., The members include 19 individual countries, viz., Argentina, Australia, Brazil, Canada, China, France,, Germany, India, Indonesia, Italy, Japan, South, Korea, Mexico, Russia, Saudi Arabia, South Africa,, Turkey, The United Kingdom, The United States,, alongwith the European Union., (vi) BRICS BRICS is the acronym representing, association of five major emerging national, economies, viz. Brazil, Russia, India, China and, South Africa., All the member countries are leading developing or, newly industrialised countries and are characterised, by their fast growing economies and those who, significantly influence their regional affairs. It was, formed in 2011 and works on the principles of, non-interference, equality and mutual benefit.
Page 130 :
Chapter Test, Multiple Choice Questions, , 1., , Due to introduction of ‘one child policy’, China’s fertility rate declined from ……… to ……… births., , (a) 3 to 1, (c) 3 to 1.8, , 2., , (b) 2 to 1, (d) None of these, , China has a very less proportion of cultivable land due to which of the following reasons?, , (a) Topographic condition (b) Climatic condition, , 3., , (c) Economic condition, , (d) Both (a) and (b), , Apart from instruction of international agencies, which other reasons forced Pakistan to implement economic reforms?, , (a) Political instability, (b) Over dependency on foreign aid, (c) Volatile performance of agriculture, (d) All of the above, , 4., , After India’s independence and partition of country. India imported huge amount of food grains from Pakistan due to, which of the following reasons?, , (a) India’s fertile land went to Pakistan during the partition of India and Pakistan in 1947., (b) India’s policy were inappropriate, (c) Due to famines there were food insecurity, (d) All of the above, , 5., , Which sector of the economy contributes the highest to China’s GDP?, , (a) Primary sector, (c) Tertiary sector, , (b) Secondary sector, (d) All of these, , Short Answer (SA) Type Questions, , 1., , Scholars find son preference as a common phenomenon in many developing countries including India, China and, Pakistan. Do you find this phenomenon in your family and neighborhood? Why do people practice discrimination, between male and female children? What do you think?, , 2., , The phenomenon of male child-preference is common in many developing countries including India, China and, Pakistan. Why do people practice discrimination between male and female child?, , 3., , Group the following features pertaining to the economies of India, China and Pakistan under three heads., (i) One-child norm, (ii) Low fertility rate, (iii) High degree of urbanisation, (iv) Mixed economy, (v) Very high fertility rate, (vi) Large population, (vii) High density of population, (viii) Growth due to manufacturing sector, (ix) Growth due to service sector, , 4., 5., , Write a short note on the history of revolution of PRC., What were the economic reforms introduced in all the three countries (India, China and Pakistan)?, , Long Answer (LA) Type Questions, , 1., 2., , Is it possible for India to introduce ‘One Child Norm’ like China to reduce population? Write your views., What is demography and demographic indicators?, , Answers, Multiple Choice Questions, 1. (c), , 2. (d), , 3. (d), , 4. (a), , 5. (b), , For Detailed Solutions, Scan the code
Page 134 :
Economics, Class 12th ( Term II ), , Practice Paper 1, , *, , (Solved), Time : 2 Hours, Max. Marks : 40, , Instructions, , 1. There are 12 questions in the question paper. All questions are compulsory., 2. Question no. 1-3 are Case Based MCQs. Each question carries 1 mark., 3. Question no. 4-6 and 9 are Short Answer Type Questions. Each question carries 3 marks., 4. Question no. 7-8 and 10-12 are Long Answer Type Questions. Each question carries 5 marks., 5. There is no overall choice. However, internal choices have been provided in some questions. Students have to attempt, only one of the alternatives in such question., , * As exact Blue-print and Pattern for CBSE Term II exams is not released yet. So the pattern of this, paper is designed by the author on the basis of trend of past CBSE Papers. Students are advised, not to consider the pattern of this paper as official, it is just for practice purpose., , Part-I Macroeconomics, Case Based MCQs (1 × 3 = 3 Marks), , If all the people of the economy increase the proportion of income they save (i.e. if the MPS of the economy, increases) the total value of savings in the economy will not increase-it will either decline or remain, unchanged. This result is known as the Paradox of Thrift-which states that as people become more thrifty, they end up saving less or same as before. Let us understand it with the help of an example., Suppose at the initial level, income (Y) = 250, MPC = 0 8. and MPS = 0 2., Now, people decide to cut down their expenditure as there is a threat of an imminent war. Hence the MPS, of the economy increases, or, alternatively, the MPC decreases from 0.8 to 0.5. At the initial income level of, this sudden decline in MPC will imply a decrease in aggregate consumption spending and hence in, aggregate demand, by an amount equal to (0.8 - 0.5) 250 = 75. But as aggregate demand decreases by 75,, there emerges an excess supply equal to 75 in the economy. So, producers decide to cut the value of, production by 75 in the next round to restore equilibrium in the market., But that would mean a reduction in factor payments in the next sound and hence a reduction in income by, 75. As income decreases, people reduce consumption proportionately but, this time, according to the new, value of MPC which is 0.5. Consumption expenditure, and hence aggregate demand, decreases by (0.5) 75,, which creates again an excess supply in the market. In the next round, therefore, producers reduce output, further by (0.5)75. Income of the people decreases accordingly and consumption expenditure and aggregate, demand goes down again by (0.5)75 . So, as income decreases, savings also decreases., , 1. What situation occurred in the market with decrease in consumption expenditure?, (a) It create excess demand in the market, (c) No effect on market, , (b) It create excess supply in the market, (d) None of these, , 2. Statement I Individual accumulation in savings doesn’t necessarily implies decrease in aggregate demand in, absolute terms., Statement II MPC tends to fall with rise in income as people start to save a portion of their increased, income.
Page 135 :
124, , CBSE Term-II Economics XII, , Alternatives, (a) Both are correct, (b) Both are incorrect, (c) Statement I is correct and Statement II is incorrect, (d) Statement II is correct and Statement I is incorrect, , 3. Assertion (A) The aggregate demand in the economy changes according to the proportion of total income, that is spent on consumption., Reason (R) As the level of income rises, APC tends to fall and APS tends to rise., Alternatives, (a) Both Assertion (A) and Reason (R) are true and Reason (R) is the correct explanation of Assertion (A), (b) Both Assertion (A) and Reason (R) are true, but Reason (R) is not the correct explanation of Assertion (A), (c) Assertion (A) is false, but Reason (R) is true, (d) Both are false, Short Answer (SA) Type Questions (3 Marks), , 4. ‘Investment demand includes financial investment like purchase of shares from secondary market’. Do, you agree?, , 5. Giving reasons, state whether the following statements are true or false., (i) Average propensity to save is always greater than zero., (ii) Value of investment multiplier varies between zero and infinity., Or, Define multiplier. What is the relation between marginal propensity to consume and multiplier? Calculate, the marginal propensity to consume if the value of multiplier is 4., , 6. Complete the following table, Income Consumption Marginal Propensity to Save (MPS), , Average Propensity to Consume (APC), , 0, , 15, , −, , −, , 50, , 50, , L, , L, , 100, , 85, , L, , L, , 150, , 120, , L, , L, Or, , Calculate autonomous consumption expenditure from the following data about an economy which is in, equilibrium, National Income, = ` 500, Marginal Propensity to Save = 0.30, Investment expenditure, , = 100, , Long Answer (LA) Type Questions (5 Marks), , 7. Giving reason, justify whether the following are included in the estimation of national income or not., (i), (ii), (iii), (iv), (v), , School examination fee paid by a student., Free medicines provided by the government., Subsidised lunch provided to workers by their employer., Financial help given to recover from capital loss., Old age pension paid to elderly people., Or, There are only two producing sectors A and B in an economy. Calculate., (i) Gross Value Added at Market Price by each sector.
Page 136 :
125, , CBSE Term-II Economics XII, , (ii) National Income., S.No., , Contents, , ` (in crore), , (a), , Net Factor Income from Abroad, , (b), , Sales by A, , 1,000, , (c), , Sales by B, , 2,000, , (d), , Change in Stock of B, , (e), , Closing Stock of A, , 50, , (f), , Opening Stock of A, , 100, , (g), , Consumption of Fixed Capital by A and B, , 180, , (h), , Indirect Taxes Paid by A and B, , 120, , (i), , Purchase of Raw Materials by A, , 500, , (j), , Purchase of Raw Materials by B, , 600, , (k), , Exports by B, , 20, , (–) 200, , 70, , 8. Write down the three identities of calculating the GDP of a country by three methods., Part-II Indian Economic Development, Short Answer (SA) Type Question (3 Marks), , 9. A study estimates that medical costs alone push down 2.2% of the population below the poverty line each, year. How?, Or, ‘‘Employment is considered as important in the Indian development policy.” Comment., Long Answer (LA) Type Questions (5 Marks), , 10. (i) ‘Special Economic Zone (SEZ) increases foreign investment’. Explain., (ii) There is a general perception going around in India that there is sudden increase in dumping of, Chinese goods into India which will have implications for manufacturing sector in India and also that, we do not engage ourselves in trading with our neighbouring nations. Look at the following table,, which shows export from India to, and imports from, Pakistan and China. Interpret the results., Exports from India (` in crore), Country, , Imports to India (` in crore), , 2004-05, , 2014-15, , Annual Rate of, Growth (%), , 2004-05, , 2014-15, , Annual Rate, of Growth (%), , Pakistan, , 2,341, , 11,351, , 39, , 427, , 3,041, , 61, , China, , 25,232, , 73,038, , 19, , 31,892, , 3,69,541, , 106, , 11. What do you mean by public health? Also, discuss the major public health measures undertaken by the, state in recent years to control diseases., Or, How has women’s health become a matter of concern?, , 12. Describe the meaning of seasonal unemployment. Suggest measures for reducing this kind of, unemployment in India., Or, , ‘‘Air pollution contribute to the environmental crisis in India.’’ Comment.
Page 137 :
126, , CBSE Term-II Economics XII, , Answers, (b) It create excess supply in the market., (a) Both are correct, (c) Assertion (A) is false, but Reason (R) is true, No, I do not agree. The term ‘investment’, here refers to real investment not the financial investment. Real investment, is concerned with the increase in stock of capital assets such as, tools, equipments, structure, inventories and also, increase in consumer goods., 5. (i) No, the statement is false. When consumption is greater than the income level, the value of average propensity to, save is less than zero or negative., 1., 2., 3., 4., , (ii) No, the statement is false. We know that, K =, , 1, , so, even if the MPC will have its minimum value, i.e., 1 − MPC, , zero, the investment multiplier will be 1., Similarly, when MPC = 1, the value of investment multiplier is infinity. So, we can say that the value of, investment multiplier varies between 1 and infinity., , Or, Multiplier It is measured as the ratio between change in income and change in investment., ∆Y, K=, ∆I, Relation between Marginal Propensity to Consume and Multiplier There is direct and positive relationship, between MPC (Marginal Propensity to Consume) and multiplier. Higher the MPC, higher will be the value of, multiplier and vice-versa., 1, K=, 1 − MPC, 1, If multiplier is 4, K=, MPS, 1, 4=, MPS, 1, MPS = = 0 .25, 4, MPC + MPC =1, MPC+ 0.25 = 1, MPC = 0 .75, 6. S = Y − C ,, , Income (Y), , Consumption (C) Saving (S) ( Y − C ), , ∆S, , ∆Y, , MPS ( ∆S / ∆Y), , APC (C/Y), , 0, , 15, , − 15, , –, , –, , –, , –, , 50, , 50, , 0, , 15, , 50, , 0.3, , 1.0, , 100, , 85, , 15, , 15, , 50, , 0.3, , 0.85, , 150, , 120, , 30, , 15, , 50, , 0.3, , 0.8, , Or, Given, Y = ` 500, MPS = 0.30, I = 100, C = ?, b or MPC = 1 − MPS = 1 − 0.30 = 0.70, Y = C + I or Y = C + bY + I, 500 = C + 0.70 × 500 + 100, 500 = C + 350 + 100, C = 500 − 450 = 50, ∴ Autonomous consumption ( C ) = 50
Page 138 :
127, , CBSE Term-II Economics XII, , 7. (i) Yes, as it is a part of private final consumption expenditure., , (ii), (iii), (iv), (v), , Yes, as it is a part of government final consumption expenditure., Yes, as it is a part of compensation to the employees., No, as it is a transfer payment and does not affect National Income., No, as it is a transfer payment and does not affect National Income., Or, (i) Gross Value Added by A = Sales by A + Change in Stock of A (Closing Stock of A − Opening Stock of A), − Purchases of Raw Materials by A, = 1, 000 + ( 50 − 100 ) − 500 = 950 − 500 = ` 450 crore, Gross Value Added by B = Sales by B + Change in Stock of B − Purchase of Raw Materials by B, = 2, 000 + ( − 200 ) − 600 = 1, 800 − 600 = ` 1,200 crore, Gross Value Added by A and B = 450 + 1, 200 = ` 1,650 crore, , (ii) National Income (NNPFC), = GDPMP (Gross Value Added by A and B) − Consumption of Fixed Capital by A and B, − Indirect Taxes Paid by A and B + Net Factor Income from Abroad, = 1, 650 − 180 − 120 + 20 = ` 1,370 crore, 8. Three identities of calculating GDP are as follows, (i) Product Method or Value Added Method It is that method which measures national income in terms of value, addition by each producing enterprise in the economy., It is calculated as, Gross Value Added in the Primary Sector at Market Price + Gross Value Added in the Secondary Sector at, Market Price + Gross Value Added in the Tertiary Sector at Market Price = GDP MP ., GDP MP – Depreciation = Net Domestic Product at Market Price (NDPMP ), NDP MP – Net Indirect Tax = Net Domestic Product at Factor Cost (NDPFC ), NDP FC+ NFIA = National Income, (ii) Income Method Under this method, National Income is measured in terms of factor payments to the owners of, factors of production., It is calculated as, Compensation of Employees + Operating Surplus + Mixed Income of the Self-employed, = Net Domestic Income at Factor Cost, Net Domestic Income at Factor Cost + NFIA = National Income, (iii) Expenditure Method Under this method, National Income is measured in terms of expenditure on the, purchase of final goods and services produced in the economy., It is calculated as, Private Final Consumption Expenditure + Government Final Consumption Expenditure, + Gross Domestic Fixed Capital Formation + Change in Stock + Net Exports = GDP MP, GDP MP – Depreciation = Net Domestic Product at Market Price (NDPMP ), NDPFC NDP MP – Net Indirect Tax = NDP FC, NDP FC + NFIA = National Income, 9. Public health facilities are highly inadequate in our country. These facilities are also lacking in quality. So even poor, and middle class people do not prefer to use these facilities., So, in case of a medical emergency, they are forced to avail expensive services of private hospitals and health, centres. These expenses prove to be a heavy burden on these families and they are forced to sell whatever, valuables they have, to fund the treatment. This pushes the families below poverty line., , Or, Employment is considered so important in the Indian development policy because of the following reasons, (i) More employment will lead to higher level of national income since, production and employment are directly, related., (ii) Employment is crucial to removal of poverty.
Page 139 :
128, , CBSE Term-II Economics XII, , 10. (i) A Special Economic Zone (SEZ) is a geographical, , region that has economic laws different from a, country’s typical economic laws. Usually, the goal, is to increase foreign investment., Special Economic Zones attract investors since, they offer high quality infrastructure facilities and, support services. Besides allowing duty free, import of capital goods and raw materials,, attractive fiscal incentives and simpler customs,, banking and other procedures are offered in such, zones., (ii) The given table reveals that trade with Pakistan, and China has grown over the years. But what is, disturbing, is the fact that imports have grown, more than the exports. Also, imports from China, have grown at a staggering rate of 106%. This, statistic helps in proving the perception that there, is sudden increase in dumping of Chinese goods, into India. This definitely will affect our secondary, sector adversely., 11. The science and practice of protecting and improving, the health of a community, as by preventive medicine,, health education, control of communicable diseases,, application of sanitary measures and monitoring of, environmental hazards, is called public health., In the recent years, government has built up a vast, health infrastructure equipped with trained manpower, at different levels., The following measures have been initiated by the, state in recent years to promote public health, (i) Establishing healthcare institutions, (ii) Expanding the health facilities, (iii) Expanding the facilities for medical education., (iv) Promoting preventing medicine., All these measures have helped to control diseases like, small pox, malaria, TB, etc., Or, Women constitute about half the total population in, India. They suffer from many disadvantages as, compared to men in the areas of education,, participation in economic activities and healthcare., There is growing incidence of female foeticide in the, country which is the cause of deterioration of child sex, ratio from 927 in 2001 to 914 in 2011. Close to, 3,00,000 girls under the age of 15 are not only married, but have already borne child, at least once., More than 50% of married women between the age, group of 15 and 49 years suffer from anaemia caused, by iron deficiency. It has contributed to 19% of, maternal deaths. Abortions are major cause of, maternal morbidity and mortality in India. All these, statistics present a grim picture of women health in, India and are a cause of concern., Because of poor health, women in rural areas specially,, are not able to work and supplement their low family, , income. Women’s health also becomes important, because only a healthy mother can give birth to a, healthy child, which will also reduce the risk of, maternal deaths., 12. It refers to a situation where a number of persons are, not able to find job in a particular season. It occurs in, case of agriculture, ice-cream factories, woollen, factories, etc., Following measures may be suggested to reduce, seasonal unemployment, (i) Promotion of multiple cropping, i.e., raising, more than one crop on the same piece of land in, a year., (ii) Development of activities allied to agriculture, such as animal husbandry, dairy farming,, horticulture, etc to provide extra employment, throughout the year., (iii) Public investment in rural areas in such fields as, irrigation, drainage, flood control, land and, environment, improvement of rural roads,, schools, hospitals, etc., (iv) Promotion of on-farm investment. Overhaul of, machinery, training of farm labour and, programmes for eradication of illiteracy during, slack seasons., (v) Mechanisation of peak season activities so that a, proportion of the labour force is permanently, shifted from agriculture to non-seasonal, activities and surplus labour in the slack season, is reduced., (vi) Establishment of a variety of industries which, operate at different times of the year so that, labour may be kept employed almost throughout, the year by shifting from one seasonal industry to, another., Or, In India, air pollution is widespread in urban areas, where vehicles are the major contributors and in a, few other areas which have a high concentration of, industries and thermal power plants. Vehicular, emissions are of particular concern since these are, ground level sources and thus, have the maximum, impact on the general population. The number of, motor vehicles has increased from about 3 lakh in, 1951 to 67 crore in 2003. In 2003, personal transport, vehicles (two–wheeled vehicles and cars only), constituted about 80% of the total number of, registered vehicles thus, contributing significantly to, total air pollution load., India is one of the ten most industrialised nations of, the world. But this status has brought with, it unwanted and unanticipated consequences such as, unplanned urbanisation, pollution and the risk of, accidents. The CPCB (Central Pollution Control, Board) has identified 17 categories of industries, (large and medium scale) as significantly polluting.
Page 140 :
Economics, Class 12th ( Term II ), , Practice Paper 2, , *, , (Unsolved), Time : 2 Hours, Max. Marks : 40, , Instructions, , 1. There are 12 questions in the question paper. All questions are compulsory., 2. Question no. 1-3 are Case Based MCQs. Each question carries 1 mark., 3. Question no. 4-6 and 9 are Short Answer Type Questions. Each question carries 3 marks., 4. Question no. 7-8 and 10-12 are Long Answer Type Questions. Each question carries 5 marks., 5. There is no overall choice. However, internal choices have been provided in some questions. Students have to attempt, only one of the alternatives in such question., , * As exact Blue-print and Pattern for CBSE Term II exams is not released yet. So the pattern of this, paper is designed by the author on the basis of trend of past CBSE Papers. Students are advised, not to consider the pattern of this paper as official, it is just for practice purpose., , Part I Macroeconomics, Case Based MCQs (1 × 3 = 3 Marks), , The Reserve Bank of India (RBI), cut Repo Rate, to 4.4%, the lowest in at least 15 years. RBI also, introduced the Cash Reserve Ratio (CRR) to be, maintained by the banks for the first time in over, seven years. CRR for all banks was cut by 100, basis points to release Rs. 1.37 lakh crores across, the banking system. RBI governor Dr. Shakti, Kanta Das predicted a big global recession and, said India will not be immune. It all depends how, India responds to the situation. Aggregate, demand may weaken and ease core inflation., , 1. Decrease in cash reserve ratio will lead to, ……… ., (a) fall in aggregate demand, (b) rise in aggregate demand, (c) no change in aggregate demand, (d) fall in general price level, , 2. Assertion (A) Cash reserve ratio is the most, effective tool used by Central Bank under its, quantitative policy measure., Reason (R) Quantitative tools directly impact, money supply and thus most often used, Alternatives, (a) Both Assertion (A) and Reason (R) are true and, Reason (R) is the correct explanation of Assertion (A)., , (b) Both Assertion (A) and Reason (R) are true, but Reason, (R) is not the correct explanation of Assertion (A), , (c) Assertion (A) is false, but Reason (R) is true, (d) Both are false, , 3. The impact of ‘excess demand’ under Keynesian, theory of income and employment, in an economy, are, (a) decrease in income, output, employment and general, price level, (b) decrease in nominal income, but no change in real, output, (c) increase in income, output, employment and general, price level, (d) No change in output/employment but increase in, general price level, Short Answer (SA) Type Questions (3 Marks), , 4. In an economy, Aggregate Demand is greater, than Aggregate Supply. Explain the changes that, will take place in this economy., Or, What is bank rate policy? How does it work as a, method of credit control?, , 5. An economy is in equilibrium. Calculate, Marginal Propensity to Consume, National Income = ` 1,000, Autonomous Consumption Expenditure = ` 200, Investment Expenditure = ` 100
Page 141 :
130, , CBSE Term-II Economics XII, , Or An economy is in equilibrium. From the, following data, calculate the Marginal, Propensity to Save., (a) Income = ` 10,000, (b) Autonomous consumption = ` 500, (c) Consumption expenditure = ` 8,000, , (ii) Find Net Value added at Market Price., Items, (a), , (`n in lakhs), , Fixed Capital Good with a, Life Span of 5 Years, , 15, , (b) Raw Materials, (c), , 6. In an economy,, , S = −100 + 0.6 Y, is the saving function, where S is saving and Y is, National Income. If investment expenditure is, ` 1,100, calculate, (i) Equilibrium level of National Income., (ii) Consumption expenditure at equilibrium, level of National Income., , Long Answer (LA) Type Questions (5 Marks), , 7. (i) Define externalities. Give an example of, negative externality. What is its impact on, welfare?, , 6, , Sales, , 25, , (d) Net Change in Stock, , ( −) 2, , (e) Taxes on Production, , 1, , 8. Explain the precautions that are taken while, estimating national income by value added, method., Or, Explain the precautions that you will keep in, mind while estimating domestic income by, expenditure method?, , Part II Indian Economic Development, Short Answer (SA) Type Question (3 Marks), , 9. You are residing in a village. If you are asked to, advise the village panchayat, what kinds of, activities would you suggest for the, improvement of your village which would also, generate employment?, Or Categorise canals, house, schools, railways,, ships, hospitals, banks, development banks,, aerodromes, courts, power plants, transmission, lines and satellites into economic and social, infrastructure., Long Answer (LA) Type Questions (5 Marks), , 10. (i) Enumerate the areas in which Pakistan has, an edge over India., , (ii) Explain the Great Leap Forward (GLF), campaign of China initiated in 1958., , 11. ‘‘Unemployment different from, underemployment’’. Comment. Also, how is, unemployment measured in India?, Or, Explain the six systems of Indian medicine., , 12. Explain the relevance of intergenerational, equity in the definition of sustainable, development., Or, ‘‘Can we increase the effectiveness of healthcare, programmes’’. Comment., , Answers, 1. (b), 2. (b), 3. (d), 5. Marginal Propensity to Consume (MPC) = 0. 7, Or, Marginal Propensity to Save = 0.25, 6. (i) Y = ` 2, 000, (ii) C = ` 900, 7. (ii) ` 14 lakh
Page 142 :
Economics, Class 12th ( Term II ), , Practice Paper 3, , *, , (Unsolved), Time : 2 Hours, Max. Marks : 40, , Instructions, , 1. There are 12 questions in the question paper. All questions are compulsory., 2. Question no. 1-3 are Case Based MCQs. Each question carries 1 mark., 3. Question no. 4-6 and 9 are Short Answer Type Questions. Each question carries 3 marks., 4. Question no. 7-8 and 10-12 are Long Answer Type Questions. Each question carries 5 marks., 5. There is no overall choice. However, internal choices have been provided in some questions. Students have to attempt, only one of the alternatives in such question., , * As exact Blue-print and Pattern for CBSE Term II exams is not released yet. So the pattern of this, paper is designed by the author on the basis of trend of past CBSE Papers. Students are advised, not to consider the pattern of this paper as official, it is just for practice purpose., , Part I Macroeconomics, Case Based MCQs (1 × 3 = 3 Marks), , India’s wholesale inflation accelerated for the third consecutive month and firmed up to an eight-month, high of 1.48% in October, driven by manufactured items, data released by the commerce and industry, ministry showed on 16 Nov. The WPI had increased 1.32% in September, the annual rate of inflation based, on the WPI Food Index, which comprises ‘food articles’ from the primary articles group and ‘food product’, from the manufactured products group, decreased to 5.78% in October from 6.92% in September. The, government also revised the wholesale inflation for August to 0.41% from 0.16% earlier. Food inflation, cooled to 6.37% in October from 8.17% in September, led by decline in meat, egg and fish inflation that, slowed to 1.65% in October from 4.15% the previous month., Inflation in vegetables and potatoes was 25.23% and 107.70% respectively. In the manufactured products, category, inflation was 2.12% as compared to 1.61% in September., , 1. Increase in core inflation implies improvement in ……… condition after covid 19 related lockdown was, lifted., (a) demand, (c) Both (a) and (b), , (b) supply, (d) Neither (a) nor (b), , 2. Assertion (A) Inflation leads to fall in the value of money in circulation., Reason (R) Increase in money supply increases the demand for goods leading to fall in value of money., Alternatives, (a) Both Assertion (A) and Reason (R) are true and Reason (R) is the correct explanation of Assertion (A), (b) Both Assertion (A) and Reason (R) are true, but Reason (R) is not the correct explanation of Assertion (A), (c) Assertion (A) is false, but Reason (R) is true, (d) Both are false, , 3. Deflationary gap causes ……… ., (a) fall in the level of output, (c) fall in general price level, , (b) fall in the level of employment, (d) All of these
Page 143 :
132, , CBSE Term-II Economics XII, , Short Answer (SA) Type Questions (3 Marks), , 4. Giving reasons, state whether the following statements are true of false., (i) When MPC is zero, the value of investment multiplier will also be zero., (ii) Value of Average Propensity to Consume can never be less than zero., Or In an economy, C = 200 + 0.75 Y is the consumption function where C is consumption expenditure and Y is, National Income. Investment expenditure is ` 4,000. Calculate equilibrium level of income and, consumption expenditure., , 5. If National Income is ` 90 crore and consumption expenditure is ` 81 crore, find out Average Propensity, to Save. When income rises to ` 100 crore and consumption expenditure to ` 88 crore, what will be the, Marginal Propensity to Consume and Marginal Propensity to Save?, , 6. Find investment from the following, National Income = ` 600, Autonomous consumption = ` 150, Marginal Propensity to Consume = 0.70, Or If Personal Disposable Income is `1,000 crore and consumption expenditure is `750 crore, find out, Average Propensity to Save., Long Answer (LA) Type Questions (5 Marks), , 7. (i) Calculate sales from the following data, S.No., , Contents, , ` (in lakh), , (a), , Net Value Added at Factor Cost, , (b), , Depreciation, , (c), , Change in Stock, , (− )30, , (d), , Intermediate Cost, , 1,000, , (e), , Exports, , (f), , Indirect Taxes, , 560, 60, , 200, 60, , (ii) Giving reason, classify the following into intermediate products and final products., (a) Computers installed in an office., (b) Mobile sets purchased by a mobile dealer., 8. Calculate Gross National Product at Market Price by production method and income method., S.No., , Contents, , ` (in crore), , (a), , Value of Output by Primary Sector, , 1,000, , (b), , Indirect Tax, , 200, , (c), , Compensation of Employees, , 780, , (d), , Net Factor Income to Abroad, , 100, , (e), , Intermediate Purchases by all Sectors, , 2,900, , (f), , Value of Output by Secondary Sector, , 2,000, , (g), , Rent, , (h), , Subsidy, , 50, , (i), , Interest, , 600, , (j), , Consumption of Fixed Capital, , 120, , (k), , Value of Output by Tertiary Sector, , (l), , Profits, , 320, , (m), , Mixed Income of Self-employed, , 830, , 300, , 3,000
Page 144 :
133, , CBSE Term-II Economics XII, , Or, Give reason and identify whether the following are final expenditures or intermediate expenditures., (i) Expenditure on maintenance of an office building., (ii) Expenditure on improvement of machine in a factory., , Part-II Indian Economic Development, Short Answer (SA) Type Question (3 Marks), , 9. Give two instances of, (i) Overuse of environmental resources., (ii) Misuse of environmental resources., Or, You are residing in highly populated area of Mumbai. Due to over population your locality harms the, environment, suggest any four measures to your neighbours to protect environment., Long Answer (LA) Type Questions (5 Marks), , 10. Keeping in view your locality, describe any four strategies of sustainable development., Or, Explain the measures to solve unemployment problems., , 11. Write a brief note on the state of infrastructure in India in general and of rural areas in particular., Or, Explain the relationship between environment and the economic development., , 12. (i) Group the following features pertaining to the economies of India, China and Pakistan under three heads, (a), (c), (e), (g), (i), , One-child norm, High degree of urbanisation, Very high fertility rate, High density of population, Growth due to service sector, , (b), (d), (f), (h), , Low fertility rate, Mixed economy, Large population, Growth due to manufacturing sector, , (ii) How is China able to lead in all the human development indicators?, , Answers, 1. (a), 2. (a), 5. MPC = 0.70; MPS = 0.30 6. Investment = ` 30 Or APS = 0.25, , 3. (d), , 4. (Or) Y = ` 16,800; C = ` 12,800, , 7. (i) Sales = ` 1, 710 lakh 8. GNPMP = ` 3,000 crore
 Learn better on this topic