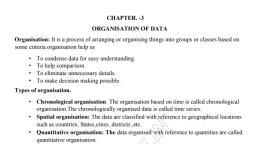
Page 1 :
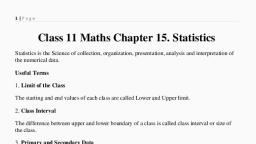
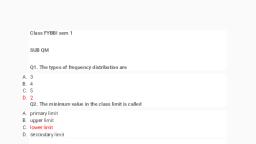
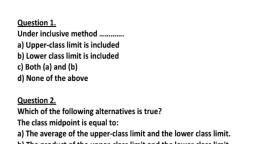
CHAPTER. -3, ORGANISATION OF DATA, Organisation: It is a process of arranging or organising things into groups or classes based on, some criteria.organisation help us, •, •, •, •, , To condense data for easy understanding., To help comparison., To eliminate unnecessary details., To make decision making possible., , Types of organisation., • Chronological organisation: The organisation based on time is called chronological, organisation.The chronologically organised data is called time series., • Spatial organisation: The data are classified with reference to geographical locations, such as countries, States,cities, districts ,etc., • Quantitative organisation: The data organised with reference to quantities are called, quantitative organisation., • Qualitative organisation:The data organised with reference to qualities are called, qualitative organisation., VARIABLES: variables are anything their values are changing. They are broadly classified, into two types., • Discrete variables: The variables which receive whole numbers as their values only, ,such variables are called discrete variables. Eg. Cricket score, family size., • Continuous variables:A continuous variable can take any numerical value. It may, take integral values, fractional values, irrational values, FREQUENCY ARRAY:The arranged form of discrete variables is called frequency array., FREQUENCY DISTRIBUTION: It is a comprehensive way to classify raw data of a, quantitative variable.while preparing a frequency distribution ,the following four questions need, to be addressed, •, •, •, •, , How many classes should we have?, What should be the size of each class?, How should we determine the class limits?, How should we get the frequency for each class?, , RANGE:It is the difference between the largest and the smallest values of variable., Range=largest value – smallest value, UPPER CLASS LIMIT:The highest value of a class is called upper class limit.
Page 2 :
LOWER CLASS LIMIT:The lowest value of a class is called lower class limit., CLASS INTERVAL:The difference between upper class limit and lower class limit is called, class interval., CLASS MARK OR CLASS MID POINT:The average of upper class limit and lower class, limit is called class mark or class mid point., INCLUSIVE AND EXCLUSIVE CLASS:Under inclusive method upper class limit of a class, included in the class interval ., Under exclusive method upper class limit of a class is excluded from the class interval., Loss of information:Statistical calculations are based only on the vaues of class mark and not, on the values of the observations in that class.so other values of the class are not considered .It, is called loss of information., UNIVARIATE AND BIVARIATE FREQUENCY DISTRIBUTION: The frequency, distribution of a single variable is called univariate frequency distribution., A Bivariate frequency distribution is the frequency distribution of two variables., STEPS REQUIRED FOR THE CONVERSION OF INCLUSIVE INTO EXCLUSIVE:, 1. Find the difference between the lower limit of the second class and the upper limit of the, first class., 2. Divide the difference obtained in by two., 3. Substract the values obtained in from lower limits of all classes., 4. Add the value obtained in to upper limits of all classes., Previous questions., 1. While preparing a frequency distribution from the raw data ,Name the questions we have, to addressed?, 2. Vipin ,a student of class X1 Classify the students of his class as follows, Height, 110-120 120-130 130-140 140-150 150-160 160-170, No.of, 5, 6, 7, 10, 13, 4, students, •, •, •, •, , Name the classification Vipin did., Tell vipin about other types of classification, What is class interval of first class? Define it?, What do you mean by class mark? Find the class mark of first and last class., , PREPARED BY, RAJESH.S
Page 3 :
K.T.C.T.E.M.H.S.S KADUVAYIL, THIRUVANANTHAPURAM