Page 1 :
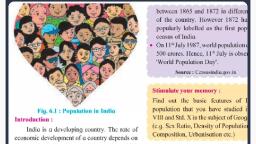
Fig. 6.1 : Population in India, Introduction :, , India is a developing country. The rate of, economic development of a country depends on, its quantitative and qualitative growth which, can be measured in terms of population, national, , inc@Me, per capita. income etc., lation refers to the number of people, , living in an area-at a given point of time., Population of India is measured nee in every, ten years through a census suruey. According, to 2011 census, India’s population was 121.02, crores. India ranks second in the world next to, China., , India has 17.5% of the world population, but it occupics only 2.4% of the world's land, area. Population stastistics are compiled and, published by the Office of the Registrar General, and Census Commissioner of India., , You should know :, , Population Facts, , ¢ Kautilya wrote ‘Arthashastra’ in the third, century B. C, It prescribed the collection of, population statistics as a measure of state, policy for taxation., , e A systematic and modern population, census in its present form was conducted, , between 1865 and 1872 in differe’, , of the country. However 1872 h, , popularly labelled as the first pop}, census of India., , On 11" July 1987, world population, , 500 crores. Hence, 11" July is obse:, ‘World Population Day’., , Source ; Censusindia.gov.in, , Stimulate your memory :, , Find out the basic features of |, population that you have studied i, VIII and Std. X in the subject of Geog, (e.g. Sex Ratio, Density of Populatio:, Composition, Urbanisation etc.), , Trends in Population Growth:, India’s population is very large i, is growing rapidly. Information rega, size, structure and other characterstics ¢, population is obtained through Census §, , Table 6.1 reviews the trends in populatio’, , Growth of Population in Indi, , , , Population | Average Annual, (In Crores) Rate (Perce, , , , 25.2 , , , 25:1 -0.03, , , , 27.9, , , , 31,9, , , , 36.1, 1961, , , , 1971, , , , 1981, , , , 1991, 2001, 2011 121.02, , , , , , , , , , , , Table 6.1 Source : Census of Indij
Page 2 :
1) Marginal Decline in population (19111921) : There was a marginal decline in, population from 25.2 crores in 1911 to 25.1, crores in 1921. Thus, there was negative, growth rate due to spread of epidemics such, as influenza, cholera, plague, malaria etc., , 2) Year of Great Divide :/The decadal, growth of population was ni during, the period 1911 to 1921. After 1921, there, was a continuous increase in population., Hence, then Census Commissioner of India, had designated the year 1921 as the 'Year, of Great Divid&,, , 3) Positive rate (1931-1941) : India, recorded an annual growth rate around | to, 1.3% during this period., , 4) Increase in population (1951 onwards) :, Between 1951 to 1971 population increased, from 36.1 crores to 54.8 crores. This, shows that after Independence, there was, tremendous rise in population., , , , , , , jon’ because duritigy these, , innual population growth rate, , m 2%., , 6) Slow down in growth rate, (2001-2011) :f[Rere is an indication of, slow down in growth rate of population, from 1.9% in 2001 to 1.4% in 2011. This, , shows that the average annual growth rate, is declini, , Theories of Population Growth :, , Ch a a 7S ee ee. eon ee tt pene Oe Oe ee a
Page 3 :
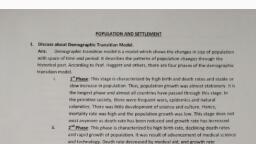
Fea TN eR ee me rae aT TN eee eee Le ee ee, , Concepts related to population growth :, 1) Birth rate : Birth rate means the number, f births occurring per thousand of the, living population during a year. It is also, known as fertility rate ., 2) Death rate : The number of deaths per, thousand of the living population during, a year is called death rate, It is also called, mortality rate., , 3) rate : The difference between, the birth rate and death is known as, the survi s § s the actual, , s\esrr, , —_ ival rate = Birth rate — Death rate., , , , , , , 2) Theory of Demographic Transition§; The, theory of demographic transition was“fiven, by A. J. Coale and E. M. Hoover, in the book,, , "Population growth and Economi@Qevelopment, in low-income countries" (1958, , According to this theory, every country, passes through three stages of demographic, , transition. This theory explains the transition, from high to low birth rates and death rates., , S of Demographic Transition :, , The theory shows a three stage relationship, between economic development and population, growth. According to this theory, as a country, adva economically, its population passes, through three stages as follows :
Page 4 :
w v, , A) Hirst stage (Low growth of population) :, IIs pre-industrialised and primitive stage., The birth rate and death rate both are, very high. All underdeveloped countries
Page 5 :
have passed through this stage. Social and, economic conditions such as mass illiteracy,, superstitions, mass poverty, orthodoxy, lack, of medical facilities, spread of epidemics, etc. led to low growth of population.), Before 1921, India was in the first stage of, demographic transition., , B) Second stage (High growth of population) :, Introduction of industrialisation and, beginning of the process of economic, development is the indicator of the second, stage. Due to economic development death, rate started falling rapidly, but the birth, rate continued to remain high. This led, to population eno All developing, countries, including Infia are in the second, stage of demographic transition. India is on, the verge of entering into the third stage., , C(Third stage (Low or Stable population) :, , apid industrialisation and urbanisation,, result in the spread of education and, consciousness about standard of living., With economic development, both birth rate, as well as death rate tend to decline, All, , developed countries are in this stage}