Page 1 :
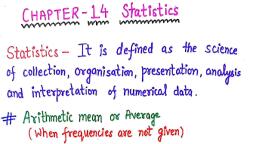
Sub:- Mathematics, Name :Topic: - 13. Statistics, School:Sub topic: - 13.1, Activity 1:-Answer the following questions, 1) A collection of numerical facts with particular information is called ------------Consider the marks scored by 20 students in mathematics in 10th standard mid, term examination, 56’ 31, 44, 78, 67, 74, 38, 60, 56, 59, 87, 73, 38, 77, 84, 80, 49, 60, 650, 71, The above data is a collection numerical entries . it is called oservation . Such, collection is called raw-data, The data can be arranged in ascending or descending order, 2) Arrange the above data in ascending or descending order, 3) What is the highest score:4) What is the lowest score:5) The difference between the highest score and the lowest score is called, ……………….., 6)The range of above data is, 7) Statistics :- is a branch of mathematics which deals with collection, analysis,, interpretation and representation of data, The word “ Statistics” appears to have been derived from Latin word ‘Status’, Applications of Statistics :Statistics is useful, in drawing conclusion from numerical data., To predict weather, To obtain information concerning business, import, export, education etc, Many research an d investigations require statistical interpretation, 8) How many times the number 38 is repeated :9) the number of times a particular observation (Score ) occurs in a data is called its ……………., 10) Frequency of 38 is ………….., 11) Frequency of 60 is ………….., 12) Frequency of rest of the score is ………….., 13) Frequency distribution table :- The representation of data in tabular form, showing the, frequency of each distribution is called Frequency distribution table, 14 ) Tallies are used to mark counts, 15), II---------Represents, IIII---------Represents, --------Represents, , 10.1.13. STATISTICS, , NISHANA-9141528128, , Page 1
Page 2 :
Marks, , Tally Marks, , No. Of students ( Frequency ), , Total, , Groups, , Tally Marks, , No. of students ( Frequency ), , Total, , Class interval or a class :- The groups in a frequency distribution table is called Class interval, or a class, Note :- * In above table no score is overlaps ( 0-9, 10-19), * The method of grouping the data in which no score is overlaps is Inclusive method, , Class Limit: In the class interval, say (10 - 19), 9.5 is called the lower class limit and, 19.5 is called the upper class limit., Class Size: The number of scores in the class interval say, (10-19), including 10 and 19, is, called the class size or width of the class., In above example, the class size is 10., Class Mark: The midpoint of a class is called its class mark (or midpoint of class interval). It is, obtained by adding the two limits and dividing by 2., 10.1.13. STATISTICS, , NISHANA-9141528128, , Page 2
Page 3 :
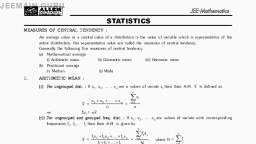
For example,, , the class mark of (10-19) is, , (, , ), , = 14.5., , The class mark of (10-20) is, =, 1. The marks scored by 40 candidates in an examination (out of 100) is given below:, 75, 65, 57, 50, 32, 54, 75, 67, 75, 88, 80, 42, 40, 41, 34, 78, 43, 61, 42, 46, 68, 52, 43, 49, 59,, 49, 67, 34, 33, 87, 97, 47, 46, 54, 48, 45, 51, 47, 41, 43., C.I, , Tallies, , Frequency ( f), , Prepare a frequency distribution table with the class size 10., Take the class intervals as (30-39), (40-49), ... and answer the following questions:, (i), Which class intervals have highest and lowest frequency?, (ii), , Write the upper and lower limits of the class interval 30-39, , (iii), , What is the range of the given distribution?, Measures of central tendencies, , Mean, Median, Mode, They give a clear picture of the behaviour of an experiment., They are generally called measures of central tendencies., Mean:- Mean is commonly used as a measure, in a given statistical experiment, to get an idea, how the experiment is behaving., This is simply the average of the numerical data collected during an experiment., Mean for an un-grouped data:, It is the sum of the numerical values of all the observations divided by the total number of, observations. If x1, x2, x3, . . . , xN are the values of N observations, then, , Mean =, , (, , ), (, , Mean =, , ), ···, , Note:, Sum is denoted by Σ and read as sigma., Mean is denoted by This is read as x bar, 10.1.13. STATISTICS, , NISHANA-9141528128, , Page 3
Page 4 :
Example :- Marks scored by Hari in 5 tests (out of 25 marks) are given: 24, 22, 23, 23, 25. Find, his average score., Mode: There is another measure of central tendency which is used occasionally, called mode, Mode is the score that occurs frequently in a given set of scores., Mode is the value around which the other scores cluster around densely., A collection of data can have more than one mode., If the data has only one mode, we say it has uni-mode,, If it has 2 modes, we say it has bi-mode and, If it has more than 2 modes, we say it has multi-mode, Example 1. Find the mode for the data: 15, 20, 22, 25, 30, 20, 15, 20, 12, 20., , 10.1.13. STATISTICS, , NISHANA-9141528128, , Page 4
Page 5 :
Mean of Grouped Data, Direct Method, , Assumed mean method, , Step deviation method, , 1)Find the sum of frequencies fi, , 1)Find the sum of frequencies fi 1)Find the sum of frequencies fi, , 2)Find Class mark (xi ) for each C.I, , 2)Find Class mark (xi ) for each C.I, , 2)Find Class mark (xi ) for each C.I, , xi =, , xi =, , xi =, , 3) Choose one among the xi’s as 3) Choose one among the xi’s as, 3) Find the product of fi xifor each C.I the assumed mean ‘ a ‘ (which lies the assumed mean ‘ a ‘ (which lies in, 4) Find fi xi, , 5)Find mean, , using formula, , in the centre of x1, x2, . . ., xn), 4) find the difference di between a, and each of the xi’s, (deviation of ‘a’, from each of the xi’s.), i.e., di = xi – a, 5)Find the product fidi for each CI, 6) Find fi di, , the centre of x1, x2, . . ., xn), 4) find the difference di between a and, each of the xi’s, (deviation of ‘a’ from, each of the xi’s.), i.e., di = xi – a, 5)Divide di by class size h for each CI, and call it as ui, i.e, , 7)Find mean, , using formula, , ui =, , –, , 6) Find the product fiui for each CI, 7) Find fiui, , 7)Find mean, , 10.1.13. STATISTICS, , NISHANA-9141528128, , using formula, , Page 5
Page 6 :
Mean of Grouped Data by Direct method, If X1, X2, . . . . , Xn are observations with respective frequencies f1, f2, . . . , fn, then this, means observation X1 occurs f1 times, X2 occurs f2 times, and so on., Now, the sum of the values of all the observations = f1X1 + f2x2 + . . . + fnXn, and, the number of observations = f1 + f2 + . . . + fn., So, the mean x of the data is given by, , more briefly, is written as, , 1/WE): The marks obtained by 30 students of Class X of a certain school in a Mathematics, paper consisting of 100 marks are presented in table below. Find the mean of the marks, obtained by the students ( Direct method when Class Interval is not given ), , Marks, obtained (Xi ), , Number of, students ( fi ), , fiXi, , Total, , 10.1.13. STATISTICS, , NISHANA-9141528128, , Page 6
Page 7 :
( Direct method when Class Interval is given), 2) 1/AP ) convert the ungrouped data of Example 1 into grouped data by forming class, intervals of width 15. Find the mean of the given data by direct mean method, , Class interval, , ( C.I ), , Number of Class mark, students ( fi ), (xi ), , Total, , fi =, , fi xi, , fi xi =, , Limitations of direct method, Finding the product of xi and fi and fi becomes tedious, This method consumes lot of time, Finding of Mean of Grouped Data by Assumed Mean Method., 3) 2/AP ) convert the ungrouped data of Example 1 into grouped data by forming class, intervals of width 15. Find the mean of the given data by assumed mean method, , ( C.I ), , Number of Class mark, students ( fi ), (xi ), , di = xi – a, ( di = xi – 47.5 ), , Total, , fi =, , fi di =, , Class interval, , 10.1.13. STATISTICS, , NISHANA-9141528128, , fi di, , Page 7
Page 8 :
Find the relation between mean of the deviations and mean, ̅, Let be the mean of the deviations and ̅ be the mean of the given grouped data, ̅ =, We know that, the mean of the deviations ,, , , ̅= ( − ), , , ̅= ., , -, , , , , , , ̅= ̅ - , ̅= ̅ -, , ( where d= xi –a ), , ( where ̅ =, , , , , , ., , , ), , ̅= ̅ -a, ̅= a+ ̅, ̅= a+, , , , , Finding of Mean of Grouped Data by Step deviation Method., 3) 2/AP ) convert the ungrouped data of Example 1 into grouped data by forming class, intervals of width 15. Find the mean of the given data by Step deviation Method, , Class interval, ( C.I ), , Total, , 10.1.13. STATISTICS, , Number of, students ( fi ), , Class mark, (xi ), , di = xi – a, ( di = xi – 47.5, ), , fi =, , ui =, , –, , fi ui =, , NISHANA-9141528128, , fi ui, , , , Page 8
Page 9 :
Find the relation between mean of the deviations and mean, Let ̅ be the mean of the given grouped data be the assumed mean and h is the class size ., We know that, , −, , u i=, =, , ( where d= xi –a ), , , , = [, = [, , ( − ), , , , , , − , , , , , , -a, , , , , ], ], , = [ ̅ - a], h = ̅ -a, ̅ = a +h, ̅ = a +h[, , , , , The step-deviation method will be convenient to apply if all the di’s have a common factor., The mean obtained by all the three methods is the same., The assumed mean method and step-deviation method are just simplified forms of the direct, method., The formula ̅ =a +h, still holds if a and h are not as given above, but are any non-zero, , , , numbers such that, , =, , [xi-a], , Example 2 : The table below gives the percentage distribution of female teachers in the, primary schools of rural areas of various states and union territories (U.T.) of India. Find the, mean percentage of female teachers by all the three methods discussed in this section., Percentage of female, 15 - 25 25 - 35 35 - 45 45 - 55 55 - 65 65 - 75 75 - 85, teachers, , Number of States/U.T., Sol, Percentage Number of, of female States/U.T., teachers, , 6, xi, , 11, , di = xi –a, di = xi – 50, , 7, u i=, , −, , u i=, , −, , 4, , 4, fi xi, , 2, fi di, , 1, fi ui, , 15-25, 25-35, 35-45, 45-55, 55-65, 65-75, 75-85, , 10.1.13. STATISTICS, , NISHANA-9141528128, , Page 9
Page 10 :
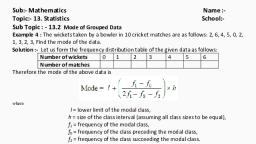
Remark :, The result obtained by all the three methods is the same. So the choice of method to be used depends, on the numerical values of xi and fi., If xi and fi are sufficiently small, then the direct method is an appropriate choice., If xi and fi are numerically large numbers, then we can go for the assumed mean method or stepdeviation method., If the class sizes are unequal, and xi are large numerically, we can still apply the step-deviation method, by taking h to be a suitable divisor of all the di’s., , Example 3 : The distribution below shows the number of wickets taken by bowlers in one-day, cricket matches. Find the mean number of wickets by choosing a suitable method. What does, the mean signify ?, Number of wickets 20 - 60 60 - 100 100 - 150 150 - 250 250 - 350 350 - 450, Number of bowlers, 7, 5, 16, 12, 2, 3, Sol:-, , 10.1.13. STATISTICS, , NISHANA-9141528128, , Page 10
Page 11 :
Exercise 13.1, 1. A survey was coducted by a group of students as a part of their environment awareness, program , in which they collected the following data regarding the number of plants in 20, houses in a locality. Find the mean number of plants per house., Number of plants, 0-2, 2-4, 4-6, 6-8, 8 - 10, 10 - 12, 12-14, Number of houses, 1, 2, 1, 5, 6, 2, 3, , 10.1.13. STATISTICS, , NISHANA-9141528128, , Page 11
Page 12 :
2)Consider the following distribution of daily wages of 50 workers of a factory., Daily wages, 500 - 520 520 -540, 540 - 560, 560 - 580, 580 -600, Number of workers, 12, 14, 8, 6, 10, Find the mean daily wages of the workers of the factory by using an appropriate method., , 3. The following distribution shows the daily pocket allowance of children of a locality., The mean pocket allowance is ` 18. Find the missing frequency f., Daily pocket allowance 11 - 13 13 - 15 15 - 17 17 - 19 19 - 21 21 - 23 23 - 25, Number of children, 7, 6, 9, 13, f, 5, 4, Sol:-, , 10.1.13. STATISTICS, , NISHANA-9141528128, , Page 12
Page 13 :
4. Thirty women were examined in a hospital by a doctor and the number of heartbeats per, minute were recorded and summarised as follows. Find the mean heartbeats per minute for, these women, choosing a suitable method, , 10.1.13. STATISTICS, , NISHANA-9141528128, , Page 13
Page 14 :
5. In a retail market, fruit vendors were selling mangoes kept in packing boxes. These boxes, contained varying number of mangoes. The following was the distribution of mangoes, according to the number of boxes., , 6) The table below shows the daily expenditure on food of 25 households in a locality. Find the, mean daily expenditure on food by a suitable method, , 10.1.13. STATISTICS, , NISHANA-9141528128, , Page 14
Page 15 :
7. To find out the concentration of SO2 in Concentration Of SO2(in ppm), the air (in parts per million, i.e., ppm), the, 0.00-0.04, data was collected for 30 localities in a, 0.04-0.08, certain city and is presented below: Find, 0.08-0.12, the mean concentration of SO2 in the air., 0.12-0.16, 0.16-020, 0.20-0.24, , Frequency, 4, 9, 9, 2, 4, 2, , 8. A class teacher has the following absentee record of 40 students of a class for the whole, term. Find the mean number of days a student was absent., , 10.1.13. STATISTICS, , NISHANA-9141528128, , Page 15
Page 16 :
9. The following table gives the literacy rate (in percentage) of 35 cities. Find the mean literacy, rate., , 10.1.13. STATISTICS, , NISHANA-9141528128, , Page 16