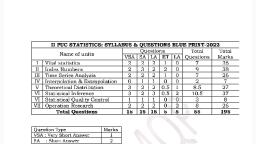
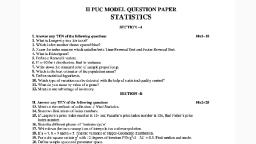
Page 1 :
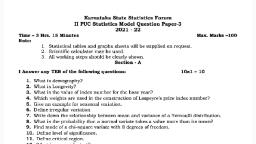
II PUC MODEL QUESTION PAPER, STATISTICS, , SECTION -A, , L. Answer any TEN of the following questions 10x1=10, 1. What is Longevity in a life table?, 2. Which index number shows upward bias?, 3. Name the index number which satisfies both Time Reversal Test and Factor Reversal Test., 4, What is Historigram?, 5. Define a Bernoulli variate., 6. [f n=10 for t-distribution, find its variance., 7. Write down the standard error of sample proportion p., 8. Which is the best estimator of the population mean?, 9. Define statistical hypothesis., 10. Which type of variation can be detected with the help of statistical quality control?, 11. What do you mean by value of a game?, 12. Mention one advantage of inventory., SECTION-B, , IL. Answer any TEN of the following questions 10x2=20, 13. Mention the methods of collection of Vital Statistics., 14. State two limitations of index numbers., 15. If Laspeyre’s price index number is 124 and Paasche’s price index number is 126, find Fisher's price, index number., 16. State the different phases of ‘business cycle’, 17. Write down the two assumptions of interpolation and extrapolation., 18. Ifa=7, b=9 and n= §, find the variance of Hyper-Geometric distribution., 19. For a chi-square variate y° with 12 degrees of freedom P[0<y"<I 1.34] = 0.5. Find median and mode., 20. Define sample space and parameter space., 21. What do you mean by a) Critical region b) Power of a test ?, 22. Mention two disadvantages of acceptance sampling plan., 23, Ina ‘two-person zero-sum game” the pay-off matrix of player A is given below:, Player B, Bl B2 B3, Al 3 3 4, PlayerA A2/2 3° -2, A3 [4 5 6, Write down the pay-off matrix of player B., , 24, State the conditions under which EOQ without shortages is applied., , , , , , , , , , , , SECTION -C, II. Answer any EIGHT of the following questions 8x5 =40, 25. Calculate gross reproduction rate for the following data., ‘Age group 15-19 | 20-24 | 25-29 | 30-34 | 35.39 | 40-44 | 45-49, Female population | 1900 | 900 | 800 | 700 | 600 500 400, Female births 20 60 so | 30 20 10 10, , , , , , , , , , , , , , , , 26. Define Index number. Mention four uses of index number., 27. Calculate cost of living index number for 2010 with base 2005., , , , , , , , , , , , Item Food | Clothing | House rent | Fuel Miscellaneous, Budget 30% 10% 20% 15% 25%, Price in 2005 225 70 180 60 125, Price in 2010 250 90 240 80 175,, , , , , , , , , , 28. Compute 5 yearly moving averages for the data given below., Year | 2000 | 2001 | 2002 | 2003 2004 2005 2006 2007 2008, value | 36 40 | 42 38 49 52 45 55 62, 29, In the following table the values of X represents the degrees of freedom and the Y values represents, chi- square critical values at 5% level of significance. Find the missing values by using binomial, expansion method., x 2 3 4 5 6 7 8, ¥ 5.99 | 7.81 [949] - | 1259 | 1407 | 30. Ina college, 70% of the students are boys. In a random sample of 5 students find the probability of getting, a)4boys —b) at the most 2 boys, , 31. Write down 5 properties of normal distribution., 32. A sample of 50 children is taken from a school. The average weight of the children is 28Kg and S.D. is, 5Kg. Test at 1% level of significance , whether the average weight of the school children is less than 30Kg., 33. From the following data , test whether literacy and smoking are independent at 5% level of significance., , , , , , , , , , , , , , , , , , , , , , , , , , , , , , , , , , , , , , , , , , , , , , , , , , , , , , , , , , Non smokers smokers, Literates 20. 18, Illiterates 15 25, , , , , , , , , , , , P.T.O., , Scanned with CamScanner
Page 2 :
34, Following table gives mean (¥) and range (R) of 6 samples of size 4 each., , , , , , , , Sample No. 1 2 3 4 5 6, x 10 114 9 13 17.2 18.6, R a 7 4 9 8 6, , , , , , , , , , , , , , , , , , , , Find the control limits for drawing X - chart., 35. Solve the following L.P.P. graphically., Minimize Z = 5x + 8y, Subject to 3x+2y < 18, 4x+3y > 12, And x>0,y>0, 36. Find an initial basic feasible solution by matrix minima method for the following transportation problem, and also find the total cost associated with the basic feasible solution., , , , , , , , , , , , , , , , , , , , , , , , , , , , , , , , , , , , , , , , , , , , , , , , , , , , , , , , , , , , , , , , A | B | C_ | Supply, , I 19 20 45 40, , IL 26 18 24 48, , i 2 | 3l | 14 24, , Demand 56 44 12 112, , SECTION -D, , IV. Answer any TWO of the following questions. 10x2=20, 37. Compute standardized death rates for village A and village B. State which village is healthier?, , Age (years) | Standard Village A Village B, , population [Population | Deaths | Population | Deaths, , 0-20 20000 8000 128 4000 72, , 20-50 30000 13000 65 9000 34, , 50-70 35000 10000, 140 7000 OR, , 70&above 15000 4400 252 3000 129, 38. Construct Marshall-Edgeworth, Fisher’s and Dorbish- Bowley’s price index numbers., , Ttem Base year Current year, , Price | Quantity [Price | Quantity, , A 30. 40 50 45, , B 25 20 35 25, , Cc 35 30 45 30, , D 40 50 50 60, , E 45 10 55 15, , , , , , , , , , , , , , 39. Fit an exponential trend of the form Y=ab*. Also estimate the value for 2008., Year 2000 | 2001 | 2002 | 2803 | 2804 | 2005 2006, value 4 6 10 18 22 25 30, , , , , , , , , , , , , , , , , , , , , , , , 40. Fit a Poisson distribution to the following data and test for goodness of fit at 5% level of significance., , , , , , , , , , , , , , , , , , , , , , , , No. of mistakes 0 1 2 3 4 Sand more, No. of pages 31 | 34 21 2 [2 0, SECTION -E, V. Answer any TWO of the following questions. 5x2=10, , 41. The daily wages of workers of a factory are normally distributed with mean Rs. 700 and S.D. Rs. 40. Find, the probability of workers whose daily wages will be, a) more than Rs. 800 b) Between Rs. 690 and Rs.720 ., , 42. For the following data test whether there is any significant difference in the population proportions at 5%, level of significance., , , , , , , , , , , , , , , , , , , , Size__| Proportion, Sample I 100 0.02, Sample II 0 0.01, , 43. The marks scored by 9 students in tests conducted before coaching and after coaching arc as follows., ‘Marks before coaching 37 | 76 | 54 | 43 | 84 | 53 | 67 | 13 | 35, Marks after coaching 4g | s2 | 71 | 56 | 89 | 58 | 63 | 17 | 30, , , , , , , , , , , , , , , , , , , , , , Test whether coaching is effective?, 44, A firm is considering of replacing certain equipment whose purchase cost is Rs. 5000. Suggest a suitable, period to replace the equipment., , , , , , , , , , , , Years 1 2 3 4 5 6 7 8, Running cost (Rs.) 1500 1600 1800 2100 2500 2900 3400 4000, Resale value (Rs.) 3500 2500 1700 1200 800 500 500 500, , , , , , , , , , , , , , , , , , , , , , ST. JOSEPH'S P.! U. COLLEGE, BAJPE., , , , Scanned with CamScanner
Page 3 :
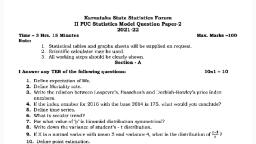
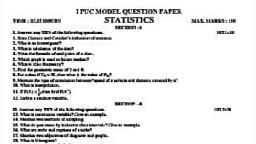
Il PUC ANNUAL EXAMINATION — MARCH 2015, STATISTICS, , SECTION -A, I. Answer any TEN of the following questions. 10X1=10, Define expectation of life., If the general price level goes up by 80% between 2000 and 2012. What is the index number for 2012 with base 2000?, Name the index number which satisfies circular test, Which index is used for the measurement of seasonal variation?, If p=+for a Bernoulli distribution, write down the p.m., What is the probability that a normal variate takes a value greater than its mean?, Define sampling distribution of a statistic., What is power of a test?, If p=0.02 and n=64 then find S.E.(p), 10. Define acceptance sampling., 11, What is meant by lead time?, 12. Whena T.P. is balanced?, , Sena eee, , SECTION -B, , IL. Answer any TEN of the following questions. 10X2=20, , 13. Ina locality 10000 live births occurred. The number of infant deaths was 500. Calculate infant mortality rate., , 14. State two characteristics of index numbers., , 15. Quantity index number for current year is 250. If the number of units produced in the current year is 120 then find the, number of units produced in the base year., , 16. Diagrammatically represent ‘business cycle’ with stages., , 17. Define ‘interpolation and extrapolation’,, , 18. For a hyper-geometric distribution the parameters are a=7, b=5 and n=8. Find the variance., , 19. If Z; and Z» are two independent S.N.V.s, then name the distribution of Z,>+ Zs’ and find its mean., , 20. Write two applications of t-test., , 21. Mention two conditions for applicability of chi-square test of goodness of fit., , 22. Ina floor mat manufacturing company, the average number of defects per square meter of floor mat is known to be 4., Find the upper control limit for the number of defects., , 23. Under what conditions is E.0.Q. model with shortages applicable?, , 2A. From the following TP. test whether the solution is non-degenerate?, , , , , , , , , , , , , , , , , , , , , , , , , , , , , , , , , , ol 2 2 [el s, o2| [=I 5, ©3| peo], 4 SECTION - C, III. Answer any EIGHT of the following questions. 8X5=40, 25. Compute the gross reproduction rate from the following data., ‘Age group | Female population | Female births, 15-19 1658 19, 20-24 1212 70, 25-29 1690 98, 30-34 1620 65, 35-39 1600 40, 4044 1520 iL, 45-49 1410 1, , , , 26. Briefly explain TRT and FRT., 27. Compute cost of living index number by using the following data., , , , , , , , , , , , , , , , , , , , , , , , , , , , , , , , , , , , , , , , , , , , , , , , , , Prices in Rupees, , Items Weight [~ Base Year | Current Year, , Food 10 400 500, , House rent 5 160 240, , Clothing 3 80 100, , Fuel & lighting 4 100 140, , ‘Miscellaneous 5 160 200, 28, Compute trend values by using 4-yearly moving averages., , Year 2000 | 2001 | 2002 | 2003 | 2004 | 2005 | 2006 | 2007 | 2008 | 2009, , Sales (000) | 70 [85 75 70 70 65 60 55 a) 15, 29, Interpolate and extrapolate the production for the year2406 and 2010 for the following data., , ‘Year 2005 | 2806 | 2007 | 2008 | 2009 | 2010, , Production (in tons) 5 10 15 26 , , , , , , , , , , , , , , , , , 30. In a certain school 40% of the students have opted for first language kannada. Assuming 20 teachers take a sample of 4, students each, how many teachers will report that 2 or 3 students have opted for first language kannada?, , 3, , 1, , there be at the most two mistakes?, 32. A random sample of 400 tins of vanaspathi has mean weight 4.96kg and S.D. 0.4 kg. Test at 1% L.O.S. that the average, weight of tins of vanaspati is less than Skg., 33, Following is the data regarding LQ. of five students before and after performing yoga., LQ. before 125 | 115 | 116 | 120 | 118, LQ. after 130 | 120 | 125 | 118 | 125, Is training effective? (Use 5% L.O.S.), , , , , , , , , , , , , , , , , , , , , , P.T.O., , Scanned with CamScanner, , . In a text book, on an average 0.3 mistakes per page is found. If there are 500 pages in that text book, in how many pages will
Page 4 :
34, For the following data find out the control limits for ¥- chart. (Given A2= 0.577), 35. Graphically solve the given L.P-P., Maximize z = 12x + 40y, S.to 3x+3y <12, 6xt3y<18 andxy>0., 36.the following are the maintenance and depreciation costs per year of a vehicle whose purchase price is Rs.50,000., Years 1 2 3 4 5 6, Depreciation cost (Rs.) | 20000 | 35000 | 42500 | 46250 | 48000 | 42000 | 48000, Maintenance cost (Rs.) | 5000 | 6000 | 7000 | 9000 | 11500 | 16000 | 18500, When should the vehicle be replaced?, , , , , , , , , , , , , , , , , , , , , , , , , , , , , , , , , , , , , , , , , , , , , , , , , , , , , , , , , , , , , , , , , , , , SECTION-D, IV. Answer any TWO of the following questions. 2X10=20, 37. For the following two towns compute standardizes death rates and comment., ‘Age group Standard Town-A Town-B, (Years) Population | Population | Deaths | Population | Deaths, 0-20 20000 8000 128 4000 2, 20-50 30000 13000 65 9000 54, 40-70 35000 10000 140 7000 98, 70& above 15000 4000 252 3000 129, 38, Compute Marshall- Edgeworth’s and Dorbish-Bowley’s price index numbers from the following data., 2006 2010, Item Price (Rs.) | Quantity | Price (Rs.) | Quantity, A 8 50 10 60, B 4 80 5 100, c 6 70 6 60, D 5 30 7 50, 39, Population figures for a city are given below., Year 2008 2009 2010 2011 2012, Population (‘000) 132 142 157 170 191, , , , , , , , , , , , , , , , Fit a curve of the type Y=ab" and estimate the population for the year 2014., , 40. Five unbiased coins are tossed 128 times and the frequencies of number of heads are noted below. Fit a Binomial, Distribution. Test at 5% L.O.S. thatit is a good fit., , , , , , , , , , , , , , , , , , , , , , , , No.of heads 0 1 2 3 4 2, No.of tosses 6 | 13 | 2 | 22 21 13, SECTION - E, V. Answer any TWO of the following questions. 2X5=10, , 41. The weights of 1000 students are normally distributed with mean 55 kg and S.D. 3 kg. Find the number of students with, , weight between 57 kg and 60 kg., , 42. A random sample of 100 people from a city in the year 2011 revealed that 65 were cricket match viewers. Another random, sample of 100 people from same city in the year 2013 revealed that 75 were cricket match viewers. Examine whether there, is a significant increase in proportion of cricket match viewership at 1% level of significance., , 43. From the following data, test whether ‘education’ and ‘employment’ are independent at 5% level of significance., , , , , , , , , , , , Employment, Education Employed | Unemployed, Educated 30 28, Un- Educated 25 35,, , , , , , , , , , 44. Obtain the value of the game and mention the best strategies of the players., Player -B, B1 B2 B3 B4, , All 1 2 o 3, Player-A A2| 4 6 3 5, A3| 3 1 2 0, , HAR AAAS LEAAAS AA RAAR ERAS AE AA ALARA ES EAEG SAAS BARAT BAAD EATS,, , ST. JOSEPH’S P.U. COLLEGE, BAJPE., , Scanned with CamScanner
Page 5 :
II PUC SUPPLEMENTARY EXAMINATION — JUNE 2015, STATISTICS, , SECTION -A, , I. Answer any TEN of the following questions. 10X1=10, . Define cohort., , What is the index number for the base year?, . Which index number shows upward bias?, . Give an example for random variation., . Write down the relationship between mean and variance of a Bernoulli distribution., . For a chi-square variate with 10 d.f., find the variance., . What is parameter space?, , Given c* = 16cm’ and n=49, calculate standard error of sample mean., |. What is type I error?, 10. Statistical quality control helps in detecting which type of variation?, 11. What do you mean by a non-degenerate solution in a transportation problem?, 12. Write down one advantage of inventory., , SONA ewe, , SECTION -B, IL. Answer any TEN of the following questions. 10X2=20, 13. Ina locality out of 20000 births 100 mothers died due to child birth complications. Calculate maternal mortality rate., 14. If Spoq = 1200 and Ypiq = 1500, compute suitable index number., 15. Mention the steps involved in the construction of consumer price index number., 16. Write down the normal equations for fitting linear trend., 17. Write down the conditions for the application of binomial expansion method of interpolation and extrapolation., 18. Write down the Bernoulli distribution with parameter p=0.25., 19. Mention two features of a student's t-distribution., 20. What are point estimation and interval estimation?, 21. Write down two utilities of standard error., 22. What do you mean by process control and product control in statistical quality control?, 23. Mention two method of obtaining initial basic feasible solution for a transportation problem?, 24, Given R=100 units/month, C3 = Rs.350 and C, = Rs. 0.20/unit/month , Find Q*, , , , SECTION-C, ILL. Answer any EIGHT of the following questions. 8X5=40, 25, From the following data calculate GFR, ASFR(20-24) and ASFR(30-39)., , , , , , , , , , , , , , , , , , Age (Years) Female population _| Number of live births, , 15-19 5000 100, 20-24 6000 700, 25-29 4500 800, 30-35 2500 100, 35-39 2500 100, 40-44 2000 50, 45-49 1000 0, , , , , , , , 26. Define Index number. Mention three limitations of index numbers., 27. Compute cost of living index number., , , , , , , , , , , , , , , , , , , , , , , , , , , , , , , , , , , , , , , , , , , , , , , , Group Price (in Rs.) Weight, Base year | Current year, Food 130 170 65, Clothing 50 60 20, Fuel 90 0 20, Entertainment 30 50. 15, Medicine & education 40 70 10, Other 50 90 15, 28. Compute the trend values by finding five yearly moving averages for the following data., Year 2000 | 2001 | 2002 | 2003 | 2004 | 2005 | 2006 | 2007 | 2008, Value 10 12 g 10 16 12 14 10 a, 29. Using Newion’s forward difference method find the value of "y’ when x = 25., x 1S 19 23 27 31, y 17 18 2 28 35, , , , , , , , , , , , , , 30. The probability that a bomb hits the target is, , @ 3 bombs hit the target. (ii) at the most two bombs hit the target., 31. Ina Hyper-geometric distribution if a=4, b=6 and n=4, find mean and variance., 32. From the following data test whether mean daily wages of workers of Factory-A and Factory —B are equal.( Use 1% L.O.S.), , , , ‘ive bombs are aimed at the target., , , , ind the probability that:, , , , , , , , , , , , , , , , , , , , , , Factory _| No. of workers | Mean daily wages(Rs.) S.D. (Rs.), A 200 195 20, B 450 200 30, 33. From the following data, test whether literacy and smoking are independent at 5% level of significance., Smokers Non-smokers, Literates 18 20, Iliterates 25 5, , , , , , , , , , P.T.O., , Scanned with CamScanner