Page 1 :
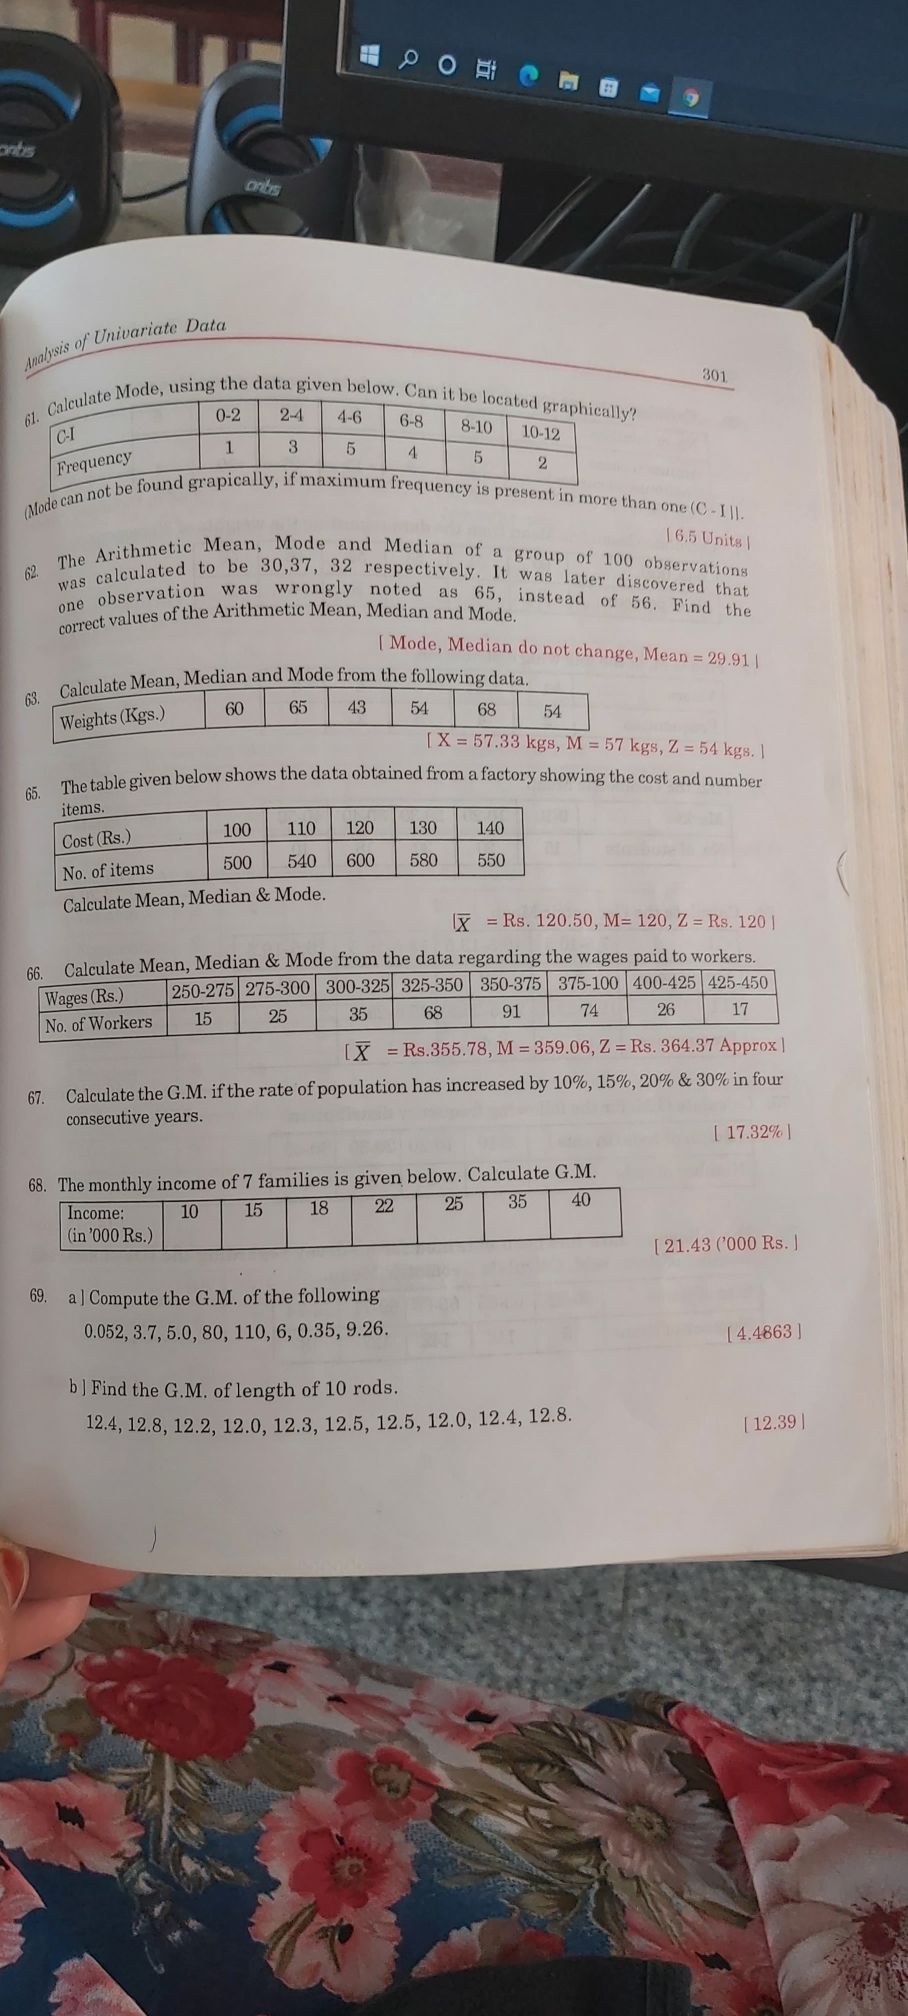
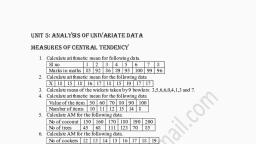
of univariate Data, of, , ne, , ; te Mode, using the data given below, ¢ 401, , , , , , saleula %, calcu! = it be located ra, , , , raphically?, , =~ | 810 | 10-19, 2, , , , 6, , , , , , , , , , , , , , , , ue, , , , , , , , , , , , , pe found grapically, ifmaximum frequen, pean not quency is prese, aod nL in more than or, an one (Q-{\, “ithmetic Mean, Mode and Medic 6h, » the An Sh See sdian of a group ¢, @ was calculated to be 30,87, 32 respectively, 1 See 100 observation, wip observation Was wrongly noted as 65, instegl of ecovered that, es of the Arithmetic Mean, Median and Mode of 56. Bind the, , foxrect val!, {| Mode, Median do not change, , Mean, Median and Mode from the following data,, , , , , , , , , , , , , , , , , , , , , , , , , , , , , , , , , , , , , , , , , , , , , , fs, Caleulat, {weights (Ses) wo | # [3 | | os | x |, [X= 57.33 kgs, M=57 kgs, 7, 5, Thetablegiven below shows the data obtained from a factory showing the a Ee uniter, items., [ cost Rs.) 100 | 110 | 120 | 130 | 140, No. of items 500 | 540 | 600 | 580 550., Calculate Mean, Median & Mode., (x =Rs. 120.50, M= 120, 2 :, gg, Caleulate Mean, Median & Mode from the data regarding the wages paid to workers, TWages(Ra) | 250-275] 275-300] 300-825) 325-350 350-375 | 375-100 | 400-425 | 425-450 |, No. of Workers 15 25 35, 68 91 4 6 nm |, , , , , , , , , , , , , , , , , , , , , , 59.06, Z = Rs. 364.37 Appr, , [X =Rs.355.78, M=, , , , 67. Calculate the G.M. ifthe rate of population has increased by 10%, 15%, 20% & 30% in four, , consecutive years., , , , , , , , , , , , , , , , , , , , , , , , [ 17.82, 68, The monthly income of 7 families is given below. Calculate G.M., Income: 10 15 18 22 25 35, 40, (in’000 Rs.), [21.4, 69. a] Compute the G.M. of the following, 0,052, 3.7, 5.0, 80, 110, 6, 0.35, 9.26. ine, , b| Find the G.M. of length of 10 rods., , 12.4, 12,8, 12,2, 12.0, 12.3, 12.5, 12.5, 12.0, 12.4, 12.8. 12.3