Notes of Intermediate, Financial Management Leverage. Fm.pdf - Study Material
Page 1 :
CHAPTER, , 6, , FINANCING DECISIONS, - LEVERAGES, LEARNING OUTCOMES, , , Understand the concept of business risk and financial risk., , , , Discuss and interpret the types of leverages., , , , Discuss the relationship between operating leverage, Break even analysis & Margin of Safety., , , , Discuss positive and negative Leverage., , , , Discuss Financial leverage as ‘Trading on equity’., , , , Discuss Financial Leverage as ‘Double Edged Sword’., , Analysis of Leverage, , Types of Leverage, Business and Financial Risk, , (i) Operating Leverage, (ii) Financial Leverage, , (iii) Combined Leverage, , © The Institute of Chartered Accountants of India
Page 2 :
6.2, , FINANCIAL MANAGEMENT, , 6.1 INTRODUCTION, Objective of financial management is to maximize wealth. Here, wealth means, market value. Value is directly related to performance of company and inversely, related to expectation of investors. In turn, expectation of investor is dependent on, risk of the company. Therefore, to maximize value, company should try to manage, its risk. This risk may be business risk, financial risk or both as defined below:, Business Risk: It refers to the risk associated with the firm's operations. It is the, uncertainty about the future operating income (EBIT) i.e., how well can the, operating income be predicted?, Financial Risk: It refers to the additional risk placed on the firm's shareholders, because of use of debt i.e., the additional risk, a shareholder bears when a company, uses debt in addition to equity financing. Companies that issue more debt, instruments would have higher financial risk than companies financed mostly or, entirely by equity., In this chapter we will discuss factors that influence business and financial risks., , 6.2 MEANING AND TYPES OF LEVERAGE, 6.2.1 Meaning of Leverage, The term leverage represents influence or power. In financial analysis, leverage, represents the influence of one financial variable over some other related financial, variable. These financial variables may be costs, output, sales revenue, Earnings, Before Interest and Tax (EBIT), Earning Per Share (EPS) etc., Generally, if we want to calculate the impact of change in variable X on variable Y,, it is termed as Leverage of Y with X, and it is calculated as follows:, Measurement of Leverage=, , Change in Y÷Y, Change in X ÷X, , 6.2.2 Types of Leverage, There are three commonly used measures of leverage in financial analysis. These, are:, (i), , Operating Leverage: It is the relationship between Sales and EBIT and indicates, business risk., , © The Institute of Chartered Accountants of India
Page 3 :
FINANCING DECISIONS - LEVERAGES, , Operating Leverage, , (ii), , Business risk, , Financial Leverage: It is the relationship between EBIT and EPS and indicates, financial risk., Financial Leverage, , (iii), , 6.3, , Financial risk, , Combined Leverage: It is the relationship between Sales and EPS and indicates, total risk i.e., both business risk and financial risk., Combined Leverage, , Total risk, , 6.2.3 Chart Showing Degree of Operating Leverage, Financial Leverage, and Combined leverage, Profitability Statement, , Sales, Less: Variable Cost, Contribution, Less: Fixed Cost, Operating Profit/ EBIT, , xxx, (xxx), xxx, (xxx), xxx, , Less: Interest, Earnings Before Tax (EBT), Less: Tax, Profit After Tax (PAT), Less: Pref. Dividend (if any), Net Earnings available to equity, shareholders/ PAT, No. Equity shares (N), Earnings per Share (EPS) (PAT ÷ N), , (xxx), xxx, (xxx), xxx, (xxx), xxx, xxx, xxx, , © The Institute of Chartered Accountants of India, , Degree of Operating, Leverage, , Degree of Financial, Leverage, , Degree of, Combined, Leverage
Page 4 :
6.4, , FINANCIAL MANAGEMENT, , 6.3 OPERATING LEVERAGE, Operating Leverage (OL) means tendency of operating income (EBIT) to change, disproportionately with change in sale volume. This disproportionate change is, caused by operating fixed cost, which does not change with change in sales volume., In other words, Operating Leverage maybe defined as the employment of an asset, with a fixed cost so that enough revenue can be generated to cover all the fixed, and variable costs., The use of assets for which a company pays a fixed cost is called operating leverage., Operating leverage is a function of three factors:, (i), , Amount of fixed cost,, , (ii), , Variable contribution margin, and, , (iii), , Volume of sales., , 6.3.1 Degree of Operating Leverage (DOL), , When we measure magnitude of disproportionate change, it is termed as degree of, leverage. Degree of Operating Leverage (DOL) may be defined as percentage, change in EBIT with respect to percentage change in sales quantity., Degree of Operating Leverage (DOL) =, Mathematically:, DOL =, Here,, , ∆EBIT ∆Q, �, EBIT, Q, , EBIT = Q (S – V) – F, Q, , = Sales quantity, , S, , = Selling price per unit, , V, , = Variable cost per unit, , ∆ Denotes change, , © The Institute of Chartered Accountants of India, , Percentage Change in EBIT, Percentage Change in Sales
Page 5 :
FINANCING DECISIONS - LEVERAGES, , 6.5, , ∆ [Q (S-V)-F] / [Q (S-V)-F], ∆Q / Q, , DOL =, , Now ∆F is nil because change in fixed cost is nil. Therefore:, ∆ Q (S-V) ∆ Q, �, =, Q, Q (S-V)-F, , DOL =, , DOL =, , ∆ Q (S-V) Q, ×, Q (S-V)-F ∆ Q, , =, , Q (S-V), Q (S-V)-F, , Contribution, Contribution, =, Contribution - Fixed Cost, EBIT, , 6.3.2 Break-Even Analysis and Operating Leverage, Break-even analysis is a generally used to study the Cost Volume Profit analysis. It, is concerned with computing the break-even point. At break-even point (BEP) of, production level and sales, there will be no profit and loss i.e. total cost is equal to, total sales revenue., Break-even point in units =, , Fixed Cost, , Contribution per unit, , Let us understand through the following example:, Example - 1:, Particulars, , Product X, , Product Y, , 40, , 20, , (`), , Selling Price p.u., , (`), , Variable Cost p.u., , 20, , 12, , Contribution p.u., , 20, , 8, , Total Contribution of 1,000 units, , 20,000, , 8,000, , Fixed Cost, , 15,000, , 5,000, , Profit (EBIT), , 5,000, , 3,000, , Break- even point (Fixed Cost /, Contribution, , 15,000, , © The Institute of Chartered Accountants of India, , 20, , = 750 units, , 5,000, 8, , = 625 units
Page 6 :
6.6, , FINANCIAL MANAGEMENT, , Operating, Contribution , , , EBIT, , , , 20,000, , Leverage, , 5,000, , =4, , 8,000, , 3,000, , = 2.67, , There is a relationship between leverage and Break-even point. Both are used for, profit planning., In brief, the relationship between leverage, break-even point and fixed cost is as, under:, Leverage, , Break-even point, , 2. Firm with low leverage, , 2 .Lower Break-even point, , Fixed cost, , Operating leverage, , 2. Lower fixed cost, , 2. Lower degree of operating leverage, , 1. Firm with high leverage, , 1. High fixed cost, , 1. Higher Break-even point, , 1. High degree of operating leverage, , 6.3.3 Margin of Safety (MOS) and Operating Leverage (OL), In cost accounting, margin of safety (MOS) may be calculated as follows:, , MOS =, , Sales - BEP Sales, × 100, Sales, , Higher margin of safety indicates lower business risk and higher profit and vice, versa. MOS is inversely related to OL., If we both multiply and divide above formula with profit volume (PV) ratio then:, MOS =, , (Sales × PV Ratio)- (BEP × PV Ratio), Sales - BEP Sales PV Ratio, ×, =, PV Ratio, Sales × PV Ratio, Sales, , We knows that:, PV ratio =, And,, , BEP =, So,, , Contribution, or Sales × PV ratio = Contribution, Sales, , Fixed Cost, or BEP × PV ratio = Fixed Cost, PV ratio, , © The Institute of Chartered Accountants of India
Page 7 :
FINANCING DECISIONS - LEVERAGES, , MOS =, Further,, Contribution, DOL =, EBIT, , 6.7, , Contribution - Fixed Cost, EBIT, =, Contribution, Contribution, , hence:, , Degree of Operating leverage =, , 1, Margin of Safety, , Let us understand this through the following example:, Example – 2:, Particulars, , Product X, (`), , Sales (50 x 1000 units), , 50,000, , Variable Cost (30 x 1000 units), , 30,000, , Contribution, , 20,000, , Fixed Cost, , 15,000, , Profit (EBIT), , 5,000, , Break- even point (Fixed Cost / PV ratio), , 15,000/0.40 = 37,500, , Margin of Safety = (50,000-37,500)/50,000, , 0.25, , Operating Leverage = Contribution/EBIT =, 20,000/5,000, , 4, , Operating Leverage = 1/MOS = 1/0.25, , 4, , If Margin of safety, , Business Risk, , DOL (1/MOS), , Falls, , Rises, , Rises, , Rises, , Falls, , Falls, , When DOL is more than one (1), operating leverage exists. More is the DOL, higher, is operating leverage., , © The Institute of Chartered Accountants of India
Page 8 :
6.8, , FINANCIAL MANAGEMENT, , A positive DOL/ OL means that the firm is operating at higher level than the breakeven level and both sales and EBIT moves in the same direction. In case of negative, DOL/ OL, firm operates at lower than the break-even sales and EBIT is negative., Situation 1: No Fixed Cost, Particulars, , 20,000 units, , 30,000 units, , (`), , (`), , Sales @ ` 10, , 2,00,000, , 3,00,000, , Variable cost @ ` 5, , 1,00,000, , 1,50,000, , EBIT, , 1,00,000, , 1,50,000, , Degree of Operative leverage (DOL) =, , Percentage change in EBIT, , =, , Percentage change in Sales, , 50%, , 50%, , =1, , Situation 2: Positive Leverage, Particulars, , 20,000 units, (`), , 30,000 units, (`), , 1,00,000, , 1,50,000, , Sales @ ` 10, , 2,00,000, , 3,00,000, , Contribution, , 1,00,000, , 1,50,000, , Variable Cost @ ` 5, Fixed Cost, EBIT, , 50,000, , 50,000, , 50,000, , Degree of Operative leverage (DOL) =, , 1,00,000, , Percentage change in EBIT, , Percentage change in sales, , =, , 100%, 50%, , Situation 3: When EBIT is Nil (Contribution = Fixed cost), Degree of Operating Leverage (DOL) =, , Contribution, 0, , = Undefined, , Analysis and Interpretation of operating leverage, S. No., 1, , 2., , Situation, , Result, , Higher Fixed cost, , Higher Break-even point, , No Fixed Cost, , © The Institute of Chartered Accountants of India, , No operating leverage, , =2
Page 9 :
FINANCING DECISIONS - LEVERAGES, , 6.9, , 3., , Higher than Break-even level, , Positive operating leverage, , 4., , Lower than Break-even level, , Negative operating leverage, , Operating Leverage, and EBIT, Negative, , Infinite/, Undefined, , Possitive, , Operating at Lower, than break-even point, , Operating at breakeven point, , Operating at a Higher, Level than break-even, point, , EBIT= -Ve, , EBIT = 0, , EBIT = +Ve, , Positive and Negative Operating Leverage, Note: DOL can never be between zero and one. It can be zero or less or it can be, one or more., , DOL, positive, 1, BEP, , 0, , Sale, , negative, , When Sales is much higher than BEP sales, DOL will be slightly more than one. With, decrease in sales, DOL will increase. At BEP, DOL will be infinite. When sales is, © The Institute of Chartered Accountants of India
Page 10 :
6.10, , FINANCIAL MANAGEMENT, , slightly less than BEP, DOL will be negative infinite. With further reduction in sale,, DOL will move towards zero. At zero sales, DOL will also be zero., ILLUSTRATION 1, A Company produces and sells 10,000 shirts. The selling price per shirt is ` 500., Variable cost is ` 200 per shirt and fixed operating cost is ` 25,00,000., (a), , CALCULATE operating leverage., , (b), , If sales are up by 10%, then COMPUTE the impact on EBIT?, , SOLUTION, (a), , Statement of Profitability, , `, Sales Revenue (10,000 × 500), , 50,00,000, , Contribution, , 30,00,000, , Less: Variable Cost (10,000 × 200), , 20,00,000, , Less: Fixed Cost, , 25,00,000, , EBIT, , Operating Leverage =, , (b), , 5,00,000, , Contribution, EBIT, , Operating Leverage (OL) =, , =, , ` 30 lakhs, = 6 times, ` 5 lakhs, , %Changein EBIT, %ChangeinSales, X / 5,00,000, , 6, , =, , X, , = ` 3,00,000, , 5,00,000 50,00,000, , ∴∆EBIT = ` 3,00,000/` 5,00,000 = 60%, ILLUSTRATION 2, CALCULATE the operating leverage for each of the four firms A, B, C and D from the, following price and cost data:, , Sale price per unit, , A (`), 20, , © The Institute of Chartered Accountants of India, , B(`), 32, , Firms, , C(`), 50, , D(`), 70
Page 11 :
FINANCING DECISIONS - LEVERAGES, Variable cost per unit, Fixed operating cost, , 6, , 6.11, , 16, , 60,000, , 20, , 40,000, , 1,00,000, , 50, , Nil, , What calculations can you draw with respect to levels of fixed cost and the degree of, operating leverage result? EXPLAIN. Assume number of units sold is 5,000., SOLUTION, A (`), Sales (units), , B (`), , Firms, , C (`), , D (`), , 5,000, , 5,000, , 5,000, , 5,000, , Sales revenue, (Units × sale price per unit), , 1,00,000, , 1,60,000, , 2,50,000, , 3,50,000, , Less: Variable cost, , (30,000), , (80,000) (1,00,000), , (2,50,000), , (60,000), , (40,000) (1,00,000), , Nil, , (Units × variable cost per unit), Less: Fixed operating costs, EBIT, DOL =, , 10,000, , 40,000, , 50,000, , 1,00,000, , Current sales (S) - Variable costs (VC), , DOL(A) =, DOL(B) =, DOL(C) =, , DOL(D) =, , Current EBIT, , ` 1,00,000 − ` 30,000, =7, ` 10,000, , `1,60,000 − ` 80,000, =2, ` 40,000, , ` 2,50,000 − ` 1,00,000, =3, ` 50,000, , `3,50,000 − ` 2,50,000, =1, ` 1,00,000, , The operating leverage exists only when there are fixed costs. In the case of firm D,, there is no magnified effect on the EBIT due to change in sales. A 20 per cent, increase in sales has resulted in a 20 per cent increase in EBIT. In the case of other, firms, operating leverage exists. It is maximum in firm A, followed by firm C and, minimum in firm B. The interception of DOL of 7 is that 1 per cent change in sales, results in 7 per cent change in EBIT level in the direction of the change of sales level, of firm A., , © The Institute of Chartered Accountants of India
Page 12 :
6.12, , FINANCIAL MANAGEMENT, , 6.4 FINANCIAL LEVERAGE, Financial leverage (FL) maybe defined as ‘the use of funds with a fixed cost in, order to increase earnings per share’. In other words, it is the use of company, funds on which it pays a limited return. Financial leverage involves the use of funds, obtained at a fixed cost in the hope of increasing the return to common, stockholders., Financial Leverage (FL) =, Where,, , Earnings before interest and tax(EBIT), Earnings before tax(EBT), , EBIT, , = Sales - (Variable cost + Fixed cost), , EBT, , = EBIT - Interest, , 6.4.1 Degree of Financial Leverage (DFL), Degree of financial leverage is the ratio of the percentage increase in Earnings Per, Share (EPS) to the percentage increase in Earnings Before Interest and Taxes (EBIT)., Financial Leverage (FL) is also defined as “the ability of a firm to use fixed, financial charges to magnify the effect of changes in EBIT on EPS, Degree of Financial Leverage (DFL), =, DFL =, , Percentage change in earnings per share (EPS), Percentage change in earnigs before interest and tax (EBIT), , ∆EPS ∆EBIT, �, EPS EBIT, , ΔEPS means change in EPS and ΔEBIT means change in EBIT, Now, EPS = [(EBIT - I)(1- t)] - D/No. of Shares, Here,, T = Tax Rate, D = Dividend on Preference Shares (inclusive of dividend tax if any), On simplifying the above we get,, DFL =, , EBIT(1-t), (EBIT-Int.)(1-t) - DP, , © The Institute of Chartered Accountants of India
Page 13 :
FINANCING DECISIONS - LEVERAGES, , DFL=, , EBIT, (EBIT-Int.)-, , 6.13, , DP, 1-t, , If the company has not issued preference shares, then:, DFL =, , EBIT, EBIT, =, EBIT-Int. PBT, , When DFL is more than one (1), financial leverage exists. More is DFL, higher is, financial leverage., A positive DFL/ FL means firm is operating at a level higher than break-even point, and EBIT and EPS moves in the same direction. Negative DFL/ FL indicates the firm, is operating at lower than break-even point and EPS is negative., Let us understand through the following analysis:, Situation 1: No Fixed Interest charges, Particulars, , X, , Y, , (`), , (`), , EBIT, , 1,00,000, , 1,50,000, , PAT, , 50,000, , 75,000, , Tax @ 50%, , 50,000, , No. of shares, , 75,000, , 10,000, , EPS, , 10,000, , 5, , Degree of Finance Leverage (DFL) =, , Change in EP, , Change in EBIT, , 7.5, , =, , 50%, =1, 50%, , Situation 2: Positive Financial Leverage, Particulars, , X, , Y, , (`), , (`), , EBIT, , 1,00,000, , 1,50,000, , EBT, , 80,000, , 1,30,000, , 40,000, , 65,000, , Interest, Tax @ 50%, PAT, , No of Shares, EPS, , 20,000, 40,000, 10,000, , 4, , © The Institute of Chartered Accountants of India, , 20,000, 65,000, 10,000, , 6.5
Page 14 :
6.14, , FINANCIAL MANAGEMENT, , Change in EPS, , Degree of Finance Leverage (DFL)=, , Change in EBIT, , =, , 62.5% *, 50%, , = 1.25, , 2.5, , ×100 , , 4, = 62.5%, *Change in EPS =, 50%, , Situation 3. When EBT is nil (EBIT = Fixed Interest), Degree of Finance Leverage (DFL) =, , EBIT, Nil, , = Undefined, , Financial Leverage, , Positive, , Infinite/ Undefined, , Negative, , EBIT level is more, than Fixed Financial, Charge, , Operating at Financial, break even point, , EBIT level is less than, Fixed Financial, Charge, , EPS: will change in, the same direction as, EBIT, , No Profit no Loss, , EPS : Negative, , Positive and Negative Financial Leverage, Analysis and Interpretation of Financial leverage, Sl., No., , Situation, , Result, , 1, , No Fixed Financial Cost, , No Financial leverage, , © The Institute of Chartered Accountants of India
Page 15 :
FINANCING DECISIONS - LEVERAGES, , 6.15, , 2., , Higher Fixed Financial cost, , Higher Financial Leverage, , 3., , When EBIT is higher than Financial Break-even point Positive Financial leverage, , 4., , When EBIT is levy then Finance Break-even point Negating Financial leverage, , 6.4.2 Financial Leverage as ‘Trading on Equity’, , Financial leverage indicates the use of funds with fixed cost like long term debts, and preference share capital alongwith equity share capital which is known as, trading on equity. The basic aim of financial leverage is to increase the earnings, available to equity shareholders using fixed cost fund., A firm is known to have a positive/favourable leverage when its earnings are more, than the cost of debt. If earnings are equal to or less than cost of debt, it will be an, negative/unfavourable leverage. When the quantity of fixed cost fund is relatively, high in comparison to equity capital it is said that the firm is ‘’trading on equity”., , 6.4.3 Financial Leverage as a ‘Double edged Sword’, , © The Institute of Chartered Accountants of India
Page 16 :
6.16, , FINANCIAL MANAGEMENT, , When the cost of ‘fixed cost fund’ is less than the return on investment, financial, leverage will help to increase return on equity and EPS. The firm will also benefit, from the saving of tax on interest on debts etc. However, when cost of debt will be, more than the return it will affect return of equity and EPS unfavourably and as a, result firm can be under financial distress. Therefore, financial leverage is also, known as “double edged sword”., Effect on EPS and ROE:, When, ROI > Interest – Favourable – Advantage, When, ROI < Interest – Unfavourable – Disadvantage, When, ROI = Interest – Neutral – Neither advantage nor disadvantage., Note: DFL can never be between zero and one. It can be zero or less or it can be, one or more., , DFL, positive, 1, 0, , Financial BEP*, , EBIT, , negative, , *Financial BEP is the level of EBIT at which earning per share is zero. If a company, has not issued preference shares, then Financial BEP is simply equal to amount of, Interest., When EBIT is much higher than Financial BEP, DFL will be slightly more than one., With decrease in EBIT, DFL will increase. At Financial BEP, DFL will be infinite. When, EBIT is slightly less than Financial BEP, DFL will be negative infinite. With further, reduction in EBIT, DFL will move towards zero. At zero EBIT, DFL will also be zero., © The Institute of Chartered Accountants of India
Page 17 :
FINANCING DECISIONS - LEVERAGES, , 6.17, , 6.5 COMBINED LEVERAGE, Combined leverage maybe defined as the potential use of fixed costs, both, operating and financial, which magnifies the effect of sales volume change on, the earning per share of the firm., Combined Leverage (CL) = Operating Leverage (OL) × Financial Leverage (FL), , C EBIT, ×, EBIT EBT, C, =, EBT, =, , 6.5.1 Degree of Combined Leverage (DCL), Degree of combined leverage (DCL) is the ratio of percentage change in earning, per share to the percentage change in sales. It indicates the effect the changes, in sales will have on EPS., DCL, , = DOL × DFL, =, , %Changein EBIT, %Change in EPS, ×, %Changein Sales %Change in EBIT, , =, , %Changein EPS, %Changein Sales, , Like operating leverage and financial leverage, combined leverage can also be, positive and negative combined leverage., 6.5.2 Analysis of combined leverage, Combine leverage measures total risk. It depends on combination of operating and, financial risk., DOL, , DFL, , Comments, , Low, , Low, , Lower total risk., , High, , High, , Higher total risk. Very risky combination., , High, , Low, , Moderate total risk. Not a good combination., , Cannot take advantage of trading on equity., , © The Institute of Chartered Accountants of India
Page 18 :
6.18, , FINANCIAL MANAGEMENT, , Lower EBIT due to higher DOL and lower advantage of trading on, equity due to low DFL., Low, , High, , Moderate total risk. Best combination., , Higher financial risk is balanced by lower total business risk., , ILLUSTRATION 3, A firm’s details are as under:, Sales (@100 per unit), , ` 24,00,000, , Variable Cost, , 50%, , Fixed Cost, , ` 10,00,000, , It has borrowed ` 10,00,000 @ 10% p.a. and its equity share capital is ` 10,00,000 (`, 100 each)., Consider tax @ 50 %., CALCULATE:, (a), , Operating Leverage, , (b), , Financial Leverage, , (c), , Combined Leverage, , (d), , Return on Investment, , (e), , If the sales increases by ` 6,00,000; what will the new EBIT?, , SOLUTION, (`), Sales, , 24,00,000, , Less: Variable cost, , 12,00,000, , Contribution, , 12,00,000, , Less: Fixed cost, , 10,00,000, , EBIT, , 2,00,000, , Less: Interest, , 1,00,000, , EBT, , 1,00,000, , Less: Tax (50%), , © The Institute of Chartered Accountants of India, , 50,000
Page 19 :
FINANCING DECISIONS - LEVERAGES, EAT, , 50,000, , No. of equity shares, , 10,000, , EPS, , 5, , 12,00,000, = 6 times, 2,00,000, , (a), , Operating Leverage =, , (b), , Financial Leverage =, , (c), , Combined Leverage = OL × FL = 6 × 2 = 12 times., , (d), , ROI =, , 2,00,000, = 2 times, 1,00,000, , 50,000, × 100 = 5%, 10,00,000, , Here ROI is calculated as ROE i.e., (e), , 6.19, , EAT-Pref.Dividend, Equity shareholders'fund, , Operating Leverage = 6, , 6=, , Δ EBIT, 0.25, , Δ EBIT, =, , 6 ×1, = 1.5, 4, , Increase in EBIT = ` 2,00,000 × 1.5 = ` 3,00,000, New EBIT = ` 5,00,000, ILLUSTRATION 4, The following information is related to Yizi Company Ltd. for the year ended 31st, March, 2021:, Equity share capital (of ` 10 each), , ` 50 lakhs, , Sales, , ` 84 lakhs, , 12% Bonds of ` 1,000 each, , Fixed cost (excluding interest), Financial leverage, , Profit-volume Ratio, , Income Tax Applicable, , © The Institute of Chartered Accountants of India, , ` 37 lakhs, ` 6.96 lakhs, 1.49, , 27.55%, 40%
Page 20 :
6.20, , FINANCIAL MANAGEMENT, , You are required to CALCULATE:, (i), , Operating Leverage;, , (ii) Combined leverage; and, (iii) Earnings per share., Show calculations up-to two decimal points., SOLUTION, Computation of Profits after Tax (PAT), Particulars, , Amount (`), , Sales, , 84,00,000, , Contribution (Sales × P/V ratio), , 23,14,200, , Less: Fixed cost (excluding Interest), , (6,96,000), , EBIT (Earnings before interest and tax), , 16,18,200, , Less: Interest on debentures (12% × `37 lakhs), , (4,44,000), , Less: Other fixed Interest (balancing figure), , (88,160)*, , EBT (Earnings before tax), , 10,86,040, , Less: Tax @ 40%, , 4,34,416, , PAT (Profit after tax), , 6,51,624, , (i) Operating Leverage:, =, , ` 23,14,200, Contribution, =, = 1.43, EBIT, ` 16,18,200, , (ii) Combined Leverage:, = Operating Leverage × Financial Leverage, = 1.43 × 1.49 = 2.13, Or,, Combined Leverage =, Combined Leverage =, , Contribution EBIT, ×, EBIT, EBT, Contribution, EBT, , =, , ` 23,14,200, ` 10,86,040, , © The Institute of Chartered Accountants of India, , = 2.13
Page 21 :
FINANCING DECISIONS - LEVERAGES, , *, , Financial Leverage, So,, , EBT, , EBIT, , =, =, , =, , EBT, , ` 16,18, 200, , 1.49, , = 1.49, , EBT, , ` 16,18, 200, , 6.21, , = `10,86,040, , Accordingly, other fixed interest, , = ` 16,18,200 - ` 10,86,040 - ` 4,44,000, = ` 88,160, , (iii) Earnings per share (EPS):, =, , PAT, No.of shares outstanding, , =, , ` 6,51,624, 5,00,000 equity shares, , = ` 1.30, , ILLUSTRATION 5, Following are the selected financial information of A Ltd. and B Ltd. for the year, ended March 31st, 2021:, Variable Cost Ratio, , A Ltd., , B Ltd., , ` 20,000, , ` 1,00,000, , 5, 3, , 2, 2, , 60%, , Interest, , Operating Leverage, Financial Leverage, , Tax Rate, You are required to FIND out:, (i), , 30%, , 50%, , 30%, , EBIT, , (ii) Sales, (iii) Fixed Cost, (iv) Identify the company which is better placed with reasons based on leverages., SOLUTION, Company A, (i), , Financial Leverage, So,, , 3, , =, , EBIT, EBT i.e EBIT Interest, , =, , EBIT, EBIT - 20,000, , © The Institute of Chartered Accountants of India
Page 22 :
6.22, , FINANCIAL MANAGEMENT, , Or,, , 3 (EBIT – 20,000), , = EBIT, , Or,, , 2 EBIT, , = 60,000, , Or,, , EBIT, , = 30,000, , (ii) Operating Leverage, Or,, , =, , Contribution, , Sales =, , Contribution, EBIT, , 5=, , Contribution, ` 30,000, , = ` 1, 50,000, , Contribution, , P/V Ratio (1 - variable cost ratio), , (iii) Fixed Cost, , Or,, , =, , ` 1,50,000, = ` 3,75,000, 40%, , = Contribution – EBIT, = ` 1, 50,000 – 30,000, , Or,, , Fixed cost, , = ` 1,20,000, , Company B, (i), , Financial Leverage, , =, , EBIT, EBT i.e EBIT Interest, EBIT, EBIT -1,00,000, , So,, , 2, , =, , Or,, , 2 (EBIT – 1,00,000), , = EBIT, , Or,, , 2 EBIT -2,00,000, , = EBIT, , Or,, , EBIT, , = ` 2,00,000, , (ii) Operating Leverage, , =, , Contribution, EBIT, , Or, 2, , =, , Contribution, ` 2,00,000, , Or,, , Contribution, , Sales =, , = ` 4,00,000, , Contribution, , P/V Ratio (1 - variable cost ratio), , (iii) Fixed Cost, , =, , ` 4,00,000, = ` 8,00,000, 50%, , = Contribution – EBIT, = ` 4, 00,000 – ` 2,00,000, , Or,, , Fixed cost, , = ` 2,00,000, , © The Institute of Chartered Accountants of India
Page 23 :
FINANCING DECISIONS - LEVERAGES, , 6.23, , Income Statements of Company A and Company B, Company A (`) Company B (`), Sales, , 3,75,000, , 8,00,000, , Less: Variable cost, , 2,25,000, , 4,00,000, , Contribution, , 1,50,000, , 4,00,000, , Less: Fixed Cost, , 1,20,000, , 2,00,000, , Earnings before interest and tax, (EBIT), , 30,000, , 2,00,000, , Less: Interest, , 20,000, , 1,00,000, , Earnings before tax (EBT), , 10,000, , 1,00,000, , Less: Tax @ 30%, , 3,000, , 30,000, , Earnings after tax (EAT), , 7,000, , 70,000, , Comment based on Leverage, Comment based on leverage – Company B is better than company A of the, following reasons:, •, , Capacity of Company B to meet interest liability is better than that of, companies A (from EBIT/Interest ratio), [A =, , •, , 30,000, 2,00,000, = 1.5, B =, = 2], 20,000, 1,00,000, , Company B has the least financial risk as the total risk (business and, financial) of company B is lower (combined leverage of Company A –, 15 and Company B- 4), , SUMMARY, DOL, , DFL, , DCL, , Shows level of business Shows level of financial Shows level of total or, risk., risk., combined risk., It is dependent upon It is dependent upon It is dependent upon, fixed cost., interest and preference fixed cost, interest &, dividend, preference dividend., © The Institute of Chartered Accountants of India
Page 24 :
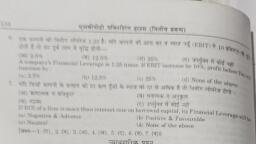
6.24, , FINANCIAL MANAGEMENT, , Measures % change in Measures % change in Measures % change in, EBIT which results from a EPS which results from a EPS which results from a, 1% change in Sales., 1% change in EBIT., 1% change in Sales., For example, if DOL is 3, and there is 8% increase, in output then EBIT will, increase by 24% & if, there is a 8% decrease in, output then EBIT will, decrease by 24%., , For example, if DFL is 2, and there is 5% increase, in EBIT then EPS will, increase by 10% and if, there is a 5% decrease in, EBIT then EPS will, decrease by 10%., , For example, if DCL is 6, and there is a 8%, increase in sales then EPS, will increase by 48% and, if there is a 8% decrease, in sales then EPS will, decrease by 48%., , There is a unique DOL for There is a unique DFL for There is a unique DCL for, each level of output., each level of EBIT., each level of sales., It, is, undefined, Operating B.E.P., , at It, is, undefined, Financial B.E.P., , at It, is, undefined, Financial B.E.P., , at, , TEST YOUR KNOWLEDGE, MCQs based Questions, 1., , Given, Operating fixed costs, Sales, , ` 20,000, ` 1,00,000, , P/ V ratio, , 40%, , The operating leverage is:, , 2., , (a), , 2.00, , (b), , 2.50, , (c), , 2.67, , (d), , 2.47, , If EBIT is ` 15,00,000, interest is ` 2,50,000, corporate tax is 40%, degree of, financial leverage is;, (a), , 1:11, , (b), , 1.20, , © The Institute of Chartered Accountants of India
Page 25 :
FINANCING DECISIONS - LEVERAGES, , 3., , 4., , 5., , 6., , 7., , (c), , 1.31, , (d), , 1.41, , If DOL is 1.24 and DFL is 1.99, DCL would be:, (a), , 2.14, , (b), , 2.18, , (c), , 2.31, , (d), , 2.47, , Operating Leverage is calculated as:, (a), , Contribution ÷ EBIT, , (b), , EBIT ÷ PBT, , (c), , EBIT ÷ Interest, , (d), , EBIT ÷ Tax, , Financial Leverage is calculated as:, (a), , EBIT ÷ Contribution, , (b), , EBIT ÷ PBT, , (c), , EBIT ÷ Sales, , (d), , EBIT ÷ Variables Cost, , Which of the following is correct?, (a), , CL = OL + FL, , (b), , CL = OL – FL, , (c), , OL = OL × FL, , (d), , OL = OL ÷ FL, , Which of the following indicates business risk?, (a), , Operating leverage, , (b), , Financial leverage, , (c), , Combined leverage, , (d), , Total leverage, , © The Institute of Chartered Accountants of India, , 6.25
Page 26 :
6.26, 8., , 9., , 10., , 11., , FINANCIAL MANAGEMENT, , Degree of combined leverage is the fraction of:, (a), , Percentage change in EBIT on Percentage change in Sales., , (b), , Percentage change in EPS on Percentage change in Sales., , (c), , Percentage change in Sales on Percentage change in EPS., , (d), , Percentage change in EPS on Percentage change in EBIT., , From the following information, calculate combined leverage:, Sales, , ` 20,00,000, , Variable Cost, , 40%, , Fixed Cost, , ` 10,00,000, , Borrowings, , ` 10,00,000 @ 8% p.a., , (a), , 10 times, , (b), , 6 times, , (c), , 1.667 times, , (d), , 0.10 times, , Operating leverage is a function of which of the following factors?, (a), , Amount of variable cost., , (b), , Variable contribution margin., , (c), , Volume of purchases., , (d), , Amount of semi-variable cost., , Financial leverage may be defined as:, (a), , Use of funds with a product cost in order to increase earnings per share., , (b), , Use of funds with a contribution cost in order to increase earnings, before interest and taxes., , (c), , Use of funds with a fixed cost in order to increase earnings per share., , (d), , Use of funds with a fixed cost in order to increase earnings before, interest and taxes., , © The Institute of Chartered Accountants of India
Page 27 :
FINANCING DECISIONS - LEVERAGES, 12., , 13., , 14., , 15., , 16., , 6.27, , If Margin of Safety is 0.25 and there is 8% increase in output, then EBIT will, be:, (a), , Decrease by 2%, , (b), , Increase by 32%, , (c), , Increase by 2%, , (d), , Decrease by 32%, , If degree of financial leverage is 3 and there is 15% increase in Earning per, share (EPS), then EBIT will be:, (a), , Decrease by 15%, , (b), , Increase by 45%, , (c), , Decrease by 45%, , (d), , Increase by 5%, , When EBIT is much higher than Financial break-even point, then degree of, financial leverage will be slightly:, (a), , Less than 1, , (b), , Equals to 1, , (c), , More than 1, , (d), , Equals to 0, , Firm with high operating leverage will have:, (a), , Higher breakeven point, , (b), , Lower business risk, , (c), , Higher margin of safety, , (d), , All of above, , When sales is at breakeven point, the degree of operating leverage will be:, (a), , Zero, , (b), , Infinite, , (c), , One, , (d), , None of above, , © The Institute of Chartered Accountants of India
Page 28 :
6.28, 17., , FINANCIAL MANAGEMENT, , If degree of combined leverage is 3 and margin of safety is 0.50, then degree, of financial leverage is:, (a), , 6.00, , (b), , 3.00, , (c), , 0.50, , (d), , 1.50, , Theoretical based Questions, 1., , DIFFERENTIATE between Business risk and Financial risk., , 2., , “Operating risk is associated with cost structure, whereas financial risk is, associated with capital structure of a business concern.” Critically EXAMINE, this statement., , 3., , EXPLAIN the concept of “Double edged sword” in Financial leverage analysis?, , Practical Problems, 1., , From the following information extracted from the books of accounts of Imax, Ltd., CALCULATE percentage change in earnings per share, if sales increase, by 10% and Fixed Operating cost is ` 1,57,500., Particulars, , EBIT (Earnings before Interest and Tax), , Amount in (`), , 31,50,000, , Earnings before Tax (EBT), 2., , 14,00,000, , Consider the following information for Mega Ltd.:, Production level, Contribution per unit, , 2,500 units, ` 150, , Operating leverage, , 6, , Combined leverage, , 24, , Tax rate, Required:, COMPUTE its earnings after tax., , © The Institute of Chartered Accountants of India, , 30%
Page 29 :
FINANCING DECISIONS - LEVERAGES, 3., , From the following information, prepare Income Statement of Company A & B:, Particulars, , Margin of safety, , Company A, 0.20, , Interest, , Company B, , ` 3,000, , Profit volume ratio, , 25%, , Financial Leverage, , 4., , 6.29, , 4, , 0.25, , ` 2,000, , 33.33%, 3, , Tax rate, 45%, 45%, st, The capital structure of PS Ltd. for the year ended 31 March 2021 consisted, as follows:, Particulars, , Equity share capital (face value ` 100 each), , Amount in (`), , 10% debentures (` 100 each), , 10,00,000, 10,00,000, , During the year 2020-21, sales decreased to 1,00,000 units as compared to, 1,20,000 units in the previous year. However, the selling price stood at ` 12, per unit and variable cost at ` 8 per unit for both the years. The fixed expenses, were at ` 2,00,000 p.a. and the income tax rate is 30%., You are required to CALCULATE the following:, (i), , The degree of financial leverage at 1,20,000 units and 1,00,000 units., , (ii), , The degree of operating leverage at 1,20,000 units and 1,00,000 units., , (iii), , The percentage change in EPS., , 5., , The Sale revenue of TM excellence Ltd. @ ` 20 Per unit of output is ` 20 lakhs, and Contribution is ` 10 lakhs. At the present level of output, the DOL of the, company is 2.5. The company does not have any Preference Shares. The, number of Equity Shares are 1 lakh. Applicable corporate Income Tax rate is, 50% and the rate of interest on Debt Capital is 16% p.a. CALCULATE the EPS, (at sales revenue of ` 20 lakhs) and amount of Debt Capital of the company, if a 25% decline in Sales will wipe out EPS., , 6., , Betatronics Ltd. has the following balance sheet and income statement information:, Balance Sheet as on March 31st 2021, Liabilities, , Equity capital (` 10 per share), , (`) Assets, , 8,00,000 Net fixed assets, , © The Institute of Chartered Accountants of India, , (`), , 10,00,000
Page 30 :
6.30, , FINANCIAL MANAGEMENT, , 10% Debt, , 6,00,000 Current assets, , Retained earnings, , 3,50,000, , Current liabilities, , 1,50,000, 19,00,000, , 9,00,000, , 19,00,000, , Income Statement for the year ending March 31st 2021, Particulars, , (`), , Sales, , 3,40,000, , Operating expenses (including ` 60,000 depreciation), , 1,20,000, , EBIT, , 2,20,000, , Less: Interest, , 60,000, , Earnings before tax, , 1,60,000, , Less: Taxes, , 56,000, , Net Earnings (EAT), , 7., , 1,04,000, , (a), , DETERMINE the degree of operating, financial and combined leverages at, the current sales level, if all operating expenses, other than depreciation,, are variable costs., , (b), , If total assets remain at the same level, but sales (i) increase by 20 percent, and (ii) decrease by 20 percent, COMPUTE the earnings per share at the, new sales level?, , A company had the following Balance Sheet as on 31stMarch, 2021:, Liabilities, , Amount, in crores, , Assets, , (`), , Amount, in crores, (`), , Equity Share Capital (50, lakhs shares of ` 10 each), , 5, , Fixed Assets (Net), , 12.5, , Reserves and Surplus, , 1, , Current Assets, , 7.5, , 15% Debentures, , 10, , Current Liabilities, , 4, 20, , © The Institute of Chartered Accountants of India, , 20
Page 31 :
FINANCING DECISIONS - LEVERAGES, , 6.31, , The additional information given is as under:, Fixed cost per annum (excluding interest), , ` 4 crores, , Variable operating cost ratio, , 65%, , Total assets turnover ratio, , 2.5, , Income Tax rate, , 30%, , Required:, , CALCULATE the following and comment:, , 8., , (i), , Earnings Per Share, , (ii), , Operating Leverage, , (iii), , Financial Leverage, , (iv), , Combined Leverage, , CALCULATE the operating leverage, financial leverage and combined leverage, from the following data under Situation I and II and Financial Plan A and B:, Installed Capacity, Actual Production and Sales, , 4,000 units, 75% of the Capacity, , Selling Price, , ` 30 Per Unit, , Variable Cost, , ` 15 Per Unit, , Fixed Cost:, , Under Situation-I, , ` 15,000, , Under Situation-II, , ` 20,000, , Capital Structure:, Financial Plan, Equity, Debt (Rate of Interest at 20%), , © The Institute of Chartered Accountants of India, , A (`), , 10,000, , B (`), , 15,000, , 10,000, , 5,000, , 20,000, , 20,000
Page 32 :
6.32, 9., , FINANCIAL MANAGEMENT, , The following particulars relating to Navya Ltd. for the year ended 31st March, 2021 is given:, Output, , 1,00,000 units at normal capacity, , Selling price per unit, , ₹ 40, , Variable cost per unit, , ₹ 20, , Fixed cost, , ₹ 10,00,000, , The capital structure of the company as on 31st March, 2021 is as follows:, Particulars, Equity share capital (1,00,000 shares of ₹ 10 each), Reserves and surplus, 7% debentures, Current liabilities, Total, , ₹, 10,00,000, 5,00,000, 10,00,000, 5,00,000, 30,00,000, , Navya Ltd. has decided to undertake an expansion project to use the market, potential, that will involve ₹ 10 lakhs. The company expects an increase in output, by 50%. Fixed cost will be increased by ₹ 5,00,000 and variable cost per unit will, be decreased by 10%. The additional output can be sold at the existing selling, price without any adverse impact on the market., The following alternative schemes for financing the proposed expansion, programme are planned:, (i), , Entirely by equity shares of ₹ 10 each at par., , (ii), , ₹ 5 lakh by issue of equity shares of ₹ 10 each and the balance by issue of, 6% debentures of ₹ 100 each at par., , (iii), , Entirely by 6% debentures of ₹ 100 each at par., , FIND out which of the above-mentioned alternatives would you recommend for, Navya Ltd. with reference to the risk and return involved, assuming a corporate, tax of 40%., , © The Institute of Chartered Accountants of India
Page 33 :
FINANCING DECISIONS - LEVERAGES, 10., , 6.33, , The following details of a company for the year ended 31st March, 2021 are given, below:, Operating leverage, , 2:1, , Combined leverage, , 2.5:1, , Fixed Cost excluding interest, , ` 3.4 lakhs, , Sales, , ` 50 lakhs, , 8% Debentures of ` 100 each, , ` 30.25 lakhs, , Equity Share Capital of ` 10 each, , 34 lakhs, , Income Tax Rate, , 30%, , CALCULATE:, , 11., , (i), , Financial Leverage, , (ii), , P/V ratio and Earning per Share (EPS), , (iii), , If the company belongs to an industry, whose assets turnover is 1.5, does, it have a high or low assets turnover?, , (iv), , At what level of sales, the Earning before Tax (EBT) of the company will be, equal to zero?, , You are given the following information of 5 firms of the same industry:, Name of the, Firm, , Change in, Revenue, , Change in, Operating Income, , Change in, Earning per share, , N, , 27%, , 34%, , 26%, , M, P, , Q, R, , 28%, 25%, 23%, 25%, , You are required to CALCULATE for all firms:, (i), , Degree of operating leverage and, , (ii), , Degree of combined leverage., , © The Institute of Chartered Accountants of India, , 26%, 38%, 43%, 40%, , 32%, 23%, 27%, 28%
Page 34 :
6.34, , FINANCIAL MANAGEMENT, , ANSWERS/SOLUTIONS, Answers to the MCQs based Questions, 1., , 7., , 13., , (a), , 2., , (a), , 8., , (d), , 14., , (b), , 3., , (b), , 9., , (c), , 15., , (d), , (a), (a), , 4., , 10., 16., , (a), , (b), (b), , 5., , 11., 17., , (b), , (c), , (d), , 6., , 12., , (c), , (b), , Answers to Theoretical based Questions, 1., , Please refer paragraph 6.1.1, , 2., , Please refer paragraph 6.1.1, , 3., , Please refer paragraph 6.4.3, , Answers to Practical problems, 1., , Operating Leverage (OL), =, , ` 31,50,000 ` 1,57,500, Contribution EBIT + Fixed Cost, = 1.05, =, =, ` 31,50,000, EBIT, EBIT, , Financial Leverage (FL), ` 31,50,000, = 2.25, = EBIT =, ` 14,00,000, EBT, , Combined Leverage (CL), = 1.05 × 2.25 = 2.3625, Percentage Change in Earnings per share, , DCL =, , % change in EPS, = 2.3625 = % change in EPS, % change in Sales, 10%, , ∴% change in EPS = 23.625%, Hence, if sales increases by 10%, EPS will be increased by 23.625%., 2., , Workings:, 1., , ` 3,75,000, =6, Operating Leverage = Contribution = ` 150 x 2,500 =, EBIT, EBIT, EBIT, , ؞EBIT = ` 3,75,000 = ` 62,500, 6, , © The Institute of Chartered Accountants of India
Page 35 :
FINANCING DECISIONS - LEVERAGES, 2., , 6.35, , Operating Leverage (OL) × Financial Leverage (FL)= Combined Leverage (CL), 6 × Financial Leverage = 24, ∴ Financial Leverage = 4, Also, Financial Leverage = EBIT = 4, EBT, , ∴ EBT = EBIT = 62,500 = ` 15,625, 4, , 4, , Computation of Earnings after tax, Earnings after Tax (EAT) = EBT (1 − t) = ` 15,625 (1 − 0.30) = ` 15,625 × 0.70, ∴ Earnings after Tax (EAT) = ` 10,938, 3., , Income Statement, Particulars, , Company A, (`), , Company B, (`), , Sales, , 80,000, , 36,000, , Less: Variable Cost, , 60,000, , 24,000, , Contribution, , 20,000, , 12,000, , Less: Fixed Cost, , 16,000, , 9,000, , EBIT, , 4,000, , 3,000, , Less: Interest, , 3,000, , 2,000, , EBT, , 1,000, , 1,000, , Tax (45%), , 450, , 450, , EAT, , 550, , 550, , Workings:, (i), , Company A, Financial Leverage, , = EBIT/(EBIT- Interest), , 4, , = EBIT/(EBIT- ` 3,000), , 4EBIT – ` 12,000, , = EBIT, , 3EBIT, , = ` 12,000, , EBIT, © The Institute of Chartered Accountants of India, , = ` 4,000
Page 36 :
6.36, , FINANCIAL MANAGEMENT, , Company B, Financial Leverage, , = EBIT/(EBIT - Interest), , 3 = EBIT/(EBIT – ` 2,000), , (ii), , 3EBIT – ` 6000, , = EBIT, , 2EBIT, , = ` 6,000, , EBIT, , = ` 3,000, , Company A, Operating Leverage, = 1/0.20, Operating Leverage, 5, , = 1/Margin of Safety, =5, = Contribution/EBIT, = Contribution/` 4,000, , Contribution, , = ` 20,000, , Company B, Operating Leverage, = 1/0.25, Operating Leverage, 4, , =4, = Contribution/EBIT, = Contribution/` 3,000, , Contribution, (iii), , = 1/Margin of Safety, , = ` 12,000, , Company A, Profit Volume Ratio, , = 25%(Given), , Profit Volume Ratio, , = Contribution/Sales × 100, , 25%, , = ` 20,000/Sales, , Sales, , = ` 20,000/25%, , Sales, , = ` 80,000, , Company B, Profit Volume Ratio, , = 33.33%, , Therefore,, , = ` 12,000/33.33%, , Sales, Sales, , = ` 36,000, , © The Institute of Chartered Accountants of India
Page 37 :
FINANCING DECISIONS - LEVERAGES, 4., , 6.37, , Income Statement with required calculations, Particulars, , (`), , Sales in units, , (`), , 1,20,000, , 1,00,000, , Sales Value, , 14,40,000, , 12,00,000, , Variable Cost, , (9,60,000), , (8,00,000), , Contribution, , 4,80,000, , 4,00,000, , (2,00,000), , (2,00,000), , 2,80,000, , 2,00,000, , (1,00,000), , (1,00,000), , EBT, , 1,80,000, , 1,00,000, , Tax @ 30%, , (54,000), , (30,000), , Profit after tax (PAT), , 1,26,000, , 70,000, , 10,000, , 10,000, , Fixed expenses, EBIT, Debenture Interest, , No. of shares, (i) Financial Leverage, EBIT, =, EBT, , =, , =, , ` 4,80,000, ` 2,80,000, , =, , = 1.56, , (ii) Operating leverage, Contribution, =, EBIT, , =, , = 1.71, , (iii) Earnings per share (EPS), PAT, =, No. of shares, Decrease in EPS, , ` 2,80,000, ` 1,80,000, , =, , ` 1,26,000, 10,000, , = ` 12.6, , ` 2,00,000, ` 1,00,000, , =2, , ` 4,00,000, ` 2,00,000, =2, =, , ` 70,000, 10,000, , =`7, , = ` 12.6 – ` 7 = ` 5.6, , 5.6, × 100, 12.6, = 44.44%, , % decrease in EPS =, , 5., , (i), , Calculation of Fixed Cost, DOL =, EBIT, , ` 10,00,000, Contribution, or 2.5 =, or EBIT= ` 4,00,000, EBIT, Contribution-Fixed Cost, = Contribution – Fixed Cost, , © The Institute of Chartered Accountants of India
Page 38 :
6.38, , FINANCIAL MANAGEMENT, , 4,00,000 = 10,00,000 – Fixed Cost, Fixed Cost = 10,00,000 - 4,00,000 = ` 6,00,000, (ii), , Calculation of Degree of Combined Leverage (DCL), Question says that 25% change in sales will wipe out EPS. Here, wipe out, means it will reduce EPS by 100%., DCL =, , (iii), , (iv), , 100%, Percentage Change in EPS, =, =4, 25%, Percentage Change in Sales, , Calculation of Degree of Financial Leverage (DFL), DCL, , = DOL × DFL, , 4, , = 2.5 × DFL, , So, DFL, , = 1.6, , Calculation of Interest and amount of Debt, DFL =, , EBIT, ` 4,00,000, Or, 1.6 =, Or, Int = ` 1,50,000, EBIT-Int, ` 4,00,000 - Int, , Debt × Interest rate = Amount of Interest, , (v), , Debt × 16%, , = ` 1,50,000, , Debt, , = ` 9,37,500, , Calculation of Earnings per share (EPS), EPS =, , 6., , (a), , (EBIT-Int)(1-t) (` 4,00,000 - ` 1,50,000)0.5, =, = ` 1.25, 1,00,000, N, , Calculation of Degree of Operating (DOL), Financial (DFL) and, Combined leverages (DCL)., , DOL =, , ` 3, 40,000 - ` 60,000, ` 2,20,000, , = 1.27, , DFL =, , ` 2,20,000, ` 1,60,000, , = 1.38, , DCL = DOL × DFL = 1.27 × 1.38 = 1.75, , © The Institute of Chartered Accountants of India
Page 39 :
FINANCING DECISIONS - LEVERAGES, (b), , 6.39, , Earnings per share at the new sales level, (i) Increase, by 20%, , (ii) Decrease by, 20%, , (`), , (`), , 4,08,000, , 2,72,000, , Less: Variable expenses, , 72,000, , 48,000, , Less: Fixed cost, , 60,000, , 60,000, , 2,76,000, , 1,64,000, , 60,000, , 60,000, , 2,16,000, , 1,04,000, , 75,600, , 36,400, , Earnings after taxes (EAT), , 1,40,400, , 67,600, , Number of equity shares, , 80,000, , 80,000, , 1.76, , 0.85, , Sales level, , Earnings before interest and taxes, Less: Interest, Earnings before taxes, Less: Taxes, , EPS, Working Notes:, , (i) Variable Costs = ` 60,000 (total cost − depreciation), (ii) Variable Costs at:, , 7., , (a), , Sales level of ` 4,08,000 = ` 72,000 (increase by 20%), , (b), , Sales level of ` 2,72,000 = ` 48,000 (decrease by 20%), , Workings:, Total Assets, , = ` 20 crores, , Total Asset Turnover Ratio, , = 2.5, , Hence, Total Sales, , = 20 × 2.5 = ` 50 crores, , Computation of Profit after Tax (PAT), (`) in crores, Sales, , 50.00, , Less: Variable Operating Cost @ 65%, , 32.50, , © The Institute of Chartered Accountants of India
Page 40 :
6.40, , FINANCIAL MANAGEMENT, , Contribution, , 17.50, , Less: Fixed Cost (other than Interest), , 4.00, , EBIT, , 13.50, , Less: Interest on Debentures (15% × ` 10 crores), , 1.50, , PBT, , 12.00, , Less: Tax @ 30%, , 3.60, , PAT, , 8.40, , (i), , Earnings per Share, EPS =, , ` 8.40 crores, , Number of Equity Shares, , =, , ` 8.40 crores, 50,00,000, , = ` 16.80, , It indicates the amount, the company earns per share. Investors use this as, a guide while valuing the share and making investment decisions. It is also, an indicator used in comparing firms within an industry or industry, segment., (ii), , Operating Leverage, Operating Leverage =, , Contribution, EBIT, , =, , ` 17.50 crores, , ` 13.50 crores, , = 1.296, , It indicates the choice of technology and fixed cost in cost structure. It, is level specific. When firm operates beyond operating break-even, level, then operating leverage is low. It indicates sensitivity of earnings, before interest and tax (EBIT) to change in sales at a particular level., (iii), , Financial Leverage, Financial Leverage =, , EBIT, PBT, , =, , ` 13.50 crores, , ` 12.00 crores, , = 1.125, , The financial leverage is very comfortable since the debt service, obligation is small vis-à-vis EBIT., , © The Institute of Chartered Accountants of India
Page 41 :
FINANCING DECISIONS - LEVERAGES, (iv), , 6.41, , Combined Leverage, Combined Leverage =, , Contribution, EBIT, , ×, , EBIT, PBT, , Or,, = Operating Leverage × Financial Leverage, = 1.296 × 1.125 = 1.458, The combined leverage studies the choice of fixed cost in cost structure, and choice of debt in capital structure. It studies how sensitive the, change in EPS is vis-à-vis change in sales. The leverages, operating,, financial and combined are used as measurement of risk., 8., , (i) Operating Leverage (OL), Situation-I, (`), , (`), , Sales (3000 units @ ` 30 per unit), , 90,000, , 90,000, , Less: Variable Cost (@ ` 15 per unit), , 45,000, , 45,000, , Contribution (C), , 45,000, , 45,000, , Less: Fixed Cost, , 15,000, , 20,000, , EBIT, , 30,000, , 25,000, , Operating Leverage (OL) =, (ii), , Situation-II, , C, EBIT, , =, , ` 45,000, ` 30,000, , =, , = 1.5, , ` 45,000, ` 25,000, , = 1.8, , Financial Leverage (FL), A (`), Situation I, EBIT, , Less: Interest on debt, EBT, Financial Leverage (FL) =, , EBIT, EBT, , © The Institute of Chartered Accountants of India, , =, , B (`), , 30,000, , 30,000, , 2,000, , 1,000, , 28,000, , 29,000, , ` 30,000, ` 28,000, , = 1.07, , =, , ` 30,000, ` 29,000, , = 1.034
Page 42 :
6.42, , FINANCIAL MANAGEMENT, A (`), , B (`), , Situation-II, EBIT, Less: Interest on debt, EBT, Financial Leverage (FL) =, , (iii), , EBIT, EBT, , =, , 25,000, , 25,000, , 2,000, , 1,000, , 23,000, , 24,000, , ` 25,000, ` 23,000, , = 1.09, , =, , ` 25,000, ` 24,000, , = 1.04, , Combined Leverage (CL), A, , B, , Situation-I, CL = FL x OL, , 1.5×1.07 = 1.61, , 1.5 × 1.034 = 1.55, , 1.8 × 1.09 = 1.96, , 1.8 × 1.04 = 1.872, , Situation-II, CL = FL x OL, 9., , Statement showing Profitability of Alternative Schemes for Financing, (₹ in ‘00,000), Particulars, , Existing, , Alternative Schemes, (i), , (ii), , (iii), , 10, , 10, , 10, , 10, , -, , 10, , 5, , -, , 10, , 20, , 15, , 10, , 7% debentures, , 10, , 10, , 10, , 10, , 6% debentures, , -, , -, , 5, , 10, , 20, , 30, , 30, , 30, , 0.7, , 0.7, , 0.7, , 0.7, , Equity Share, (existing), , capital, , New issues, , Debenture interest (7%), , © The Institute of Chartered Accountants of India
Page 43 :
FINANCING DECISIONS - LEVERAGES, Debenture interest (6%), , 6.43, , -, , -, , 0.3, , 0.6, , 0.7, , 0.7, , 1.0, , 1.3, , Output (units in lakh), , 1, , 1.5, , 1.5, , 1.5, , Contribution per. unit, (₹) (Selling price Variable Cost), , 20, , 22, , 22, , 22, , Contribution (₹ lakh), , 20, , 33, , 33, , 33, , Less: Fixed cost, , 10, , 15, , 15, , 15, , EBIT, , 10, , 18, , 18, , 18, , 0.7, , 0.7, , 1.0, , 1.3, , EBT, , 9.3, , 17.3, , 17, , 16.7, , Less: Tax (40%), , 3.72, , 6.92, , 6.8, , 6.68, , EAT, , 5.58, , 10.38, , 10.20, , 10.02, , Operating, Leverage, (Contribution /EBIT), , 2.00, , 1.83, , 1.83, , 1.83, , Financial, (EBIT/EBT), , Leverage, , 1.08, , 1.04, , 1.06, , 1.08, , Combined, Leverage, (Contribution/EBT), , 2.15, , 1.91, , 1.94, , 1.98, , EPS (EAT/No. of shares), (₹), , 5.58, , 5.19, , 6.80, , 10.02, , Risk, , -, , Lowest, , Lower, than, option (3), , Highest, , Return, , -, , Lowest, , Lower, than, option (3), , Highest, , Less:, Interest, calculated above), , (as, , © The Institute of Chartered Accountants of India
Page 44 :
6.44, , FINANCIAL MANAGEMENT, , From the above figures, we can see that the Operating Leverage is same in, all alternatives though Financial Leverage differs. Alternative (iii) uses the, maximum amount of debt and result into the highest degree of financial, leverage, followed by alternative (ii). Accordingly, risk of the company will be, maximum in these options. Corresponding to this scheme, however,, maximum EPS (i.e., ` 10.02 per share) will be also in option (iii)., So, if Navya Ltd. is ready to take a high degree of risk, then alternative (iii) is, strongly recommended. In case of opting for less risk, alternative (ii) is the, next best option with a reduced EPS of ` 6.80 per share. In case of alternative, (i), EPS is even lower than the existing option, hence not recommended., 10., , (i), , Financial leverage, Combined Leverage, , = Operating Leverage (OL) × Financial Leverage (FL), , 2.5, , (ii), , = 2 × FL, , Or, FL, , = 1.25, , Financial Leverage, , = 1.25, , P/V Ratio and Earning per share (EPS), Operating leverage =, 2, , =, , Or, C, , Contribution(C), Contribution - Fixed Cost (FC), C, , C - 3,40,000, , = 2 (C – 3,40,000), , Or, C, , = 2C – 6,80,000, , Or, Contribution = ` 6,80,000, Now, P/V ratio, , =, , 6,80,000, Contribution (C), × 100 = 13.6%, × 100 =, 50,00,000, Sales (S), , Therefore, P/V Ratio = 13.6%, EBT, , = Sales – Variable Cost – Fixed Cost – Interest, , = `50,00,000 – `50,00,000 (1-0.136) – `3,40,000 – (8% × `30,25,000), = ` 50,00,000 – ` 43,20,000 – ` 3,40,000 – ` 2,42,000, = ` 98,000, PAT, , = EBT(1-T)= ` 98,000(1-0.3) = ` 68,600, , © The Institute of Chartered Accountants of India
Page 45 :
FINANCING DECISIONS - LEVERAGES, , (iii), , EPS, , =, , Profit after tax, No. of equity shares, , EPS, , =, , ` 68,600, = ` 0.202, 3,40,000 shares, , 6.45, , Assets turnover, Assets turnover =, , ` 50,00,000, Sales, =, = 0 .78, Total Assets * ` 34,00,000 ` 30,25,000, , 0.78 < 1.5 means lower than industry turnover., *Total Asset = Equity share capital + 8% Debentures, (iv) EBT zero means 100% reduction in EBT. Since combined leverage is 2.5,, sales have to be dropped by 100/2.5 = 40%. Hence new sales will be, ` 50,00,000 × (100 – 40) % = ` 30,00,000., Therefore, at ` 30,00,000 level of sales, the Earnings before Tax (EBT) of the, company will be zero., Alternatively, Required sales when EBT is zero =, , Fixed Cost + Interest + desired Profit, P/V Ratio, , =, , ` 3,40,000 + ` 2,42,000 + zero, 13.60%, , =, , ` 5,82,000, 13.60%, , = ` 42,79,412, [Note: The question can also be solved by first calculating EBIT with the help of, Financial Leverage. Accordingly answer to the requirement (ii) and (iv) will also, vary], , © The Institute of Chartered Accountants of India
Page 46 :
6.46, 11., , FINANCIAL MANAGEMENT, , Calculation of Degree of Operating leverage and Degree of Combined, leverage, Firm, , Degree of Operating, Leverage (DOL), , =, , % change in Operating Income, % change in Revenue, , Degree of Combined, Leverage (DCL), =, , % change in EPS, , % change in Revenue, , M, , 26%, = 0.929, 28%, , 32%, = 1.143, 28%, , N, , 34%, = 1.259, 27%, , 26%, = 0.963, 27%, , P, , 38%, = 1.520, 25%, , 23%, = 0.920, 25%, , Q, , 43%, = 1.870, 23%, , 27%, = 1.174, 23%, , R, , 40%, = 1.60, 25%, , 28%, = 1.120, 25%, , © The Institute of Chartered Accountants of India
 Learn better on this topic