Page 1 :
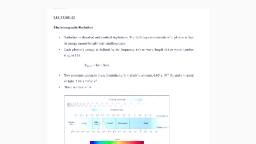
= Spectrophotometry, Basic Principles, , A spec i, Pectrophotometer is employed to measure the amount of light that a sample, , absorbs, i eC i, he bs. The Instrument operates by passing a beam of light through a sample and, suring the intensity of light reaching a detector,, , The ese of light consists of a stream of photons, represented by the purple balls in the, ve ation «> 3g : When a photon encounters an analyte molecule (the analyte is, molecule being studied), there is a chance the analyte will absorb the photon. This, , absorption reduces the number of photons in the beam of light, thereby reducing the, intensity of the light beam., , A spectrophotometer is commonly used for the measurement of transmittance or, reflectance of solutions, transparent or opaque solids, such as polished glass, or gases., However they can also be designed to measure the diffusivity on any of the listed light, ranges that usually cover around 200nm - 2500nm using different controls, and calibrations. Within these ranges of light, calibrations are needed on the machine, , using standards that vary in type depending on the wavelength of the photometric, determination., , We can visualize this process by running the simulation shown below. Click on, the Start button to start the simulation and the Stop button to stop the simulation., , The light source is set to emit 10 photons per second. Watch the motion of the photons, and observe how some of the photons are absorbed (removed) as the beam of light, passes through the cell containing the sample solution. The intensity of the light, reaching the detector is less than the intensity emitted by the light source., , Number of Photons Detected:, Elapsed Time: sec, , Intensity of Detected Light: photons/sec, , i, rd, , * Intensity of Light from the Source:, 10.00 photons/sec, , Light, , Sinaree bse Cell: Detector, , Types of spectrophotometry, , 1. UV Visible Spectrophotometry, , The most common spectrophotometers are used in the UV and visible regions of the, spectrum, and some of these instruments also operate into the near-infrared region as well., , , , Scanned with CamScanner
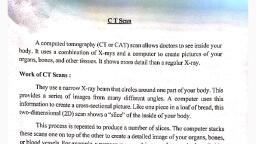
Page 2 :
Visible-rep;, -Tegion 400~ : i, : kn . 00-700 nm spectrophotometry is used extensively in colorimetry science. It, , ae = la Mt operates best at the range of 0.2-0.8 O.D. Ink manufacturers, printing, , : extiles vendors, and many more, need the data provided through colorimetry., y take Teadings in the region of every 5-20 nanometers along the visible region, and, produce a spectral reflectance curve or a data stream for alternative presentations. These, ee can be used to test a new batch of colorant to check if it makes a match to, Specifications, e.g., ISO printing standards., , Applications, , , , The, , ¢ Estimating dissolved organic carbon concentration, © Specific Ultraviolet Absorption for metric of aromaticity, * Bial's Test for concentration of pentoses, , 2. IR Spectrophotometry, , Infrared spectroscopy (IR spectroscopy) is the spectroscopy that deals with, the infrared region of the electromagnetic spectrum, that is light with a, longer wavelength and lowerfrequency than visible light. It covers a range of techniques,, mostly based on absorption spectroscopy. As with all spectroscopic techniques, it can be used, to identify and studychemicals. For a given sample which may be solid, liquid, or gaseous,, the method or technique of infrared spectroscopy uses an instrument called an infrared, spectrometer (or spectrophotometer) to produce an infrared spectrum. A basic IR spectrum, is essentially a graph of infrared light absorbance (or transmittance) on the vertical axis vs., frequency or wavelength on the horizontal axis. Typical units of frequency used in IR spectra, are reciprocal centimeters (sometimes called wave numbers), with the symbol cm’!. Units of, IR wavelength are commonly given in micrometers (formerly called "microns"), symbol pm,, which are related to wave numbers in a reciprocal way. A common laboratory instrument that, uses this technique is a Fourier transform infrared (FTIR) spectrometer., , , , 3. Spectrophotometers, , Spectroradiometers, which operate almost like the visible region spectrophotometers, are, designed to measure the spectral density of illuminants. Applications may include evaluation, and categorization of lighting for sales by the manufacturer, or for the customers to confirm, the lamp they decided to purchase is within their specifications. Components:, , 1. The light source shines onto or through the sample., 2. The sample transmits or reflects light., , 3. The detector detects how much light was reflected from or transmitted through the, sample., , 4. The detector then converts how much light the sample transmitted or reflected into a, number., , Experimental Procedure, , The following simulation illustrates the procedures for making spectrophotometric, measurements,, , Scanned with CamScanner
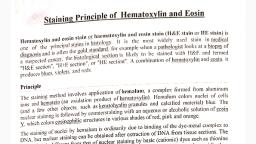
Page 3 :
First, the intensity of light (J) passing through a blank is measured. The, intensity is the number of photons per second. The blank is a solution that 1s, identical to the sample solution except that the blank does not contain the, , solute that absorbs light, This measurement is necessary, because the cell itself, scatters some of the light., , Second, the intensity of light (J) passing through the sample solution is, measured. (In practice, instruments measure the power rather than the, intensity of the light. The power is the energy per second, which is the product, of the intensity (photons per second) and the energy per photon.), , * Third, the experimental data is used to calculate two quantities:, the transmittance (7) and the absorbance (A)., , I, Pe es, Io, A=-logio T, , The transmittance is simply the fraction of light in the original beam that passes through the, sample and reaches the detector. The remainder of the light, 1 - 7, is the fraction of the light, absorbed by the sample. (Do not confuse the transmittance with the temperature, which often, is given the symbol 7.), , - In most applications, one wishes to relate the amount of light absorbed to the, concentration of the absorbing molecule. It turns out that the absorbance rather than the, transmittance is most useful for this purpose. If no light is absorbed, the absorbance is, zero (100% transmittance). Each unit in absorbance corresponds with an order of, magnitude in the fraction of light transmitted. For A = 1, 10% of the light is transmitted, (T= 0.10) and 90% is absorbed by the sample. For A = 2, 1% of the light is transmitted, and 99% is absorbed. For A = 3, 0.1% of the light is transmitted and 99.9% is absorbed., , Using the simulation below, perform the following steps:, , ¢ Measure the intensity of light passing through the blank., , Measure the intensity of light passing through the sample., Calculate the transmittance. ©, , Calculate the absorbance., , Note: For each measurement, run the simulation long enough to detect at least 1000, , photons. There is substantial random error in the intensity, and the more photons that are, counted, the lower the relative uncertainty in the results,, , Blank © Sample, Number of Photons Detected:, Elapsed Time: sec, , Intensity of Detected Light: photons/sec, , Scanned with CamScanner