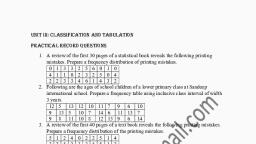
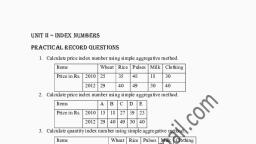
Page 1 : UNIT III: CLASSIFICATION AND TABULATION, PRACTICAL RECORD QUESTIONS, 1. A review of the first 30 pages of a statistical book reveals the following printing, mistakes. Prepare a frequency distribution of printing mistakes., 0 1 3 3 2 5 6 0 1 0, 4 1 1 0 2 3 2 5 0 4, 2 2 3 3 4 6 1 4 3 2, 2. Following are the ages of school children of a lower primary class at Sandeep, international school. Prepare a frequency table using inclusive class interval of width, 3 years., 12 5 13 12 10 11 7 9 6 10, 9 13 5 10 7 14 6 11 13 7, 9 8 11 10 8 12 13 9 6 14, 3. A review of the first 40 pages of a text book reveals the following printing mistakes., Prepare a frequency distribution of the printing mistakes., 5 1 2 4 0 2 2 5 1 4, 3 2 4 2 3 3 4 5 1 2, 3 4 5 3 0 4 2 6 1 2, 4 2 3 6 2 3 2 2 2 4, 4. Following is the data regarding number of children per couple in a certain locality., Tabulate the given data, 0 1 2 4 3 4 4 1 0 2, 1 2 3 4 2 3 2 3 1 3, 4 2 3 1 0 0 2 3 2 3, 5. The following are the weights of 20 students. Form a frequency distribution with class, intervals (35-39), (40-44), (45-49) and so on., 35, 51, 48, 43, 54, 46, 43, 42, 41, 35, 40, 41, 42, 44, 55, 50, 54, 35, 40, 43, 6. Form an exclusive type of frequency table with class intervals of width Rs 2 each, from the following data of daily wages received by 30 workers in a certain factory., 16 14 16 14 23 19 18 17 20 21, 12 11 15 16 17 20 22 13 15 24, 12 23 14 20 17 21 22 18 18 19, 7. The following are the percentages of marks of 48 students in an examination., a) Form a frequency distribution with class intervals (0-19),(20-29),(30-34),(3539),(40-44),(50-59),(60-69),(70-79)., b) Form exclusive type of frequency distribution with class intervals of width 8, marks, 47, 33, 46, 17, 38, 10, 36, 29, 40, 22, 40, 65, 32, 36, 42, 76, 50, 30, 34, 25, 36, 39, 36, 42, 15, 30, 39, 53, 47, 64, 31, 07, 39, 43, 62, 30, 32, 39, 24, 57, 37, 47, 27, 43, 43, 54, 40, 39, 8. Form a frequency table from the following data regarding marks scored by 30, students of I.PU class, using exclusive type, taking 10 as width of the class interval., 69 83 48 56 71 40 63 78 81 60, 86 98 70 63 59 72 56 61 80 54, 73 61 81 69 73 58 50 60 63 74, ANJUM SULTANA, , IPUC, ,
[email protected]
Page 2 : 9. Following data gives ages of 40 school children. Form a frequency table using, inclusive type taking 3 as width of the class interval., 8 12 4 9 10 6 13 5 10 12, 6 8 7 10 9 7 11 12 8 5, 13 14 12 9 6 14 8 10 9 14, 9 5 8 6 10 9 11 12 4 13, 10. Following data gives weekly wages in Rs. Of 32 employees of a firm. Form a, frequency table with 10 as width of the class interval taking (60-69) as one of the, class interval., 68 73 54 89 93 70 85 98, 65 69 76 88 84 75 90 88, 81 80 73 68 70 79 83 80, 69 90 93 86 71 80 82 78, 11. The following are the marks secured by 48 students out of maximum of 50, in an, entrance exam. Form a frequency distribution with class interval of 5 each., 15 27 21 18 21 10 07 0, 08 02 10 29 01 04 11 20, 12 16 18 28 24 23 32 20 24 16 15 14 25 34 15 05, 30 22 17 13 03 17 19 14 11 16 19 15 08 15 19 06, 12. Following are the marks obtained by a class of 60 students in an examination., Construct a frequency table with class interval as 0-9 , 10-19, 20-29, …. Etc., 34, 48, 30, 40, 14, 16, 54, 22, 30, 51, 18, 22, 27, 19, 55, 30, 39, 10, 21, 26, 60, 32, 40, 38, 40, 38, 51, 34, 59, 11, 45, 61, 52, 19, 15, 22, 04, 19, 42, 40, 07, 35, 30, 17, 23, 43, 14, 18, 45, 50, 48, 47, 53, 25, 35, 36, 38, 49, 26, 28, 13. Form a bivariate frequency distribution for the following data., Ages of, 26 27 25 26 27 27 26 27 28 28 27 25 28 26 27, husbands, Ages of, 19 21 19 20 21 19 20 20 22 21 21 20 22 21 21, wives, 14. Prepare a bivariate frequency distribution for the marks obtained in statistics and, English by 20 students, Marks 23, 20, 25, 22, 25, 22, 23, 25, 23, 22, in stats, Marks 10, 12, 15, 14, 14, 10, 12, 15, 12, 11, in, English, Marks 22, 21, 25, 23, 23, 23, 21, 29, 21, 22, in stats, Marks 12, 12, 15, 10, 14, 11, 11, 10, 11, 10, in, English, 15. Below are the marks given by marks obtained by a batch of 22 students in maths and, stats. Prepare a bivariate frequency table., Maths 53, 54, 52, 32, 30, 60, 47, 46, 35, 28, 25, ANJUM SULTANA, , IPUC, ,
[email protected]
Page 3 : Stats, , 58, , 55, , 25, , 32, , 20, , 85, , 44, , 80, , 33, , 72, , 10, , Maths 42, Stats 42, , 33, 15, , 48, 46, , 72, 50, , 51, 64, , 45, 39, , 33, 33, , 65, 30, , 29, 36, , 35, 40, , 40, 52, , 16. Below are the ages of husbands and wives prepare a bivariate frequency distribution, table with suitable width?, Ages of, 28, 42, 29, 47, 35, 41, 33, 36, 29, 38, husbands, Ages of, 24, 37, 25, 37, 23, 39, 23, 32, 24, 38, wives, Ages of, 27, 40, 26, 41, 25, 38, 31, 35, 29, 47, husbands, Ages of, 23, 30, 25, 35, 21, 34, 20, 29, 25, 34, wives, 17. The data given below relate to the marks obtained by 20 students in two subjects., Represent the data by a bivariate frequency table with class intervals 15-25, 25-35,….., and so on for subject A and 62-64,64-66,…… and so on for subject B., Subject 52, 70, 35, 36, 37, 48, 24, 17, 28, 43, A, Subject 67, 70, 65, 65, 64, 69, 63, 65, 70, 71, B, Subject 29, 63, 39, 22, 34, 40, 32, 20, 48, 29, A, Subject 62, 70, 67, 63, 68, 67, 69, 66, 68, 67, B, 18. Below are the ages of husbands and wives prepare a bivariate frequency distribution, with suitable width., Ages of, 24, 25, 24, 26, 21, 28, 30, 24, 33, 30, husbands, Ages of, 23, 22, 24, 25, 20, 25, 29, 21, 29, 28, wives, Ages of, 28, 24, 27, 28, 29, 30, 31, 30, 25, 24, husbands, Ages of, 24, 22, 26, 27, 27, 30, 29, 28, 24, 23, wives, 19. Draft a blank table, ready to be filled showing the distribution of population in a, village classified according to, a) Sex : men , women, b) Occupation: agriculturist and non-agriculturist., c) Marital status : married, single., 20. Draft a blank table to show the distribution of workers of a factory according to, a) Sex : male, female, b) Age groups in years : below 30, 30-40, 40 and above., c) Salary grades : below Rs.5000, Rs.5000 – 10000 and Rs. 10000 and above., 21. Draft a blank table to show the classification of the population of a town according to, ANJUM SULTANA, , IPUC, ,
[email protected]
Page 4 : a) Sex : men , women, b) Religion : Hindu, Muslim and others, c) Literacy : literates and illiterates, 22. Draft a blank table to show:, a) Sex : men , women, b) Ranks : supervisors , assistants and clerks, c) Age group in years : 20-30 , 30-50 and 50-60., 23. Draft a neat blank table to present the data relating to the college students according, to faculty – arts , commerce and science, classes – I PUC & II PUC , sex – boys and, girls for the year 2011 – 12., 24. Prepare a blank table to show the population of a town according to, a) sex : men , women, b) age group in years : (0-25), (25-50) , 50 and above, c) periods : 2008,2009,2010., 25. In a sample study regarding smoking habit in a town, the following data were, obtained., Men population = 58%, Smokers = 22%, Men smokers = 18%, Tabulate the above data., 26. Tabulate the following data about coffee drinking habit in two towns A and B, Town A, Town B, 55% were males, 52% were males, 28% were coffee drinkers, 25% were coffee drinkers, 18% were male coffee drinkers, 16% were male coffee drinkers, 27. Out of a total number of 10000 candidates who have applied for jobs in a government, department , 6854 were males, 3146 were graduates and others non graduates. The, number of candidates with some experience were 27623 of whom 1860 were males., The number of male graduates was 2012. The number of graduates with experience, was 1093 that includes 323 females. Tabulate the above information., 28. Present the following information in the table., In the year 2005 there were 200 banks out of which 50 were private banks, in these, fifty banks 10 had ATM facility and non of the nationalized banks had this facility. In, the year 2010, there was an increase of 50 more banks in the private sectors and 180, in nationalized banks. Total number of banks had ATM facility in 2010 is 100 and 75, private sector bank has this facility., 29. Tabulate the following information giving in a suitable title., In 2005 out of 1750 workers of a factory, 200 workers were members of trade union., The number of women employed was 200 of which 175 did not belong to trade union., 2010 the number of union workers increased to 1580 of which 1290 were men, on the, other hand the number of non-union workers fell down to 208 of which 180 were, men., 30. In a sample study about the food habits in two towns, the following information was, obtained., Town A, Town B, 55% were males, 52% were males, 35% were non vegetarians, 28% were non vegetarians, 28% were male non vegetarians, 26% were male non vegetarians, ANJUM SULTANA, , IPUC, ,
[email protected]
Page 5 : 31. In Hubli there were 20 lakh people, out of this, 7 lakh people lived in central Hubli,, and the rest in surrounding areas. In central Hubli there were 3 lakh male people, out, of which 2 lakh were literate. In central Hubli, 1 lakh ladies were illiterates. In, surrounding areas there were 10 lakh male people, out of which 7 lakh were literate,, in surrounding areas literate ladies were lakh. Tabulate the above information., 32. An election conducted in a public sector for the years 2000 and 2001 gave the, following results., In the year 2000, 46% voted for candidate A, 35% for B and rest for C, In the year 2001, there was an increase by 10% for candidate A and reduction of 6%, for candidate C. present the following information in a tabular form., , ANJUM SULTANA, , IPUC, ,
[email protected]