Page 1 :
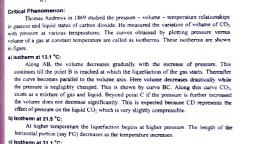
Andrews Isotherms of CO,, , * 1. Isotherm at 13.1 °C; It consists of three parts:, , (i) Curve AB : At point A, CO2 exists in the, gaseous form at low P. As the P is increased,, the V decreases along the curve AB., Curve AB represents the compression of, COz gas. At point B, the liquefaction starts, and V decreases suddenly., , ii) Horizontal portion BC: Along BC,, gaseous CO2 converts in to liquid form, , and V decreases rapidly (since, the liquid, , , , has much less volume than the gas).
Page 2 :
—~ Andrews Isotherms of CO,, , e 1. Isotherm at 13.1 °C:, , ¢ As both the liquid and vapour phases are in equilibrium, so P remains, constant (equal to saturated V.P. of liquid CO2 at 13.1 °C)., , * Amount of liquid phase increases and gaseous phase decreases till at C,, all the gas has been converted in to the liquid., (iii) Vertical curve CD: Curve CD represents the P-V curve of liquid, CO2. Along CD, there is small change in V, by increasing P since the liquid is not, compressible., Thus, in the curve ABCD:, Along AB : Gaseous COz, Along BC: Liq CO2 in eqb. with vapours, Along CD : liquid COz
Page 3 :
Andrews lsotherms of CO,, , . Isotherm at 21.5 °C:, Itis similar to isotherm at 13.1 °C except, the horizontal portion FG of the isotherm, is shorter., As the T is raised, the horizontal portion, , becomes smaller and smaller until at 31.1 °C,, it reduces to a point at L., , 3. Isotherm at 31.1 °C:, , * Inthis isotherm, horizontal portion becomes, , , , of : ¥ ae DV an Fig. tsotherms of CO, at different, zero. KL portion represents the P-V curve of Nempacabanen:, CO2 gas., , * At point L, liquid CO2, phase disappears. The gas and liquid have same density., , appeared. The boundary between liquid and gas
Page 4 :
Andrews lsotherms of CO,, , Beyond L, the isotherm becomes nearly parallel, to the vertical axis since, the liquid is not, , compressible., , 4. Isotherms above 31.1 °C:, , In the isotherms above 31.1 °C, the horizontal, portion completely,cisappears. CO, exists only, in gaseous form., , No liquefaction takes place above this T,, howsoever high P may be applied., , Thus, 31.1 °C is the critical T of CO2., Corresponding P (72.9 atm) is critical P.
Page 5 :
Continuity of state, , ° From fig., if the ends of horizontal portions, of isdtherms are joined together, a parabolic, curve is obtained., , © The peak of parabola represents critical point., , * With in parabola, liquid and vapour exist, , together in equilibrium., , , , , , , , * Outside the parabola, substance exists only as, , , , gas under the conditions on R.H.S and only as, liquid under the conditions on L.H.S., , * Andrew suggested that below T,, it is possible to change a, substance from gaseous state to liquid state without any sharp, discontinuity i.e. without having both the phases present, together at any stage. This is known as Principle of Continuity of, state,