Page 1 :
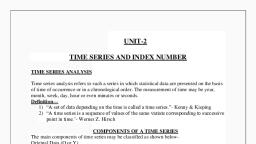
Prof. H. S. Kulkarni, , Time Series Analysis, , Introduction:, There are many factors which changes with time i.e. as time changes, there, value also changes., , E.g. The population of country, The profit of a company for various year, price level of, commodity in different years etc., , Definition of Time Series:, “A time series is a sequence of values of some variable corresponding to, successive points of time”., , “If the statistical data are arranged according to chronological order, (time),then such series is called as time series”., , , , Utility of time series:, The purpose of time series analysis is to measure the chronological variation., , The objective of analysis of time series are as follows:, *To give a general description of the behaviour of the series., *To analysis the post behaviour., *To forecast the future with help of post behaviour., , The_uses of time series are as follows:, It helps in understanding post behaviour., It helps in planning future operations., It helps in description of causes & factor operating in present., It facilitates comparison of different time series., , Mathematical model of time series:, , Mathematically time series is defined as a functional relationship y=f(t), Here,, , y is the value of variable under consideration of time(t), , t has an independent behaviour and y has dependent behaviour., , t=t1,t2...., y=y1,y2, , tn, yn, , , , , , Component of time series:, There are 4 types of basic factors which cause fluctuation of a time series., They are as follows:, Secular trend or Trend (T), Seasonal Variations (s), Cyclical Variations (c), Irregular Variations (I)
Page 2 :
Prof. H. S. Kulkarni, , Secular Trend or Trend (T):, A secular trend is the long pattern of a time series. It is defined as:, , “The basic tendency of a variable do increase or decrease or remain constant, over a long period, is called Secular Trend”., , If we plot the graph of time series, we will find that the graph with all its, fluctuation will be increasing or falling., , eg., , There is an increasing trend in the data relating to population, literacy etc., , Increasing trend Decreasing trend, There is decreasing trend in the data relating to death rate, illiteracy etc., , Constant trend is that, where the values of variable remain constant over long period, , of time., , Constant trend, , e.g. In particular temperature of a place in a month in various years remains more, or less constant., , Seasonal Variations (s):, , Seasonal variation is a short term variation which occurs regularly every year, & has a span of less than a year., , Seasonal fluctuations do not appear whenever time series has only annual, total figures. The factors responsible for seasonal variations are:, , > Climate & Weather Condition:, , The sales of umbrellas, raincoats increase in rainy season. Demand for, electric fans, sunglasses, hats increase in summer., , 2
Page 3 :
Prof. H. S. Kulkarni, , > Customs, Tradition & Festivals:, The demand for cloth, sweets increases during festivals, there is greater, demand for gold, costly cloths during wedding season., , » Practical Needs:, There are large withdrawals on the 1“ of every month by employers, the, demand for electricity is very high during certain hours of a day., , Cyclic Variations(c):, , The variation in time series that usually last more than one year are known as, Cyclic Variations. The Variations are due to up& down recurring after a period more, than one year., There are 4 well defined periods inn business cycle., , 1) Prosperity, , 2) Recession, 3) Depression, 4) Recovery, Prosperity, s, 3 , \, 8 Recession, 3 Recovery, 3 :, a Depression, , , , Time, , Fig. 1 : The Phases of Business Cycle, , Irregular Variations (I):, , Irregular Variation are also called random variation or accidental variation. This, kind of variation are caused due to number of factors like floods, earthquake, fires,, drought, strikes, wars, etc. This variations are beyond the control of human., , Mathematical Models of Time Series:, The following are two models commonly used for the composition of series into, compounds., 1) Additive Model, 2) Multiplicative Model, , 1) Additive Model:, According to additive model, the time series can be expressed as, y=T+S+C+l
Page 4 :
Prof. H. S. Kulkarni, , Where,, , y= The value of time series of time T, , T= Trend, , S= Seasonal Variation, C= Cyclic Variation, , |= Irregular Variation, , 2) Multiplicative Model:, , According to this model, the time series can be expressed as a product of, , components., Its mathematical model is given as, y=T*S*CAl, , Distinguish Between Seasonal Variation & Cyclic Variation:, , , , , , , , , , , , , , , , , , a Seasonal Variation Cyclic Variation, , .No., , 1 The Seasonal Variation are caused by | The Cyclic Variations are caused by Business, Seasons. cycles., , 2 This Variations are regular. This Variations are irregular., , 3 The period of Seasonal Variation is A period of Cyclic Variation is from 3 to 10, less than one year. years., , 4 The Variations are predictable. This Variations are less predictable than, , Seasonal Variation., , , , Distinguish Between Additive Model & Multiplicative Model:, , , , , , , , , , , , , , SR.NO. Additive Model Multiplicative Model, , 1 This Model assumes that observed This Model assumes that the observed value, value is the sum of 4 components is the product of 4 components, y= T+S+#CH1 y= T*S*C*l, , 2 In this case S,C& | are absolute Variable | Here, S,C&l are expressed as rates or index, about trend value. number., , 3 It assume that all components are It assume that all component are not, independent of each other. independent of each other., , 4 It assume that, the behaviour of It assume that, the behaviour of component, component is of additive nature. is of multiplicative nature.
Page 5 :
Prof. H. S. Kulkarni, , , , , , , , It is not appropriate for the future, events., , , , It is appropriate for the future behaviour in, time series.