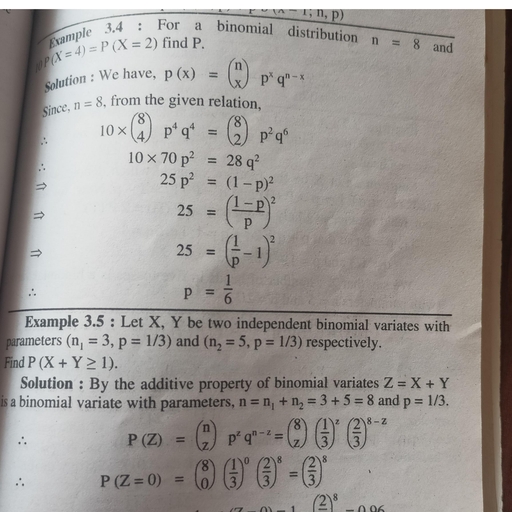
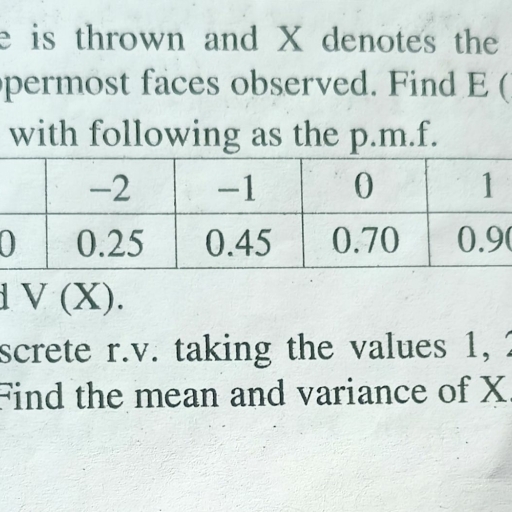
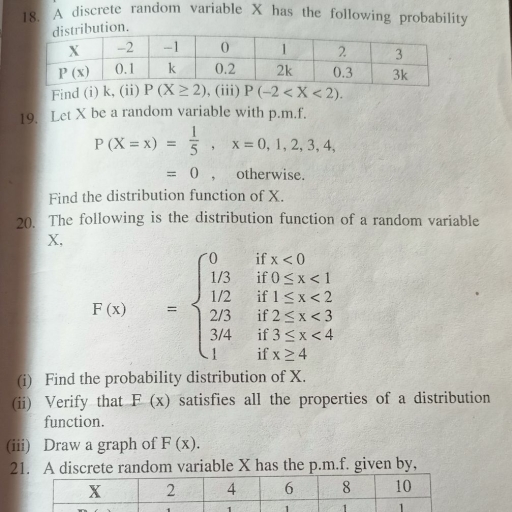
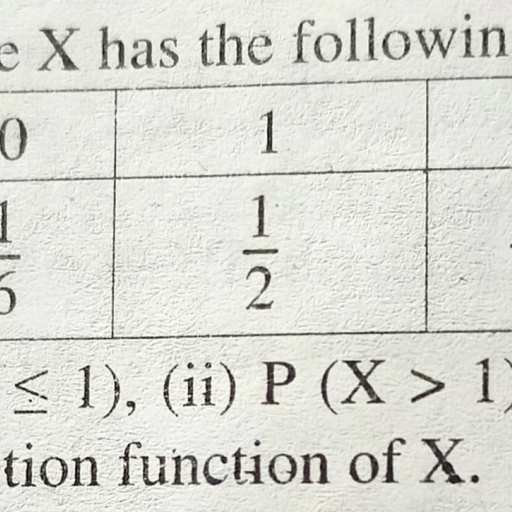
Page 1 :
Prof. Kulkarni H. S., , Statistical Quality Control, , Defining Quality:, Quality can be defined as fitness for use., , Defining Statistical Quality Control, , Statistical quality control is defined as the technique of applying statistical methods, based on the theory of probability and sampling to establish quality standard and to, maintain it in the most economical manner., , Need of Statistical Quality Control, , 1) It provides a means of detecting error at inspection., , 2) It leads to more uniform quality of production., , 3) It improves the relationship with the customer., , 4) It reduces inspection costs., , 5) It reduces the number of rejects and saves the cost of material., , 6) It provides a basis for attainable specifications., , 7) It points out the bottlenecks and trouble spots., , 8) It provides a means of determining the capability of the manufacturing process., 9) It promotes the understanding and appreciation of quality control., , CAUSES OF VARIATION, , Variation in manufactured products is inevitable; it is a fact of nature and industrial life., Even when a production process is well designed or carefully maintained, no two products, are identical. The difference between any two products could be very large, moderate, very, small or even undetectable depending on the sources of variation. The causes of variation, are broadly classified into two categories:, , 1. Chance causes, and, 2. Assignable causes., 1. Chance causes, , Chance causes are also known as random or natural or common causes. Even ina, well designed or carefully maintained production process, variability exists in the product, due to some natural/random causes. Even if the process is operated under the same, conditions, that is, the quality of raw materials used is same and there is no change in the, machine settings, operators or the environment, there is a specific pattern of variability in, the product. If variation due to chance causes is present in the production process, it is, still said to be under statistical control., , 2. Assignable causes., , Another kind of variability may be present occasionally in the output of a process., The causes of such type of variability are not due to the process design, but take place
Page 2 :
because of changes in raw material, machine, operator, environment or any other, component of the process. These causes are called assignable causes and are also, known as special or non-random or unnatural causes Accidental improper setting of the, machine, a worker falling ill and still continuing to work, change of operators or shift,, breakages, misreading of scales, batch of defective raw material, etc. are examples of, assignable causes. A process that is operating in the presence of assignable causes is, said to be an out-of-control process., , Techniques of Statistical Quality Control, , The important techniques used for statistical quality control can be broadly classified into, two categories: Statistical Process Control (SPC) or simply Process Control, ande Product, Control.e, , These techniques are further classified into different categories as shown in, Fig.1.1., , , , , , Control Chart Control Chart, for Variables for Attributes for Variables for Attributes, , Fig. 1.1: Classification of SQC techniques., , Different between Process Control & Product Control
Page 3 :
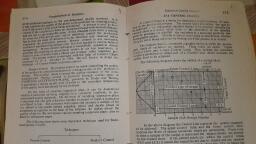
Process control, , Product control, , , , Controlling of process sequence or steps to, produce desired quality product is called, Process control., , The control which is used to decrease, defective items within different lots of, produced good is known as Product, control., , , , Process control is applied during production, process., , Product control is applied after production, process., , , , Process control is two types; Online quality, control and Offline quality control, , Product control is no type., , , , Process control is an integral stage of textile, manufacture., , Product control focus on sorting and, isolating defective product, , , , Process control used to reduce waste,, minimize costs and reduce the, environmental impact., , Tn Product control, the efforts are made to, identify, sort, and segregate the defective, product., , , , Tn process control, the end product of a, process may be or may not be fulfill the, desired quality., , In product control, the end product ofa, process should be fulfill the desired quality:, count, TPl, GSM, fastness property etc., , , , Process control used to control the excessive, breakages in different textile processing., , Product control used to fulfill the desired, qualities., , , , , , , , , , CONTROL CHARTS AND ITS CONSTRUCTION, , A control chart is a two-dimensional graphical display of a quality characteristic that has, been measured or computed in terms of mean or other statistic from samples and plotted, against the sample number or time at which the sample is taken from the process. The, concept of control chart is based on the theory of sampling and probability. In a control, chart, a sample statistic of a quality characteristic such as mean, range, proportion of, defective units, etc. is taken along the Y-axis and the sample number or time is taken along, the X-axis. A control chart consists of three horizontal lines, which are described below:, , 1. Centre Line (CL) — The centre line of a control chart represents the value which can, have three different interpretations depending on the available data. First, it can be, the average value of the quality characteristic or the average of the plotted points., , 2. Upper Control Line - The upper control line represents the upper value of the, variation in the quality characteristic. So this line is called upper control limit (UCL)., , 3. Lower Control Line - The lower control line represents the lower value of the, variation in the quality characteristic. So this line is called lower control limit (LCL).