Page 1 :
MODULE NO 1:, , INTRODUCTION, UNIT-1: INTRODUCTION TO SPREAD SHEET:, , Introduction to spread sheet:, A spreadsheet is a type of computer application that loves numbers and calculations. The first electronic spreadsheet was, named VisiCalc, short for visual calculator, and was created in 1979 for the Apple personal computer. ... For this reason, Excel, or another brand of spreadsheets, is readily available in many schools ., What is spreadsheet explain?, A spreadsheet is a computer application for organization, analysis, and storage of data in tabular form., Spreadsheets were developed as computerized analogs of paper accounting worksheets. The program operates on data, entered in cells of a table. ... A spreadsheet may also refer to one such electronic document., , What are the three types of spreadsheets?, For example, Microsoft Excel has three options for spreadsheet format: simple tables, Excel tables and pivot tables., Simple spreadsheets are the most commonly used type, and you have to make most changes manually., FEATURES OF SPREADSHEET SOFTWARE:, When most people think of spreadsheets, they think of data entry and simple calculations. But modern spreadsheet, software is more than a financial tool. These applications serve as a robust way to help collect, organize and analyze, important business data. While every product is different, most come standard with these features:, Rows and columns:, Through a spreadsheet's grid system of rows and columns, all of your information is neatly organized in one easy-to-read, space., Formulas and functions:, A spreadsheet allows you to design unique formulas to give you insight into your data. Many of these functions can, easily be used and displayed by either building a custom formula or function, or using one of the software's preset, options. This not only saves you time but also makes your data more accessible so you can use it to inform your, decisions.
Page 2 :
, , , , , , , , In a spreadsheet, functions evaluate values, while formulas are used to express the relationship of two or more cells in, that spreadsheet, using an equal sign. The most commonly used formulas include basic arithmetic, such as addition,, subtraction and multiplication. Frequently used functions include sum, average, count, and the minimum and maximum, functions. There are more advanced functions that help you manipulate variables, large sets of data and amounts of time., Data filtering and visualization:, You can create tables, dropdown lists, filters and other tools to organize the information in your, Spreadsheet. Most spreadsheet software also comes with built-in tools to showcase your data visually, including bar, charts, graphs and pie charts in a variety of styles and colors., Custom formatting:, With a few simple clicks, you can apply different formatting to separate information, create headers, merge cells into, larger boxes and otherwise customize the look and feel of your spreadsheet. You can also use conditional formatting, features to change the color or text style of a cell when certain information is present or missing. This can help you keep, tabs on specific information at a quick glance, instead of combing through each individual cell to find what you need., What are the advantages of spreadsheet?, Advantages of using spreadsheets, Formulae can be used to instantly recalculate totals. ..., You can carry out "what if?" investigations. ..., The information can be presented in different ways. ..., It is easy to make these changes, save your work and print it out again., What is the importance of spreadsheet?, Spreadsheets are an essential business and accounting tool., They can vary in complexity and can be used for various reasons, but their primary purpose is to organize and, categorize data into a logical format., Once this data is entered into the spreadsheet, you can use it to help organize and grow your business., , Office suite overview, The Microsoft Office suite is a set of programs for common productivity tasks, including a word processing, program, a spreadsheet tool, presentation software, an email program and others. Often abbreviated as the MS Office, suite, it's among the most popular software packages in the world, though it does face competition from other, commercial products, including some from Apple and Google and from open source packages such as LibreOffice. Parts, of the Microsoft suite of programs are available both for use in a web browser and local use on a computer., What Is Microsoft Office Suite?
Page 3 :
Microsoft Office is the collective name for Microsoft's set of home and business productivity software. The MS, suite of programs includes Microsoft Word, a word processing tool; Microsoft Excel, a spreadsheet program; Microsoft, PowerPoint, used for creating interactive presentations; Microsoft Outlook, used for email and calendar management;, Microsoft Access, a database management program; and Microsoft OneNote, a note-taking application., Microsoft Office programs have become the de facto standard for many of the categories of programs it includes,, especially word processing and spreadsheet use., , Introduction to spread sheets:, Microsoft Excel is a commercial spreadsheet application, written and distributed by Microsoft for Microsoft, Windows and Mac OS X. At the time of writing this tutorial the Microsoft excel version was 2010 for Microsoft, Windows and 2011 for Mac OS X., Microsoft Excel is a spreadsheet tool capable of performing calculations, analyzing data and integrating, information from different programs., By default, documents saved in Excel 2010 are saved with the .xlsx extension whereas the file extension of the, prior Excel versions is .xls., This chapter teaches you how to start an excel 2010 application in simple steps. Assuming you have Microsoft Office, 2010 installed in your PC, start the excel application following the below mentioned steps in your PC., Step 1 − Click on the Start button., , Step 2 − Click on All Programs option from the menu.
Page 4 :
Step 3 − Search for Microsoft Office from the sub menu and click it., , Step 4 − Search for Microsoft Excel 2010 from the submenu and click it., , This will launch the Microsoft Excel 2010 application and you will see the following excel window., , The following basic window appears when you start the excel application. Let us now understand the various important, parts of this window.
Page 5 :
File Tab, The File tab replaces the Office button from Excel 2007. You can click it to check the backstage view, where you come, when you need to open or save files, create new sheets, print a sheet, and do other file-related operations., Quick Access Toolbar, You will find this toolbar just above the File tab and its purpose is to provide a convenient resting place for the Excel's, most frequently used commands. You can customize this toolbar based on your comfort., Ribbon, , Ribbon contains commands organized in three components −, , , Tabs − They appear across the top of the Ribbon and contain groups of related commands. Home, Insert, Page, Layout are the examples of ribbon tabs., , , , Groups − They organize related commands; each group name appears below the group on the Ribbon. For, example, group of commands related to fonts or group of commands related to alignment etc., , , , Commands − Commands appear within each group as mentioned above., , Title Bar, This lies in the middle and at the top of the window. Title bar shows the program and the sheet titles.
Page 6 :
Help, The Help Icon can be used to get excel related help anytime you like. This provides nice tutorial on various subjects, related to excel., Zoom Control, Zoom control lets you zoom in for a closer look at your text. The zoom control consists of a slider that you can slide left, or right to zoom in or out. The + buttons can be clicked to increase or decrease the zoom factor., View Buttons, The group of three buttons located to the left of the Zoom control, near the bottom of the screen, lets you switch among, excel's various sheet views., , , Normal Layout view − This displays the page in normal view., , , , Page Layout view − This displays pages exactly as they will appear when printed. This gives a full screen look, of the document., , , , Page Break view − This shows a preview of where pages will break when printed., , Sheet Area, The area where you enter data. The flashing vertical bar is called the insertion point and it represents the, location where text will appear when you type., Row Bar, Rows are numbered from 1 onwards and keeps on increasing as you keep entering data. Maximum limit is 1,048,576, rows., Column Bar, Columns are numbered from A onwards and keeps on increasing as you keep entering data. After Z, it will start the, series of AA, AB and so on. Maximum limit is 16,384 columns., Status Bar, This displays the current status of the active cell in the worksheet. A cell can be in either of the four states, (a) Ready mode which indicates that the worksheet is ready to accept user inpu (b) Edit mode indicates that cell is, editing mode, if it is not activated the you can activate editing mode by double-clicking on a cell (c) A cell enters, into Enter mode when a user types data into a cell (d) Point mode triggers when a formula is being entered using a cell, reference by mouse pointing or the arrow keys on the keyboard., Dialog Box Launcher, This appears as a very small arrow in the lower-right corner of many groups on the Ribbon. Clicking this button, opens a dialog box or task pane that provides more options about the group., Basic text and Cell Formatting:, Formatting Cell
Page 7 :
MS Excel Cell can hold different types of data like Numbers, Currency, Dates, etc. You can set the cell type in various, ways as shown below −, , , Right Click on the cell » Format cells » Number., , , , Click on the Ribbon from the ribbon., , Various Cell Formats, Below are the various cell formats., , , General − This is the default cell format of Cell., , , , Number − This displays cell as number with separator., , , , Currency − This displays cell as currency i.e. with currency sign., , , , Accounting − Similar to Currency, used for accounting purpose., , , , Date − Various date formats are available under this like 17-09-2013, 17 th-Sep-2013, etc., , , , Time − Various Time formats are available under this, like 1.30PM, 13.30, etc., , , , Percentage − This displays cell as percentage with decimal places like 50.00%., , , , Fraction − This displays cell as fraction like 1/4, 1/2 etc., , , , Scientific − This displays cell as exponential like 5.6E+01., , , , Text − This displays cell as normal text., , , , Special − Special formats of cell like Zip code, Phone Number., , , , Custom − You can use custom format by using this., , , , You can assign any of the fonts that is installed for your printer to cells in a worksheet., Setting Font from Home, You can set the font of the selected text from Home » Font group » select the font.
Page 8 :
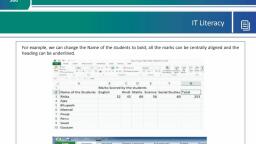
Setting Font from Format Cell Dialogue, , , , Right click on cell » Format cells » Font Tab, Press Control + 1 or Shift + Control + F, , You can change the text decoration of the cell to change its look and feel.
Page 9 :
Text Decoration, Various options are available in Home tab of the ribbon as mentioned below., , , Bold − It makes the text in bold by choosing Home » Font Group » Click B or Press Control + B., , , , Italic − It makes the text italic by choosing Home » Font Group » Click I or Press Control + I., , , , Underline − It makes the text to be underlined by choosing Home » Font Group » Click U or Press Control +, U., , , , Double Underline − It makes the text highlighted as double underlined by choose Home » Font Group » Click, arrow near U » Select Double Underline., , More Text Decoration Options, There are more options available for text decoration in Formatting cells » Font Tab » Effects cells as mentioned below., , , Strike-through − It strikes the text in the center vertically., , , , Super Script − It makes the content to appear as a super script., , , , Sub Script − It makes content to appear as a sub script.
Page 10 :
You can rotate the cell by any degree to change the orientation of the cell., Rotating Cell from Home Tab, Click on the orientation in the Home tab. Choose options available like Angle CounterClockwise, Angle Clockwise,, etc., , Rotating Cell from Formatting Cell, Right Click on the cell. Choose Format cells » Alignment » Set the degree for rotation., , You can change the background color of the cell or text color., Changing Background Color
Page 11 :
By default the background color of the cell is white in MS Excel. You can change it as per your need from Home tab », Font group » Background color., , Changing Foreground Color, By default, the foreground or text color is black in MS Excel. You can change it as per your need from Home tab », Font group » Foreground color., , Also you can change the foreground color by selecting the cell Right click » Format cells » Font Tab » Color.
Page 12 :
If you don’t like the default alignment of the cell, you can make changes in the alignment of the cell. Below are the, various ways of doing it., Change Alignment from Home Tab, You can change the Horizontal and vertical alignment of the cell. By default, Excel aligns numbers to the right and text, to the left. Click on the available option in the Alignment group in Home tab to change alignment., , Change Alignment from Format Cells, Right click on the cell and choose format cell. In format cells dialogue, choose Alignment Tab. Select the available, options from the Vertical alignment and Horizontal alignment options., Merge Cells, MS Excel enables you to merge two or more cells. When you merge cells, you don’t combine the contents of the cells., Rather, you combine a group of cells into a single cell that occupies the same space., You can merge cells by various ways as mentioned below.
Page 13 :
, , Choose Merge & Center control on the Ribbon, which is simpler. To merge cells, select the cells that you want, to merge and then click the Merge & Center button., , , , Choose Alignment tab of the Format Cells dialogue box to merge the cells., , Additional Options, The Home » Alignment group » Merge & Center control contains a drop-down list with these additional options −, , , Merge Across − When a multi-row range is selected, this command creates multiple merged cells — one for, each row., , , , Merge Cells − Merges the selected cells without applying the Center attribute., , , , Unmerge Cells − Unmerges the selected cells., , Wrap Text and Shrink to Fit, If the text is too wide to fit the column width but don’t want that text to spill over into adjacent cells, you can use either, the Wrap Text option or the Shrink to Fit option to accommodate that text.
Page 14 :
Exploring Alignment Options, 1. Horizontal Alignment − you can set horizontal alignment to Left, Centre, Right, etc., , , Left − Aligns the cell contents to the left side of the cell., , , , Center − Centers the cell contents in the cell., , , , Right − Aligns the cell contents to the right side of the cell., , , , Fill − Repeats the contents of the cell until the cell’s width is filled., , , , Justify − Justifies the text to the left and right of the cell. This option is applicable only if the cell is formatted as, wrapped text and uses more than one line., , 2. Vertical Alignment − you can set Vertical alignment to top, Middle, bottom, etc., , , Top Aligns the cell contents to the top of the cell., , , , Center Centers the cell contents vertically in the cell., , , , Bottom Aligns the cell contents to the bottom of the cell., , , , Justify Justifies the text vertically in the cell; this option is applicable only if the cell is formatted as wrapped, text and uses more than one line.
Page 15 :
Merge Cells:, MS Excel enables you to merge two or more cells. When you merge cells, you don’t combine the contents of the cells., Rather, you combine a group of cells into a single cell that occupies the same space., You can merge cells by various ways as mentioned below., , , Choose Merge & Center control on the Ribbon, which is simpler. To merge cells, select the cells that you want, to merge and then click the Merge & Center button., , , , Choose Alignment tab of the Format Cells dialogue box to merge the cells., , Additional Options:, The Home » Alignment group » Merge & Center control contains a drop-down list with these additional options −, , , Merge Across − When a multi-row range is selected, this command creates multiple merged cells — one for, each row.
Page 16 :
, , Merge Cells − Merges the selected cells without applying the Center attribute., , , , Unmerge Cells − Unmerges the selected cells., , Apply Borders, MS Excel enables you to apply borders to the cells. For applying border, select the range of cells Right Click » Format, cells » Border Tab » Select the Border Style., , Then you can apply border by Home Tab » Font group » Apply Borders., , Apply Shading, You can add shading to the cell from the Home tab » Font Group » Select the Color.
Page 17 :
Basic arthematic calculation:, For simple formulas, simply type the equal sign followed by the numeric values that you want to calculate and, the math operators that you want to use — the plus sign (+) to add, the minus sign (-) to subtract, the asterisk (*) to, multiply, and the forward slash (/) to divide., Arithmetic operators:, To perform basic mathematical operations such as addition, subtraction,, combine numbers; and produce numeric results, use the following arithmetic operators, Arithmetic operator, + (plus sign), – (minus sign), * (asterisk), , Meaning, Addition, Subtraction, Negation, Multiplication, , Example, 3+3, 3–1, –1, 3*3, , / (forward slash), % (percent sign), ^ (caret), , Division, Percent, Exponentiation, , 3/3, 20%, 3^2, , or, , multiplication;, , Comparison operators, You can compare two values with the following operators. When two values are compared by using these, operators, the result is a logical value either TRUE or FALSE., Comparison operator, , Meaning, , Example, , = (equal sign), , Equal to, , A1=B1, , > (greater than sign), , Greater than, , A1>B1
Page 18 :
< (less than sign), , Less than, , A1<B1, , >= (greater than or equal to sign), , Greater than or equal to, , A1>=B1, , <= (less than or equal to sign), , Less than or equal to, , A1<=B1, , <> (not equal to sign), , Not equal to, , A1<>B1, , Text concatenation operator, Use the ampersand (&) to join, or concatenate, one or more text strings to produce a single piece of text., Text, oper, ator, , Meaning, , Example, , &, (ampersa, nd), , Connects, or concatenates, two values to produce ("North"&"win, onecontinuous text value, d"), , Reference operators, Combine ranges of cells for calculations with the following operators., Referen, ce, operato, r, : (colon), , , (comma), , Meaning, , Example, , Range operator, which produces one reference to B5:B15, all the cells between two references, including the, two references, Union operator, which combines multiple SUM(B5:B15,D5:D15, referencesinto one reference, ), , The order in which Excel performs operations in formulas, In some cases, the order in which a calculation is performed can affect the return value of the formula, so it's, important to understand how the order is determined and how you can change the order to obtain desired, results., Calculation order, Formulas calculate values in a specific order. A formula in Excel always begins with an equal sign (=). The equal, sign tells Excel that the succeeding characters constitute a formula., Following the equal sign are the elements to be calculated (the operands), which are separated by calculation, operators. Excel calculates the formula from left to right, according to a specific order for each operator in the, formula.
Page 19 :
Operator precedence, If you combine several operators in a single formula, Excel performs the operations in a specific order. If a, formula contains operators with the same precedence — for example, if a formula contains both a, multiplication and division operator — Excel evaluates the operators from left to right., To keep things simple, the ―Order of Operations‖ in a basic Excel formula is as follows:, , 1) Parenthesis, 2) Exponents, 3) Multiplication or Division – if both operators appear in the same formula, Excel evaluates the operators, from left to right., , 4) Addition or Subtraction – if both operators appear in the same formula, Excel evaluates the operators from, left to right., , Tip: To recall the order of operations, try remembering:, Please Excuse My Dear Aunt Sally., To change the order of evaluation, enclose in parentheses the part of the formula to be calculated first., For example, the following formula produces 11 because, Excel calculates multiplication before addition. The, formula multiplies 2 by 3 and thenadds 5 to the result., , In contrast, if you use parentheses to change the syntax,, Excel adds 5 and 2 together and then multiplies the, result by 3 to produce 21., , =5+2*3, , =(5+2)*3, , Create a simple formula with constants and calculation operators, , 1) Click the cell in which you want to enter the formula., 2) Type = (an equal sign)., 3) Enter the formula., (Example1), , =128+345, (adds those two numbers together), , (Example2), , =(10+20+30)/3, (first add the contents of the parentheses, then divide, the result of the parentheses by the number 3), , 4) Press ENTER., Create a function manually:
Page 20 :
1) Click the cell in which you want to enter the formula., 2) Type =, , (an equal sign)., , 3) Type the function name (function names are not case sensitive, they are spelling sensitive: ex. - SUM,, AVERAGE, MAX)., , 4) Type (, , (an open parenthesis)., , 5) Type the argument., a) Remember to use a colon to included cells that are adjacent to each other; use a comma to, nonadjacent cells., , 6) Type ), , (a closing parenthesis)., , 7) Press ENTER., Adds the numbers:, 100+200+300, , Example1:, , =SUM(100,200,300), , Example2:, , = SUM(A12:C12), , Example3:, , =SUM(A12,A13,C12), , Adds only the cells, A12+A13+C12, , Example4, , =SUM(A12:C12,A13), , Adds the cells A12 through C12, and, A13, , Adds the cells A12 through C12,, including A12 and C12, , Use the Insert Function dialog box to create a function:, , 1) Click the cell in which you want to enter the formula., 2) To start the formula, click the Insert Function command on the formula bar:, , include
Page 21 :
3) The Insert Function dialog box opens., Select the function you want to use and, click OK., , a) You can enter a question that, , describes what you want to do in the, ―Search for a function‖ box (for, example, "add numbers" returns the, SUM function)., , b) Or browse from the categories inthe, ―Or select a category‖ box., , 4) The Function Arguments dialog box, opens., , 5) Enter the arguments., a) To enter cell references as an, argument, at the end of the argument, field, click Collapse Dialog, (which temporarily hides the dialog, box), select the cells on the, worksheet, and then press Expand, Dialog, ., , b) You can also manually enter the cell, references., , 6) When you complete the formula, press, ENTER, or OK.
Page 22 :
You can also sum numbers by using the AutoSum button, found on the Home tab, in the, , Editing group., One way to use the AutoSum button:, , 1) Select the cell to contain the formula., 2) Click the AutoSum button., a) If Excel finds numbers above the selected cell, it will assume a sum above., b) If Excel does not find numbers above the selected cell, it will assume a sum left., If the cells to be summed up are missing values:, , 1) Select all the cells to be summed., 2) Click the AutoSum button., a) As numbers are filled into the empty cells, the formula will update to include those figures., Copy a formula, If you are doing the exact same math in adjacent cells, using the same number of adjacent columns and rows,, use the fill handle to copy the formula. The fill handle is the small black square in the lower-right corner of, ., the selection. When you point to the fill handle, the pointer changes to a black cross., You can also copy and paste a formula from one cell to another. If you were using relative references, the, formula automatically adjusts.
Page 23 :
Fill formulas into adjacent cells, , 1) Select the cell that contains the formula that you want to fill into adjacent cells., 2) Drag the fill handle across the cells that you want to fill., a) The formula has been displayed in, the answer cell for this example., Normally you will only see the, answer to the formula., The goal is to copy the formula, ―=SUM(B2:B7)‖ to the next cell., b) The next cell contains the exact, same number of cells you are trying, to add up., c) By dragging the fill handle, you can, easily copy a formula from one cell, to another. When you point to the, fill handle, the pointer changes to a, black cross., 3) After dragging, the reference, automatically adjusts., a) If necessary, choose how you want, to fill the selection, click Auto Fill, Options , and then click the, option that you want., , Delete a formula, , 1) Click the cell that contains the formula., 2) Press DELETE., , PASTE SPECIAL OPTIONS:
Page 24 :
When you copy cell data, there are many ways it can be pasted. Some examples include:, , , Transpose Data: Copy columns to rows or vice versa., , , , Paste Values: Paste the results or values from a formula instead of copying and pasting the formulas themselves., , , , Paste Formats: Copy formatting from a cell or cell range and paste—or apply it elsewhere., , Transpose Data, Transposing data changes columns of copied data to rows, and vice versa., 1. Select a cell range., 2. Click Copy., , 3. Click the cell where you want to paste the data.
Page 25 :
4. Click the Paste list arrow., To preview a paste option before you commit to it, click the Paste list arrow and hold the mouse over the paste, option., 5. Select Transpose., , The selected data is transposed from columns to rows., Paste Values, You can paste only the values as displayed in the cells, instead of the formulas that are used to calculate those values., 1. With a cell containing a value you want to copy selected, click Copy., 2. Click the cell where you want to paste the data., 3. Click the Paste list arrow.
Page 26 :
4. Select Values., , Excel pastes the values of the copied cell into the selected cell., Whenever you paste data, the Paste Options Smart Tag appears next to the selected cell. You can also paste values by, clicking this tag and selecting a paste option from the list., Paste Formats, You can also copy and paste cell formatting, applying formats such as a cell’s font, font size, and color to other cells., 1. Select the cell that has the format you want to copy., 2. Click the Copy button., 3. Click the cell where you want to paste the format.
Page 27 :
4. Click the Paste list arrow., 5. Select Formatting., , Excel applies the formatting of the copied cell to the selected cell., Advanced Paste Special Commands, If the paste commands you’re looking for aren’t available in the Paste menu, you can open the Paste Special dialog, box to view advanced paste special commands., 1. Copy a cell value., 2. Click the cell where you want to paste the value., 3. Click the Paste list arrow.
Page 28 :
4. Select Paste Special., The Paste Special dialog box displays, containing numerous paste options., 5. Select a paste option., 6. Click OK., , Paste Special Options, The table below describes Excel's available Paste Special options., , Paste Special Options
Page 29 :
Paste, , Pastes all cell contents and formatting., , Formulas, , Pastes only the formulas as entered in the formula bar., , Formulas, , &, , Number, , copied cell’s number formatting., , Formatting, , Keep Source Formatting, , Paste, , Values, , Paste, , Column, , Pastes the width of the source cell’s column to the destination cell’s, , Width, , column., , Transpose, , Changes columns of copied data to rows, and vice versa., , Values, , Pastes only the values as displayed in the cells., , &, , Number, , Formatting, , Values, , Other, , was applied to the source data., , except borders., , Source, , Values, Paste Values, , Pastes all cell contents and formatting, including the theme, if one, , Pastes all cell contents and formatting applied to the copied cell, , No Borders, , Keep, , Pastes both the formulas as entered in the formula bar and the, , &, , Source, , Pastes both the copied cell’s values and number formatting., , Pastes cell values and formatting, including the theme, if one was, , Formatting, , applied to the source data., , Formatting, , Pastes only a cell’s formatting, the same as the Format Painter.., , Paste Link, , Picture, , Links the pasted data to the source data by pasting a formula, reference to the source data., , Pastes a picture from your Clipboard.
Page 30 :
Linked Picture, , Pastes a picture from a website as a link that you can click to view., , Freeze pane:, Freeze Panes, Freeze Top Row | Unfreeze Panes | Freeze First Column | Freeze Rows | Freeze Columns | Freeze Cells | Magic, Freeze Button, If you have a large table of data in Excel, it can be useful to freeze rows or columns. This way you can keep rows or, columns visible while scrolling through the rest of the worksheet., Freeze Top Row, To freeze the top row, execute the following steps., 1. On the View tab, in the Window group, click Freeze Panes., , 2. Click Freeze Top Row., , 3. Scroll down to the rest of the worksheet., Result. Excel automatically adds a dark grey horizontal line to indicate that the top row is frozen.
Page 31 :
Unfreeze Panes, To unlock all rows and columns, execute the following steps., 1. On the View tab, in the Window group, click Freeze Panes., , 2. Click Unfreeze Panes., , Freeze First Column, To freeze the first column, execute the following steps., 1. On the View tab, in the Window group, click Freeze Panes., , 2. Click Freeze First Column., , 3. Scroll to the right of the worksheet., Result. Excel automatically adds a dark grey vertical line to indicate that the first column is frozen.
Page 32 :
Freeze Rows, To freeze rows, execute the following steps., 1. For example, select row 4., 2. On the View tab, in the Window group, click Freeze Panes., , 3. Click Freeze Panes., , 4. Scroll down to the rest of the worksheet., Result. All rows above row 4 are frozen. Excel automatically adds a dark grey horizontal line to indicate that the first, three rows are frozen., , Freeze Columns, To freeze columns, execute the following steps.
Page 33 :
1. For example, select column E., 2. On the View tab, in the Window group, click Freeze Panes., , 3. Click Freeze Panes., , 4. Scroll to the right of the worksheet., Result. All columns to the left of column E are frozen. Excel automatically adds a dark grey vertical line to indicate, that the first four columns are frozen., , Freeze Cells, To freeze cells, execute the following steps., 1. For example, select cell C3., 2. On the View tab, in the Window group, click Freeze Panes., , 3. Click Freeze Panes.
Page 34 :
4. Scroll down and to the right., Result. The orange region above row 3 and to the left of column C is frozen., , Magic Freeze Button, Add the magic Freeze button to the Quick Access Toolbar to freeze the top row, the first column, rows, columns or, cells with a single click., 1. Click the down arrow., 2. Click More Commands.
Page 35 :
3. Under Choose commands from, select Commands Not in the Ribbon., 4. Select Freeze Panes and click Add., , 5. Click OK., 6. To freeze the top row, select row 2 and click the magic Freeze button.
Page 36 :
7. Scroll down to the rest of the worksheet., Result. Excel automatically adds a dark grey horizontal line to indicate that the top row is frozen., , Note: to unlock all rows and columns, click the Freeze button again. To freeze the first 4 columns, select column E, (the fifth column) and click the magic Freeze button, etc., , Auto Completion Series:, Use AutoFill Excel option to populate a range in Excel 2010 - 2019, Whether you just want to copy the same value down or need to get a series of numbers or text values, fill handle in, Excel is the feature to help. It's an irreplaceable part of the AutoFill option. Fill handle is a small square that appears in
Page 37 :
the, , bottom-right, , corner, , when, , you, , select, , a, , cell, , or, , range., , It may be hard to believe that this tiny, almost unnoticeable part of selection gives you numerous helpful options to, use every day., The scheme is simple. Whenever you need to get a series of values in the adjacent cells, just click on the Excel fill, handle to see a small black cross and drag it vertically or horizontally. As you release the mouse button, you will see, the, selected, cells, filled, with, the, values, depending, on, the, pattern, you, specify., , One of the most popular questions is how to autofill numbers is Excel. This can also be dates, times, days of the week,, months, years and so on. In addition, Excel's AutoFill will follow any pattern., For example, if you need to continue a sequence, just enter the first two values into the starting cell and grab the fill, handle, to, copy, the, data, across, the, specified, range.
Page 38 :
You can also auto-populate any arithmetic progression sequence where the difference between numbers is constant., , It will even alternate sequences if the selected cells don't relate to each other numerically, like on the picture below., , And it goes without saying, that you can use the AutoFill option to copy a value across your range. I think you already, know how to make the same value appear in the adjacent cells in Excel. You just need to enter this number, text, or, their combination, and drag it across the cells using the fill handle., Presume you have already heard of the features I described above. I still believe, some of them appeared new to you., So go on reading to learn even more about this popular yet under-explored tool., All AutoFill Excel options - see the fill handle at its best
Page 39 :
Double-click to automatically populate a large range, Suppose you have a huge database with names. You need to assign a serial number to each name. You can do it in a, flash, by, entering, the, first, two, numbers, and, double-clicking, the, Excel, fill, handle., , Note. This hint will only work if you have values to the left or right of the column you need to fill as Excel looks at, the adjacent column to define the last cell in the range to fill. Please also keep in mind that it will populate by the, longest column in case you have values to the right and to the left of the empty range you want to fill down., Excel - Fill down a series of values that contain text, It's not a problem for the AutoFill option to copy across the values that contain both text and numerical values., Moreover, Excel is quite smart to know that there are only 4 quarters or that some ordinal numbers need the, corresponding letter suffixes.
Page 40 :
Create custom list series for autofilling, If you use the same list every now and then, you can save it as a custom one and make Excel fill handle populate cells, with the values from your custom list automatically. Please follow the steps below to do this:, 1. Enter the header and complete your list., , Note. A custom list can only contain text or text with numerical values. If you need it to store only numbers,, please create a list of digits formatted as text., 2. Select the range with your list., 3. In Excel 2003 go to Tools -> Options -> Custom Lists tab., In Excel 2007 click on the Office button -> Excel options -> Advanced -> scroll down till you see the Edit Custom, Lists… button in the General section., In Excel 2010-2013 click File -> Options -> Advanced -> scroll to the General section to find the Edit Custom, Lists… button.
Page 41 :
4. Since you already selected the range with your list, you will see its address in the Import list from cells: field., , 5. Press the Import button to see your series in the Custom Lists window., , 6. Finally click OK -> OK to save the list., When you need to get this list autofilled, enter the name of the header into the necessary cell. Excel will recognize, the item and when you drag the fill handle in Excel across your range, it will populate it with the values from your
Page 42 :
list., , Use the AutoFill option to get repeating series, If you need a series of recurring values, you can still use the fill handle. For example, you need to repeat YES, NO,, TRUE, FALSE sequence. First, enter all these values manually to give Excel a pattern. Then just grab the fill handle, and drag it to the necessary cell., , Autofilling horizontally and vertically, Most likely, you use AutoFill to populate cells down a column. However, this feature also works if you need to extend, a range horizontally, leftward or upward. Just select the cells with the value(s) and drag the fill handle to the needed, direction.
Page 43 :
Autofill multiple rows or columns, The Excel Autofill can deal with data in more than one row or column. If you pick two, three or more cells and drag, the, fill, handle, they, all, will, be, populated., , Insert empty cells when filling down a series, AutoFill, , also, , enables, , you, , to, , create, , a, , series, , with, , empty, , cells, , like, , on, , the, , screenshot, , below.
Page 44 :
Use AutoFill Options list to fine tune the way the data is entered, You can adjust the settings with the help of the AutoFill Options list to get the exact results. There are two ways to get, this list., 1. Right-click on the fill handle, drag and drop it. Then you will see a list with options automatically pop up like on, the, screenshot, below:, , Let's see what these options offer., o, o, o, o, o, o, o, o, o, , Copy Cells - populates a range with the same value., Fill Series - works if you select more than one cell and the values are different. AutoFill will generate the range, according to a given pattern., Fill Formatting Only - this Excel AutoFill option will only get the format of the cell(s) without pulling any values., It can be helpful if you need to quickly copy the formatting and then enter the values manually., Fill Without Formatting - copies values only. If the background of the starting cells is red, the option will not, preserve it., Fill Days / Weekdays / Months / Years - these features do what their names suggest. If your starting cell contains, one of those, you can quickly have it complete the range by clicking one of the options., Linear Trend - creates a linear series or linear best-fit trend., Growth Trend - generates a growth series or geometric growth trend., Flash Fill - helps you enter plenty of repetitive information and format your data in the right way., Series … - this option pops up the Series dialog box with a number of advanced possibilities to choose from.
Page 45 :
2. The other way to get the list is to click on the fill handle, drag and drop it and then click on the Auto Fill, Options icon., , When, , you, , click, , on, , this, , icon, , you, , get, , a, , list, , with, , AutoFill, , options., , This list just repeats some features from the previous part., Excel - Autofill formulas, Autofilling formulas is a process pretty much similar to copying values down or getting a series of numbers. It, involves drag-n-dropping the fill handle. You will find some helpful tips and tricks in one of our previous posts, named The fastest way to insert a formula into the entire column., Flash fill in Excel 2013
Page 46 :
If you use Office 2013, you can try Flash Fill, a new feature introduced in the most recent Excel version., , Now I will try to briefly describe what it does. Flash Fill instantly studies the data you enter and the format you use, and checks if these data are already in your worksheet. If Flash Fill recognizes these values and grabs the pattern, it, offers you a list based on this mode. You can click Enter to paste it or ignore the offer. Please see it in action on the, picture, below:, , Flash Fill enables you to format numerous names, dates of birth, and phone numbers in a click of a mouse. You just, enter initial data, which Excel quickly recognizes and uses. I promise that one of our upcoming articles will give you, as many details on this interesting and helpful feature as possible., Enable or disable the AutoFill feature in Excel
Page 47 :
The fill handle option is turned on in Excel by default. So whenever you select a range you can see it in the bottomright corner. In case you need to get Excel AutoFill not working, you can switch it off by doing the following:, 1. Click on File in Excel 2010-2013 or on the Office button in version 2007., 2. Go to Options -> Advanced and untick the checkbox Enable fill handle and cell drag-and-drop., , Note. To prevent replacing the current data when you drag the fill handle, make sure that the Alert before overwriting, cells check box is ticked. If you don't want Excel to display a message about overwriting non-blank cells, just clear, this check box., Turn Auto Fill Options on or off, If you don't want to display the Auto Fill Options button every time you drag the fill handle, just turn it off. Similarly,, if the button does not show when you use the fill handle, you can turn it on., 1. Go to File / Office button -> Options -> Advanced and find the Cut, copy and paste section., 2. Clear the Show Paste Options buttons when content is pasted check box.
Page 48 :
In Microsoft Excel, AutoFill is a feature that allows the user to extend a series of numbers, dates, or even text to the, necessary range of cells. This little option gives you plenty of possibilities. Use Flash Fill in Excel, autofill dates and, numbers, populate numerous cells, and get custom list values., That's it! Thank you for reading to the end. Now you know it all, or almost all about the AutoFill option. Subscribe to, our blog to learn even more about this and other helpful Excel features., Let me know if I didn't manage to cover all the questions and issues you have and I'll be happy to help you. Just drop, me a line in the comments. Be happy and excel in Excel!, , Sort and Filter:, Sorting in MS Excel, Sorting data in MS Excel rearranges the rows based on the contents of a particular column. You may want to sort a, table to put names in alphabetical order. Or, maybe you want to sort data by Amount from smallest to largest or, largest to smallest., To Sort the data follow the steps mentioned below., , , , Select the Column by which you want to sort data., Choose Data Tab » Sort Below dialog appears.
Page 49 :
, , If you want to sort data based on a selected column, Choose Continue with the selection or if you want, sorting based on other columns, choose Expand Selection., , , , You can Sort based on the below Conditions., o, , Values − Alphabetically or numerically., , o, , Cell Color − Based on Color of Cell., , o, , Font Color − Based on Font color., , o, , Cell Icon − Based on Cell Icon.
Page 50 :
, , Clicking Ok will sort the data.
Page 51 :
Sorting option is also available from the Home Tab. Choose Home Tab » Sort & Filter. You can see the same dialog, to sort records., , Filter:, Filters in MS Excel, Filtering data in MS Excel refers to displaying only the rows that meet certain conditions. (The other rows gets, hidden.), Using the store data, if you are interested in seeing data where Shoe Size is 36, then you can set filter to do this., Follow the below mentioned steps to do this., , , Place a cursor on the Header Row., , , , Choose Data Tab » Filter to set filter.
Page 52 :
, , Click the drop-down arrow in the Area Row Header and remove the check mark from Select All, which, unselects everything., , , , Then select the check mark for Size 36 which will filter the data and displays data of Shoe Size 36., , , , Some of the row numbers are missing; these rows contain the filtered (hidden) data., , , , There is drop-down arrow in the Area column now shows a different graphic — an icon that indicates the, column is filtered.
Page 53 :
Using Multiple Filters, You can filter the records by multiple conditions i.e. by multiple column values. Suppose after size 36 is filtered, you, need to have the filter where color is equal to Coffee. After setting filter for Shoe Size, choose Color column and then, set filter for color., , CHARTS:, Charts, A chart is a visual representation of numeric values. Charts (also known as graphs) have been an integral part of, spreadsheets. Charts generated by early spreadsheet products were quite crude, but thy have improved significantly, over the years. Excel provides you with the tools to create a wide variety of highly customizable charts. Displaying, data in a well-conceived chart can make your numbers more understandable. Because a chart presents a picture,, charts are particularly useful for summarizing a series of numbers and their interrelationships., Types of Charts, There are various chart types available in MS Excel as shown in the below screen-shot.
Page 54 :
, , Column − Column chart shows data changes over a period of time or illustrates comparisons among items., , , , Bar − A bar chart illustrates comparisons among individual items., , , , Pie − A pie chart shows the size of items that make up a data series, proportional to the sum of the items. It, always shows only one data series and is useful when you want to emphasize a significant element in the data., , , , Line − A line chart shows trends in data at equal intervals., , , , Area − An area chart emphasizes the magnitude of change over time., , , , X Y Scatter − An xy (scatter) chart shows the relationships among the numeric values in several data series,, or plots two groups of numbers as one series of xy coordinates., , , , Stock − This chart type is most often used for stock price data, but can also be used for scientific data (for, example, to indicate temperature changes)., , , , Surface − A surface chart is useful when you want to find the optimum combinations between two sets of, data. As in a topographic map, colors and patterns indicate areas that are in the same range of values., , , , Doughnut − Like a pie chart, a doughnut chart shows the relationship of parts to a whole; however, it can, contain more than one data series., , , , Bubble − Data that is arranged in columns on a worksheet, so that x values are listed in the first column and, corresponding y values and bubble size values are listed in adjacent columns, can be plotted in a bubble chart., , , , Radar − A radar chart compares the aggregate values of a number of data series., , Creating Chart, To create charts for the data by below mentioned steps., , , Select the data for which you want to create the chart., , , , Choose Insert Tab » Select the chart or click on the Chart group to see various chart types.
Page 55 :
, , Select the chart of your choice and click OK to generate the chart., , Editing Chart, You can edit the chart at any time after you have created it., , , You can select the different data for chart input with Right click on chart » Select data. Selecting new data, will generate the chart as per the new data, as shown in the below screen-shot.
Page 56 :
, , You can change the X axis of the chart by giving different inputs to X-axis of chart., , , , You can change the Y axis of chart by giving different inputs to Y-axis of chart., , Pivot Charts, A pivot chart is a graphical representation of a data summary, displayed in a pivot table. A pivot chart is always, based on a pivot table. Although Excel lets you create a pivot table and a pivot chart at the same time, you can’t, create a pivot chart without a pivot table. All Excel charting features are available in a pivot chart., Pivot charts are available under Insert tab » PivotTable dropdown » PivotChart., Pivot Chart Example, Now, let us see Pivot table with the help of an example. Suppose you have huge data of voters and you want to see, the summarized view of the data of voter Information per party in the form of charts, then you can use the Pivot chart, for it. Choose Insert tab » Pivot Chart to insert the pivot table.
Page 57 :
MS Excel selects the data of the table. You can select the pivot chart location as an existing sheet or a new sheet., Pivot chart depends on automatically created pivot table by the MS Excel. You can generate the pivot chart in the, below screen-shot.