Notes of Eve 25th Batch, Project Management Chapter-10-PERT-CPM.pdf - Study Material
Page 2 :
Introduction, Any project involves planning, scheduling and controlling a, , number of interrelated activities with use of limited resources,, namely, men, machines, materials, money and time., The projects may be extremely large and complex such as, , construction of a housing , a highway, a shopping complex etc., introduction of new products and research and development, projects., , It is required that managers must have a dynamic planning and, , scheduling system to produce the best possible results and also, to react immediately to the changing conditions and make, necessary changes in the plan and schedule.
Page 3 :
A convenient analytical and visual technique of PERT and, CPM prove extremely valuable in assisting the managers in, managing the projects., , PERT, , stands, , for, , Project, , Evaluation, , and, , Review, , Technique developed during 1950’s. The technique was developed and, used in conjunction with the planning and designing of the Polaris missile, project., , CPM, , stands for Critical Path Method which was developed by, DuPont Company and applied first to the construction projects in the chemical, industry., , Though both PERT and CPM techniques have similarity in terms of, concepts, the basic difference is; CPM has single time estimate and PERT, has three time estimates for activities and uses probability theory to find, the chance of reaching the scheduled time.
Page 4 :
Project management generally consists of three phases., Planning:, Planning involves setting the objectives of the project. Identifying, various activities to be performed and determining the requirement of, resources such as men, materials, machines, etc., The cost and time for all the activities are estimated, and a network diagram is, developed showing sequential interrelationships (predecessor and successor), between various activities during the planning stage., Scheduling:, Based on the time estimates, the start and finish times for each activity, are worked out by applying forward and backward pass techniques, critical, path is identified, along with the slack and float for the non-critical paths., Controlling:, Controlling refers to analyzing and evaluating the actual progress, against the plan. Reallocation of resources, crashing and review of projects, with periodical reports are carried out.
Page 5 :
COMPONENTS of PERT/CPM NETWORK, PERT / CPM networks contain two major components, i. Activities, and, ii. Events, Activity: An activity represents an action and consumption of, resources (time, money, energy) required to complete a portion of a, project. Activity is represented by an arrow, ., , Event: An event (or node) will always occur at the beginning and end of an, activity. The event has no resources and is represented by a circle. The ith event, and jth event are the tail event and head event respectively.
Page 6 :
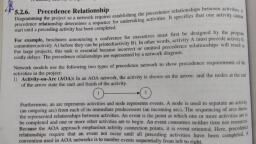
Merge and Burst Events, One or more activities can start and end simultaneously at an event ., , Preceding and Succeeding Activities, Activities performed before given events are known as preceding activities, and, activities performed after a given event are known as succeeding activities., , Activities A and B precede activities C and D respectively.
Page 7 :
Dummy Activity, An imaginary activity which does not consume any resource and time is called a, dummy activity. Dummy activities are simply used to represent a connection, between events in order to maintain a logic in the network. It is represented by a, dotted line in a network.
Page 8 :
ERRORS TO BE AVOIDED IN CONSTRUCTING A NETWORK, a. Two activities starting from a tail event, must not have a same end event. To ensure, this, it is absolutely necessary to introduce a, dummy activity, as shown in Figure ., , b. Looping error should not be formed in a, network, as it represents performance of, activities repeatedly in a cyclic manner, as, shown below in Figure ., c. In a network, there should be only one, start event and one ending event as shown, below, in Figure ., , d. The direction of arrows should, flow from left to right avoiding, mixing of direction as shown in, Figure .
Page 9 :
RULES IN CONSTRUCTING A NETWORK, 1. No single activity can be represented more than once in a network., The length of an arrow has no significance., 2. The event numbered 1 is the start event and an event with highest, number is the end event. Before an activity can be undertaken, all, activities preceding it must be completed. That is, the activities must, follow a logical sequence (or – interrelationship) between activities., 3. In assigning numbers to events, there should not be any duplication of, event numbers in a network., 4. Dummy activities must be used only if it is necessary to reduce the, complexity of a network., 5. A network should have only one start event and one end event.
Page 10 :
Some conventions of network diagram are shown in Figure (a),, (b), (c), (d) below:
Page 11 :
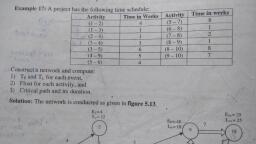
PROCEDURE FOR NUMBERING THE EVENTS, USING FULKERSON'S RULE, Step1: Number the start or initial event as 1., , Step2: From event 1, strike off all outgoing activities. This would have, made one or more events as initial events (event which do not have, incoming activities). Number that event as 2., Step3: Repeat step 2 for event 2, event 3 and till the end event. The end, event must have the highest number, , Example 1:, Draw a network for a house construction project. The sequence of, activities with their predecessors are given in Table , below.
Page 13 :
The network diagram in Figure shows the procedure relationship between, the activities. Activity A (preparation of house plan), has a start event 1, as well as an ending event 2. Activity B (Construction of house) begins at, event 2 and ends at event 3. The activity B cannot start until activity A, has been completed. Activities C and D cannot begin until activity B, has been completed, but they can be performed simultaneously., Similarly, activities E and F can start only after completion of, activities C and D respectively. Both activities E and F finish at the end of, event 6., Example 2: Consider the project given in Table 8.2 and construct a, network diagram. Table : Sequence of Activities for Building, Construction Project
Page 14 :
Solution:, The activities C and D have a common predecessor A. The network, representation shown in Figure (a), (b) violates the rule that no two activities can, begin and end at the same events. It appears as if activity B is a predecessor of, activity C, which is not the case. To construct the network in a logical order, it is, necessary to introduce a dummy activity as shown in Figure .
Page 15 :
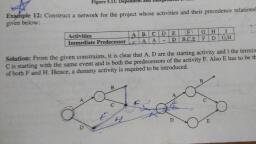
Example 3:, Construct a network for a project whose activities and their predecessor relationship, are given in Table ., , Solution: The network diagram for the given problem is shown in Figure, with activities A, B and C starting simultaneously.
Page 16 :
Example 4: Draw a network diagram for, a project given in Table ., , Solution: An activity network diagram describing the project is shown in, Figure , below:
Page 17 :
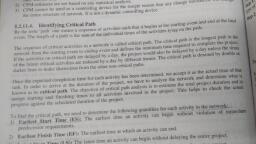
CRITICAL PATH ANALYSIS, The critical path for any network is the longest path through the entire network., Since all activities must be completed to complete the entire project, the length, of the critical path is also the shortest time allowable for completion of the, project., Thus if the project is to be completed in that shortest time, all activities on the, critical path must be started as soon as possible., These activities are called critical activities., If the project has to be completed ahead of the schedule, then the time required, for at least one of the critical activity must be reduced., Further, any delay in completing the critical activities will increase the project, duration.
Page 18 :
The activity, which does not lie on the critical path, is called non-critical, activity., These non-critical activities may have some slack time., , The slack is the amount of time by which the start of an activity may be, delayed without affecting the overall completion time of the project., But a critical activity has no slack., , To reduce the overall project time, it would require more resources (at, extra cost) to reduce the time taken by the critical activities to complete.
Page 19 :
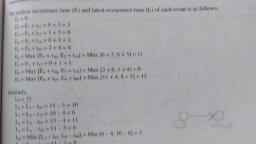
Scheduling of Activities: Earliest Time (TE) and Latest, Time(TL), , Before the critical path in a network is determined, it is necessary to, find the earliest and latest time of each event to know the earliest, expected time (TE) at which the activities originating from the event, can be started and to know the latest allowable time (TL) at which, activities terminating at the event can be completed., Forward Pass Computations (to calculate Earliest, Time TE), Step 1: Begin from the start event and move towards the end event., Step 2: Put TE = 0 for the start event., , Step 3: Go to the next event (i.e node 2) if there is an incoming activity for event 2,, add calculate TE of previous event (i.e event 1) and activity time., , Note: If there are more than one incoming activities, calculate TE for all incoming, activities and take the maximum value. This value is the TE for event 2., Step 4: Repeat the same procedure from step 3 till the end event.
Page 20 :
Backward Pass Computations (to calculate Latest Time TL), Procedure :, , Step 1: Begin from end event and move towards the start event. Assume that, the direction of arrows is reversed., , Step 2: Latest Time TL for the last event is the earliest time. TE of the last, event., Step 3: Go to the next event, if there is an incoming activity, subtract the value, of TL of previous event from the activity duration time. The arrived value is, TL for that event. If there are more than one incoming activities, take the, minimum TE value., Step 4: Repeat the same procedure from step 2 till the start event.
Page 21 :
DETERMINATION OF FLOAT AND SLACK TIMES, As discussed earlier, the non – critical activities have some slack or float., The float of an activity is the amount of time available by which it is, possible to delay its completion time without extending the overall, project completion time., tij = duration of activity, TE = earliest expected time, TL = latest allowable time, ESij = earliest start time of the activity, EFij = earliest finish time of the activity, LSij = latest start time of the activity, LFij = latest finish time of the activity, Total Float TFij: The total float of an activity is the difference between the, latest start time and the earliest start time of that activity., TFij = LS ij – ESij ....................(1), or, TFij = (TL – TE) – tij …………..(ii)
Page 22 :
Free Float FFij: The time by which the completion of an activity can be, delayed from its earliest finish time without affecting the earliest start, time of the succeeding activity is called free float., FF ij = (Ej – Ei) – tij ....................(3), FFij = Total float – Head event slack, , Independent Float IFij: The amount of time by which the start of an activity, can be delayed without affecting the earliest start time of any immediately, following activities, assuming that the preceding activity has finished at its, latest finish time., IF ij = (Ej – Li) – tij ....................(4), IFij = Free float – Tail event slack, , Where tail event slack = Li – Ei, , The negative value of independent float is considered to be zero.
Page 23 :
Critical Path:, After determining the earliest and the latest scheduled times for, various activities, the minimum time required to complete the, project is calculated. In a network, among various paths, the, longest path which determines the total time duration of the, project is called the critical path. The following conditions must, be satisfied in locating the critical path of a network., An activity is said to be critical only if both the conditions are satisfied., 1. TL – TE = 0, 2. TLj – tij – TEj = 0, Example :, A project schedule has the following characteristics as shown in Table, , i. Construct PERT network., ii. Compute TE and TL for, each activity., iii. Find the critical path.
Page 24 :
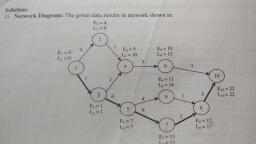
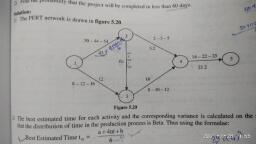
(i) From the data given in the problem, the activity network is constructed as, shown in Figure given below
Page 27 :
(iii) From the Table , we observe that the, activities 1 – 3, 3 – 5, 5 – 7,7 – 8 and 8 – 10 are, critical activities as their floats are zero.
Page 28 :
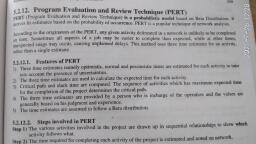
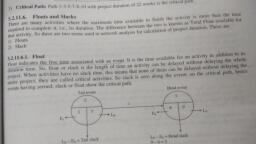
PROJECT EVALUATION REVIEW TECHNIQUE, (PERT), In the critical path method, the time estimates are assumed to be, known with certainty. In certain projects like research and, development, new product introductions, it is difficult to estimate, the time of various activities., Hence PERT is used in such projects with a probabilistic method using three time, estimates for an activity, rather than a single estimate, as shown in Figure 8.22., , Optimistic time tO:, It is the shortest time taken to complete the, activity. It means that if everything goes well, then there is more chance of completing the, activity within this time., , Most likely time tm:, It is the normal time taken to complete an activity,, if the activity were frequently repeated under the, same conditions., , Pessimistic time tp:, It is the longest time that an activity would take to, complete. It is the worst time estimate that an, activity would take if unexpected problems are, faced.
Page 29 :
Taking all these time estimates into consideration, the expected time, of an activity is arrived at., The average or mean (ta) value of, the activity duration is given by,, The variance of the activity time, is calculated using the formula,, , Probability for Project Duration, The probability of completing the, project within the scheduled time (Ts) or, contracted time may be obtained by, using the standard normal deviate, where Te is the expected time of project, completion., Probability of completing the project, within the scheduled time is,
Page 30 :
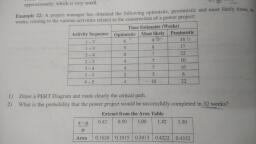
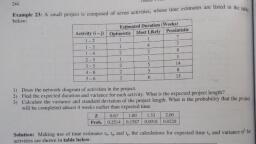
Example, An R & D project has a list of tasks to be performed whose time estimates are, given in the Table , as follows., , a. Draw the project network., b. Find the critical path., c. Find the probability that the project is completed in 19 days. If the, probability is less than 20%, find the probability of completing it in 24, days.
Page 31 :
Time expected for each activity is, calculated using the formula (5):, Similarly, the expected time is, calculated for all the activities., The variance of activity time is, calculated using the formula (6)., Similarly, variances of all the, activities are calculated.
Page 32 :
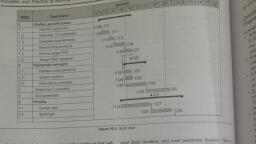
Construct a network diagram:, , calculate the time earliest (TE) and, time Latest (TL) for all the activities., , From the network diagram Figure , the critical path is identified as, 1-4, 4-6, 6-7, with a project duration of 22 days.
Page 33 :
The probability of completing the project within 19 days is given by, P (Z< Z0), To find Z0 ,, , we know, P (Z <Z Network Model 0) = 0.5 – z (1.3416) (from normal tables, z (1.3416) = 0.4099), = 0.5 – 0.4099, = 0.0901, = 9.01%, Thus, the probability of completing the R & D project in 19 days is 9.01%., , Since the probability of completing the project in 19 days is less than 20% As in, question, we find the probability of completing it in 24 days.
Page 34 :
COST ANALYSIS, The two important components of any activity are the cost and time. Cost is, directly proportional to time and vice versa., For example, in constructing a shopping complex, the expected time of completion, can be calculated using the time estimates of various activities. But if the, construction has to be finished earlier, it requires additional cost to complete the, project. We need to arrive at a time/cost trade-off between total cost of project and, total time required to complete it., Normal time:, Normal time is the time required to complete, the activity at normal conditions and cost., , Crash time:, Crash time is the shortest possible activity, time; crashing more than the normal time, will increase the direct cost., Cost Slope, Cost slope is the increase in cost per unit of, time saved by crashing. A linear cost curve, is shown in Figure 8.27.
Page 35 :
Example, An activity takes 4 days to complete at a normal cost of Rs. 500.00. If it is possible, to complete the activity in 2 days with an additional cost of Rs. 700.00, what is the, incremental cost of the activity?, , Incremental Cost or Cost Slope, It means, if one day is reduced we have to spend Rs. 100/- extra per day., , Project Crashing, Procedure for crashing, Step1: Draw the network diagram and mark the Normal time and Crash time., Step2: Calculate TE and TL for all the activities., Step3: Find the critical path and other paths., Step 4: Find the slope for all activities and rank them in ascending order.
Page 36 :
Step 5: Establish a tabular column with required field., Step 6: Select the lowest ranked activity; check whether it is a critical activity. If, so,crash the activity, else go to the next highest ranked activity., Note: The critical path must remain critical while crashing., Step 7: Calculate the total cost of project for each crashing, Step 8: Repeat Step 6 until all the activities in the critical path are fully, crashed., Example, , The following Table, 8.13 gives the activities, of, a, construction, project and other data., , If the indirect cost is Rs. 20 per day, crash the activities to find the, minimum duration of the project and the project cost associated.
Page 37 :
Solution, From the data provided in the table, draw the network diagram (Figure 8.28), and find the critical path., , From the diagram, we observe that the, critical path is 1-2-5 with project duration of, 14 days, , The cost slope for all activities and their rank, is calculated as shown in Table 8.14
Page 38 :
The available paths of the network are listed down in Table 8.15, indicating the sequence of crashing (see Figure 8.29)., , The sequence of crashing and, the total cost involved is given, in Table 8.16 Initial direct cost, = sum of all normal costs given, = Rs. 490.00
Page 39 :
Activity, Crashed, , Project, Duration, , Critical Path, , Direct Cost in (Rs.), , Indirect, Cost in, (Rs.), , Total, Cost in, (Rs.), , -, , 14, , 1-2-5, , 490, , 14 x 20 =, 280, , 770, , 1 – 2(2), 2 – 5(2), 2 – 4(1), 3 – 4(2), , 10, , 1–2–5, 1–3–4–5, 1–2–4–5, , 490 + (2 x 15) + (2 x, 100) + (1 x 10) + (2 x, 20) = 770, , 10 x 20 =, 200, , 970, , It is not possible to crash more than 10 days, as all the activities in, the critical path are fully crashed. Hence the minimum project, duration is 10 days with the total cost of Rs. 970.00.
Page 40 :
Assignment
Page 43 :
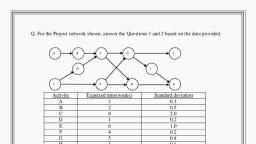
a. Draw the project network diagram., b. Calculate the length and variance of the critical path., c. What is the probability that the jobs on the critical path can be, completed in 41 days?
 Learn better on this topic