Page 1 :
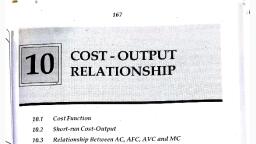
167, , , , COST - OUTPUT, RELATIONSHIP, , , , , , , , , , , , ene SS, 10.1. Cost Function, 10.2 Short-run Cost-Output, 10.3 Relationship Between AC, AFC, AVC and MC, 10.4 Relationship Between AC and MC, 10.5. Short-run Average Cost and Output, 10.6 Long-run Cost Output, 10.7. Long-run Average Cost Curve (LAC), 10.8 Long-run Marginal Cost (LMC) Curve, 10.9 Learning Curve, , 10.10 Long-run AC and Output, , 10.1 COST FUNCTION, , , , Cost function is a derived function. It is derived. from the production, function, which describes the efficient method of production at any one, time. In other words, the production function specifies the technical, relationships between inputs and the level of output. Thus, costs will vary, with the changes in the level of output, nature of production function, or, factor prices. Thus, symbolically, we may write the cost function as, , C=f£(X,T,P)
Page 2 :
168, Whee 26 ‘ Business Economics - I (BMS, BAF, BEM, BBL: SEM, = Total cost X = Output y, T «= 45, Tr echnology PR = Prices of factors, , Total cost is an incre, clause ceteris paribu, are constant. If thes, is itself determined, of the factor input:, , ‘asing function of output, C = f (X), ceterius paribus,, , Ss implies that all other factors which determine ¢,,°, e factors change, they will affect the cost. The technolo.”, by the physical quantities of the factor inputs, the quali, eobael 1 S, the efficiency of the entrepreneur, both in Or ganisin, P hysical side of the production and in making the correct €conom,, choice of techniques. Thus, any change in these determinants will shift th, production function, and hence will shift the cost curve. For instance th, introduction of a better method of organising production or the applicatig, :, ofan educational programme to the existing labour will shift the Productio,, function upwards, and hence will shift down the cost curve. Similarly, the, improvement of raw material, or the improvement in the use of the sam,, raw materials will lead to a downward shift of the cost function., , Since no output is possible without an input, an increase in factor price,, ceteris paribus, will lead to an increase in the cost. The factor prices depeng, on the demand and supply of factors in the economy., , Of all the determinants of cost, the cost-output relationship is considereg, as the most important one. Thus, in economic analysis the cost function is, analysed with respect to output. This is because the cost-output relationship, is subject to faster and more frequent changes. The relationship between, cost and output is analysed with respect to short-run and long-run., , , , In the earlier chapter we have discussed various concepts of cost. We are, now familiar with money cost and its various categories such as fixed cost,, variable cost, total cost and marginal cost. These costs behave in different, ways as production changes. In this chapter we explain cost-output, relationship in the short-run and long-run., , Short-run is a period where a firm produces its output within a given, capacity. Its cost is divided between fixed and variable cost. Productionis, varied by changing variable cost. In the short-run, production is subject to, law of variable proportion., , With a hypothetical example we explain behaviour of output and costs a, shown in Table 10.1., , X, , , , mo sy
Page 3 :
Cost - Output Relationship , 169, Table 10.1: A Schedule of Short Run Costs-Output, , , , , , , , All Costs in Rupees, Quan-| Total | Total | Total Marginal|Average|Average| Average, tity | Fixed |Varia-| Cost | Cost | Fixed [Variable] Total, Cost | ble Cost Cost Cost, q_ | TFC | Cost |}TC=| MC_ | AFC= | AVC=|ATC =TC/q, TVC | TFC TFC/q | TVC/q ATC (AC) 5, + TVC -~ |AVC+AFC, 1 2 3 4 5 6 7 8, 0 100 0 | 100, 1 | 100 | 25 | 125 25 100 25 125, 2 100 40 | 140 15 50 20 70, 3 100 50 | 150 10 33.3 | 16.7 _ 50, 4 | 100 70 | 170 20 25 | 17.5 42.5, 5 100 | 100 | 200 30 20 20 40, 6 100 | 145 | 245 45 16.6 | 24.2 40.8, 7 100 | 205 | 305 60 143 | 29.3 43.6, 8 100 | 285 | 385 80 12.5 | 35.6 48.1, 9 100 | 385 | 485 100 111 | 428 53.9, 10 | 100 | 515 | 615 130 |. 10 | 51.5 61.5, , , , , , , , , , , , , , , , , , , , , , Column 6 shows that AFC declines continuously as output increases. We, can observe from column 7 that AVC falls initially, reaches a minimum, and eventually rises with the increase in output. From column 8 we can, see that ATC too falls initially, reaches the minimum and then rises as output, increases. It can also be seen that ATC is the sum of AFC and AVC. Column, 5 shows that MC too behaves in the same way as AVC and ATC., , , , The relationship between AC, AFC, AVC and MC is explained graphically, by drawing respective cost curves in Fig. 10.1. The behaviour of cost curves, 1s explained below., , Since AFC is falling steadily as output increases, the AFC curve is also, falling steadily from left to right. In mathematical terms, AFC curve
Page 4 :
170 Bus;, usiness Economics - I (BMS, BAF, BFM, BBL: SEy (e, , approa, fauches ete ees asymptotically, that is, it gets very near to bit }, levels of aries - ince we are dividing the constant fixed cost by dif, Vy, that if we an i AFC curve is a rectangular hyperbola. By this we Sey, consespoidlin Iply the AFC at any point on the AFC curve with’?, aes & quantity of output, we will always get the same total the, - AtUS Property of the AFC curve shows that TFC is constant through!, Ut, , , , , , Ya, mc AC, AVC, g, 0, AFC, oO +X, , Output, Fig. 10.1 : Marginal and Average Cost Curves, , The AVC curve falls initially, reaches a minimum and then rises as output, increases. It falls slowly as the firm’s output rises from zero to the norma, capacity level. Once normal capacity output is reached AVC curve rises, sharply with the increase in output. This'is due to the fact that the use o!, more and more of the variable factors, say labour, will lead to overcrowding, and also to problems of organisation. Further, as the existing fixed factor, are used more intensively machines will breakdown more frequently. Al, these lead to sharp increase in AVC., , If AFC and AVC curves are added together we obtain ATC curve ot, #, usually called, average cost (AC) curve. In the beginning as output rises, ATC curve falls because of the predominance of falling AFC curve. A, higher levels of output AVC curve rises quite sharply and therefore, ATC, curve rises after a point. The continuous fall in average fixed costs will, too small to offset it. Thus AC curve is “U’ shaped. |, MC curve is also’U’ shaped as in Fig. 10.1. Marginal cost curve falls initially |, then reaches a minimum point and finally rises. The shape of the MC cun*
Page 5 :
DQ, a, , AeGA, , iE, , put, mal, ises, eo, Ling, or, Al, , = ®. . eB, , a, , iF, , , , Cost - Output Relationship 171, , is determined by the law of variable proportions,, of the marginal product of the variable factor. MC, AVC curves at their minimum. This is due to the importa, , between marginal and average costs., nship between AVC, ATC and MC can be summarised as foll, , that is, by the behaviour, curve intersects AC and, nt relationship, , The relatio’ ows:, AVC, ATC and MC fall first, then reach a minimum and finally rise, as output increases., , 1., , n AVC and therefore, , 2. The rate of change in MC is greater than that i, ch AVC is, , the MC is lowest at an output lower than the output at whi, lowest. =, AVC and therefore, , 3. The ATC falls for a longer range of output than the, inimum AVC., , the minimum ATC is at a larger output than. the m:, 4. MC=AVC, when AVC is lowest., 5. MC=ATC, when ATC is minimum.., , , , , , The relationship between AC and MC is explained below :, , 1. IfMCis below AC, then AC must be falling. This is because, if MC is, below AC, then the last unit produced costs less than the AC of all the, earlier units produced. If the last unit costs less than the earlier ones, then the new AC must be less than the old AC. Hence, AC must he, , falling., 2. If MC is above AC, then the cost of the last unit produced will be, , higher than the AC of the earlier units. Hence, the new, i . , AC, higher than old AC. Therefore, when MC is above AC, AC must os, , rising., 3. If MC is equal to AC, the last unit costs exactly the comps as the AC of, , all earlier units. Hence the new AC is equal to old AC. TI, curve is flat when AC equals MC. ee, , The above mentioned relationship between AC and MC ca, a ‘an be seen clearly, with the help of Fig. 10.2. _