Page 1 :
Business Lconomics, , 122, MODULE- IV:, , COST OF, , (F. Y.B.Com.) (Sem,, , -, , 1), , (Pan., , Paper ), , PRODUCTIONN, , COST, ANALYSIS, , |SYNOPSIS, 1., , Introduction, , 2., , Cost Function, , 3., , Concepts of Cost, , 4., , Types of Cost, , 5., , Cost-Output Relationship inthe Short-run, Shapes of Shortrun Average and Marginal Cost Curve, The Relationship between AC and MC, , 6., 7., , Total, Average and Marginal Cost, , 8., , Cost-Output Relationship in the Long-run/Behaviour of Long-run Cost Curves, , 9., , Relationship between LAC and LMC., , 10. Economies of Scale and the LAC, 11. Learning Curve, , 1 . INTRODUCTION, The aim of the, revenue and cost. To, , producer, , is to maximise its, , profit., , Profit is the difference between, should be increased and cost should be, brought down. The cost can be brought down either by producing the optimum level of, earn, , maximum, , profit,, , revenue, , output or by increasing factor productivities or by improving the efficiency of the, organisation. The profit maximising firm need to monitor, , Cost refers, , commodities., , Cost of, , decisions such, a product and, , and cost continuously., to bear for, producing the, It helps managers to take correct, , revenue, , to, , all the expenses which the firm, has, , production provides, , floor to, , pricing., , whether to expand or contract, production, whether to buy or manufacture, so on. Decision about, payment of tax, bonus, dividend, etc. also involve, of cost making effective and, right decisions depends much on the proper, calculation of cost., , computations, , as
Page 2 :
Cost Analysis, , 2., , 123, , COST FUNCTION, Cost function, on is, , oblained from the, , presses the relationship, chart-run cost function and, , between, , Long-run, , Short-run Cost Function, In, , the short, , Short, Where, , run, , run, there are two, , production functition and the market supply of inputs, , costs and output, Cost, cost function., , functions, , are, , of two Kinds, , major categories of costs: fixed costs and variable costs., , cost function can be written as, C =f(Q, T, P), C total cost, Q, , output, , technology, prices of factors, , P, 2., , Here technology and factor, Long-run Cost function, , prices, , are, , assumed, , to, , be constant., , long run, however, all costs are variables., long run cost function can be written as, C =f(Q,, , In the, , The, , Where,, , C, , Q, , total cost, , T, P), , = output, , T technology, P, , prices of factors, , 3. CONCEPTS OF COST, There are various concepts of cost., , 1. Explicit and Implicit Cost, Money cost is the total money spent by the firm on purchasing the different units of, factors of production needed for producing a commodity., Money cost include both explicit as well as implicit cost., , Money cost Explicit cost + Implicit cost, =, , Explicit cost: Explicit cost is the direct contractual money payments made by the firm, , for purchasing or hiring the services of various factors of production. In other words, Explicit, costs refer to the actual money outlay or out of pocket expenditure of the firm to buy or hire, tne productive resources it needs in the process of production., , Explicit cost include the following, Costs of raw materials;, Wages, and salaries;, , Power charges;, Rent of business or factory premises;, , of capital invested;, Insurance premiums;, licence fees, etc.;, Interest payments, , like property tax, duties,, like marketing, Miscellaneous business expenses, axes, , and, , advertising, , expenses, , (selling, , Costs), transport cost, etc., the firm. These are recorded, payment made by, he above list of items is an explicit, known as, cost or, of production. It is, thus, incurred accounting, process, xp, the, during, the, firm., enditures, by, expenditures, are actual monetary, tmoney costs, as these, cOst because this cost appear in the, the accounting, Explicit cost is also called as, CCOunting record of the firms.
Page 3 :
Business Economics (F.Y.B.Com.) (Sem,, , 124, , -, , 1)1) (Paper-, , not hired by the firm but, cost: Implicit cost is the cost of factors that are, nplicit, ownet, himself. In otherw, words, Implicit costs is the opportunity cost of the use of lactors whi, ou., , by, , firm does, , not, , Implicit, , ich a, , buy hire but already owns., cost is also calle as indirect cost because it is, or, , Implicit costs is imputed, , not, , directly incurred, , by the firm, paid out by, factors ownecd the, , yments which are not directly or actually, , c i t cost àrise when the firm or entrepreneur supplies certain, , himseli. For instance, the entrepreneur may have his own land in production, for which nby, rent is to be paid in the actual sense. But this, however, is to be reckoned as a cost, assumin, , ning, , that if the entrepreneur had rented this land to somebody, he would have definitely earne, some rent., , Hence, such rent is to be imputed and, Implicit cost include the following, , med, , regarded as implicit money cost, , Wages of labour rendered by the entrepreneur himself., Interest, , on, , capital supplied by the entrepreneur., , Rent of land and premises belonging to the entrepreneur himselí and used in his, , production., Normal returns (profits) of entrepreneur, a compensation needed for, management and organisational activity., These items are to be valued at current market rates for, estimating the implicit, , money, , cost. These are implicit money costs, because these go to the entrepreneur himself., 2., , his, , Accounting and Economic Cost, Accounting Cost: Accounting cost refers only to the actual money spend by the firm. t, , consists of only those payments which are, actually made. An accountant, accounting cost against receipt vouchers only. It covers only explicit costs., , recognizes, , i.e. Accounting cost = Explicit cost., , Accounting cost include the following, Wages for labour,, Rent for land, etc., , Economic Cost : Economic cost refers to the total money cost incurred by a firm tor, producing a commodity. It includes both explicit and implicit cost., i.e. Economic cost, , When the firm is, COst, , Explicit Cost+ Implicit Cost, making profits it mean that its total revenue, , Economic costincludethe, , is, , more, , than the economic, , following:, , Costs of raw materials,, Rent of land and, 3., , premises belonging to the entrepreneur,, , etc., , Private and Social Cost, , Private Cost: Private, , cost is, , micro concept., Private cost is the cost incurred by a private, , commodity., In other words, Private, , a, , individual, , or, , firms for, , producing, , cost refers, , to the costs involved in the operation of producti, activities undertaken by the private individual or a firm. It is, usually measured in terms, money in the absolute sense. Private, is included, in price. Private cost are, cost, internali, i.e., incorporated in the firm's total cost of production., Social Cost: Social cost, on the, which are borne by the firm but are, , other, , hand, is, , a, , macro, , concept. Social cost is the Co, , sts, , incurred by others in the society. It refers to the soe, directly indirectly. It affects the people in the, , sacrifice involved in the productie process, or, cOciety at large. Social cost Delng nnnedsurabie it cannot be, , cial, , included, , in the, , price.
Page 4 :
125, ( o d, , Analsis, , regards, arshall, a, , social cost, , the real cost of, production., u, ording to Marshall, the real cost of production significs toils, troubles, sacritice, Acco, of consumption for, of loss, savings, social effects of pollution caused by lacty, nt of, loss of, , COUnt, , smoke,, automobiles,, , A, , buyer ot, , etc., , product, , a, , as, , actually, , pays, , only, , a, , market price for the, , product, , in monetiy, , in many cases there is a social cost which goes unaccoun, unted., , Ierms. But,, , Motorists, tior instance, pays the price of petrol. It is expressed in terms of money., nditure. But, when the use of petrol creates pollution on the roads, people's, their private, nmental distraction is a social cost., health is attected it is the social cost. Environn, When an oil refinery discharges its waste in the river causing water pollution. Mills a, factories located, , in a city cause air pollution by emitting smoke. Such costs are termed, , ernal costs from the firm's point of view and social cost from the society's point of view., , Historical and Replacement Cost, Historical Cost: Historical cost is the actual cost incurred at the time of purchase of tne, , 4., , sset. In other words, historical cost refers to the original price at which the assets was, It is also known as actual cost. Historical cost is widely used in the traditional, , nurchased., , accounting system., , Replacement, incur if it wants to, , Cost, , : Replacement, , replace, , refers to the cost that the firm would have to, In other words, it is the cost of replacing the asset, , cost, , the assets now., , in the current period. Replacement cost is widely used in practical decision making, , if the price of machine at the, if the present price is R 20 lakhs then, For e.g.;, , and, , 10 lakhs, time of purchase i.e. says in 1977 was, 10 lakhs, the historical costs and 7 20 lakhs is, , is, , the replacement cost., , 5., , Sunk and Incremental Cost, , which cannot, Sunk Cost: Sunk cost refers to the cost that has already been incurred and, be recovered. It is also known as retrospective cost. As the sunk cost cannot be recovered,, while making future economic, it is irrelevant for decision making i.e. it should be ignored, Sunk cost is called as, decisions. All past or actual costs are regarded as sunk cost., unavoidable cost or uncontrollable cost because it is the cost which cannot be altered by a, will remain same whatever be the level of, change in the nature of business activity i.e. it, business activity., in overall cost that result from a, Incremental cost: Incremental cost refers to the change, cost is the additional cost, particular decision implemented by the firm. Incremental, Incremental cost include additional raw, associated with manufacturing additional quantity., will affect the total cost. Incremental cost, materials, additional human resources etc., all this, I5relevant for short-term decisions making. Incremental cost is called as avoidable cost, Decause this cost can be avoided by not bringing any change in the business activity., 6., , Fixed and Variable Cost, , fixed whether the output increased, Fixed cost refers to those cost which remain, DECreased. It is those cost which remain constant, irrespective of the level of output., , Fixed cost include :, Payments of rent for building;, Interest paid on capital;, Insurance premiums;, Depreciation and maintenance allowances;, , Property taxes;, Administrative, , expenses, , Salaries, , of managerial and office staff,, , etc., , or
Page 5 :
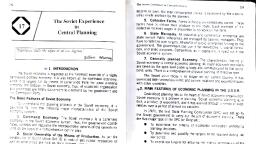
Business, , 126, , These costs remain unchanged, therefore known as "supplementary, COsts, , they, , because, , are, , to, , be, , even, , cost", , incurred, , Economics (., , Fixed costs may be, (i) Allocable Fixed Costs., , -, , -1) (Paper, , of the firm is nil. Fixed, if the output, or, , even, , "overhead cost",, , if the, , firm is shut, as, , not change, current production may be nil. Further, they do, costs", fixed costs are also regarded as "unavoidable contractual, no output., , Y.B.Com.) (Scm., hese, , down, , ou, , costs are, , temporarily, , COst, , anc, , the output increases, , which OCcur even, , (i) Recurrent Fixed, classified into two categories:, , ifth, , ere is, , Costs and, , rise to cash output as certain exnl., Kecurrent fixed costs are those which give, insurance premiums, salaries of permana, like, on capital, general, interest, rent,, payments, , blicit, , irreducible staff, etc. are to be made at a regular time-interval by thefirm. Ihe allocable fivd, , cOsts refer to implicit money costs like depreciation charges which involve no direct Cack, sh, Outlays but are to be reckoned on the basis of time rather than usage., , Variable Cost, Variable cost refers to the cost which vary according to the level of output. It is thosa, cost which vary directly with the level of output. That is, variable cost rise when output, expands and fall when output contracts. But when output is nil, they are reduced to zero., , Variable cost include :, Prices of raw materials,, Wages of labour,, , Fuel and power, , charges,, , Transport expenditure,, , Electricity charges,, Excise, , duties, sales tax, etc., , Variable cost is referred as "direct cost" or "prime cost" because these costs can be, altered in the short run as the output alters. Variable costs are also regarded as "avoidable, contractual costs' when output is nil., Variable cost may be classified into two categories: (i) fully variable costs and (i), semi, variable costs. The fully variable cost vary more or less at the same rate of output, e.g, cOst, of raw materials, power, etc. Semi-variable costs are, however, those costs which do not, change with output, but they will be completely eliminated when output is nil., , 4., , TYPES OF COST: TOTAL, AVERAGE AND MARGINAL cOST, There are three costs in the short-run : (1) Total cost, (2) Average cost, (3) Marginal cost, 1. Total Cost (TC) : Total cost refers to the total expenditure made by the firm to, , produce a given quantity of output. The total, TC = f(Q), , two, , cost, , of the firm is the function of, output (Q), , Since the output (Q) is produced by fixed and variable factors, total costs is divided in, parts Total Fixed Cost (TFO) and Total Variable Cost, , (TVC)., , TC, , TFC+ TVC, (Here, TC Total Cost, TFC Total Fixed Cost and, TVC Total, The behavior of short period total cost is explained with the Variable, help of Cost.), Table 7.1dand, =, , =, , =, , Fig. 7.1.
Page 6 :
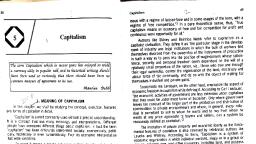
Anal) sis, , 12, , Output, , Total Fixed, Cost ), , (Units), , Total Variable, , 10, , 10, , 10, , 10, , 20, , 20, , 30, , 30, , 40, , 10, , 40, , 50, , 10, , 50, , 60, , 10, 3, , 10, , 4, , 5, , Total Cost, , Cost R), , TC, , 60, , TVC, , TC is the vertical summation, , ofTFC+TVC, , 50, , 40, 30, , 20, 10, , -TFC, , 2, , X, , 34, Output (Units), Fig.7.1, , In the above Fig. 7.1, TC is the total, and TVC curves. TC and TVC curves are, , output., , With increase in, , output,, , TVC also, , cost curve, which represents the aggregate of TFC, level of, parallel to each other. TVC is zero at zero, increases., TC also, increases., , Accordingly,, , a)Total Fixed Cost (TFC), , made by the firm on the fixed factors of, Total Fixed Cost refers to the total expenditure, TFC remain same at all the levels of output., production in the short run. In short run,, behaviour of fixed cost., Table 7.2 and Fig. 7.2. illustrate the, Table 7.2, , Output, (Units), , Total Fixed, , Cost ), , 0, , 10, , 1, , 10, , 2, , 10, , Fixed costs remain constant, even when the level of output, , 10, , changes., , 3, 4, , 5, 6, , 10, 10, 10
Page 7 :
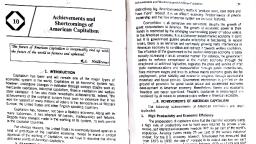
128, , Business Economics (F.Y.B.Com.) (Sem. - I) (Paper-, , -I), , TFC, , O12 3 4 5 6, , X, , Output (Units), Fig.77.2, , In Fig. 7.2. TFC is the fixed costs curve. It is parallel to X-axis, showing that cost remains, the same, whatever be the level of output., b) Total Variable Cost (TVC), , Total Variable Cost refers to the total expenditure made by the firm on the variable, factor in short run., The total variable cost increases when the output is increased and vice versa., Table 7.3 and Fig. 7.3. illustrate the behaviour of variable costs., Table 7.3, , Total Variable, Cost, , Output, (Units), 0, 1, , 12, , 2, , 22, , 3, , 30, , 4, , 36, , 5, , 42, , 6, , 50, , Variable costs change with, change in the level of output., , TVC, Variable cost (VC) curve is, inverse S-shaped curve, , 50, 40, 301, , 20, 104, , 2, , 3 45 6, , X, , Output (Units), , Fig. 7.3, , In, that, , Fig., , 7.3 TVC, , costs are, , curve, , shows, , increasing with, , variable, , costs., , increased output., , It is inverse, , S-shaped, , curve, , meaning thereby
Page 8 :
s tAnalysis, , Cost, Cost (, , (AC):, t. It obtained byAverage Cost or Average, dividing total cost, , 2. Average, ioutput. It is obta, , U n to r, , tal cost refers, total, by total unit of, output., , AC, We, , an also, , define short period, average, , ge variable cost i.e., , AC, Here, AC, AC, The, , cost, , AFC + AVC, , Average Cost,, , behaviour, , 129, , of short, , Fig. 7.4., , AFC, , =, , to, , the total, , cost, , per, , as the sum total of average fixed cost and, , Average Fixed Cost, AVC Average, ge Variable Cost., cost is, =, , period average, , explained, , with the, , help of Table, , 74 and, , Table 7.4, , Output, (Units), , Average, , Average, , Fixed Cost, , Variable Cost, , Average, Cost, , 0, , 10, , 12, , 22, , 11, , 16, , 3.3, , 10, , 113.3, , 2.5, , 9, , 5, , 11.5, , 2, , 8.4, , 6, , 10.4, , 1.67, , 8.3, , 9.97, , 1.42, , 8.8, , 10.22, , 10, , 11.25, , 5, , 3, , 1.2, , 8, , 5, , Y, 24, 20, , Short period average cost, , 16, , AC, , 12, , AVC, , 8, , AF, 01, , curve (AC) is the vertical, , summation of AFC and AVC, curves, , X, , 2 3 4 5 67 8, Output (Untits), Fig. 7.4, , 1g.7.4 is drawn using the data of Table 7.4. From the diagram, it is clear that short, Od AC is U-shaped. In other words, it falls downwards initially and having reached its, ninimum point it, to rise, 3), , begin, , upwara., , Average Fixed Cost (AFC):, , Verage Fixed Cost refers to the total fixed cost per unit of output. It is obtained by, total fixed cost by the total unit of output., , dividi, , AFCTFC
Page 9 :
nhes, , Average flxed, , Output, (Units), , cost ia, , lmun, , s, , (1.Y.N.Con.) (Sem,, , of Table 7.5 and, explaind with the hep, Table 7.5, , Total Fixed, , - 1), , (Pane, , aper-, , Fig 7.5., , Average Hixed Cost, , ost, , 10, , 8, , 10, , 10, , 10, , 5, , 10, , 3.33, , 10, , 2.5, , 10, , 2, , 10, , 1.67, , 10, , 1.42, , 10, , 1.25, , AFC goes on diminishing wit, increase in output., , gular hyperbola, AFC is a, all, showing (at its output) the, same level of fixed costs., , Rectangular Hyperbola, , AFC, , O, , 2, , 3, , 4 5 67, Output (Units), , 8, , X, , Fig.7.5, b) Average Variable Cost (AVC), , Average Variable Cost refers to the total variable cost per unit of output. It is obtained by, dividing total variable cost by the total units of output., , AVC TVC, Q, Table 7.6 and Fig. 7.6. illustrate the behaviour of average variable cost., Table 7.6, OutputTotal Variable Cost, , Average Variable Cost, , (Units), 0, , 8, , 12, 22, , 12, , 30, , 10, , 36, , 9, , 42, , 8.4, , 50, , 8.3, , 62, , 8.8, , 80, , 10, , 11, , AVC is diminishing, , up, , to, , sixth unit, , thereafter increasing8
Page 10 :
131, , Cost, AnalySis, , 12, , AVC, , AVC is U-shaped, , O 12 3 4 5 6 7 8, Output (Units), , Fig. 7.6, , Marginal Cost (MC), , 3., , i, , unit, Marginal Cost is the addition cost made to the total cost by producing an additional one, , output., , It is the ditference between total cost of all units of, , output and total, , cost of, , units less., , MC = TCn-TCn-1, OR, , ATC, , MC = O, , Further, fixed cost do not vary with output and therefore fixed cost will not affect MC., , Marginal costs is independent of fixed costs. On the other hand, variable cost vary with, cost can be calculated, output and therefore MC depends only on variable cost. Marginal, irom total variable cost and hence MC curve can be derived from the TVC curve., , Marginal cost is explained with the help of Table 7.7 and Fig. 7.7., Table 7.7, , Output, (Units), , Total, , Total, , Fixed Cost Variable Cost, , Total Cost Marginal Cost, , 10, , 0, , 10, , 10, , 12, , 22, , 12, , 10, , 22, , 32, , 10, , 10, , 30, , 40, , 8, , 4, , 10, , 36, , 46, , 6, , 5, , 10, , 42, , 52, , 6, , 6, , 10, , 50, , 60, , 8, , 10, , 62, 80, , 72, , 12, , 90, , 18, , 8, , 10, , MC, 18, , 61, , 14, 12, 0, , X, I2, , 3 4, , 5, , 6, , Output (Units), Fig. 7.7, , 7, , 8
Page 11 :
Business Economics (T. Y.B.Com.) (Sem. - 1) (Pan, , 132, cannot, , additional cost, is an additional cost. By definition,, cost, the sum total of marginal, Can only be variable cost. Accordingly,, different levels of output becomes TVC. Thus,, , Marginal, , cost, , be, , fixed, , co, , correspondina, ng t, , EMC = TVC, , (Nov. 2017, , Illustration1:, Given, , TFC, , as, , 55 and the, , following data,, , calculate TVC, MC, AFC, AVC and AC., 4, , 2, , Q, , 1, , TVC =, , MC, , 135, , 110, , 90, , TC, , 170, , AFC, , AVC, , AC, , 55, , 20, , 75, , 15, , 27.5, , 17.5, , 45, , 55, , 20, , 18.33, , 18.33, , 36.66, , 135, , 80, , 25, , 13.75, , 20, , 33.75, , 170, , 115, , 35, , 11, , 23, , 34, , TFC, , TC, , TVC, , 55, , 75, , 20, , 55, , 90, , 35, , 55, , 110, , 55, 55, , MC, , TC - TFC, , TCn, , -TC-1, , AFC FC, Q, , AVC, AC, , 5., , TVC, , Q, , COST-OUTPUT RELATIONSHIP IN THE SHORT-RUN, Short-run is a period of time in which the firm can vary its output by varying only the, , variable factors such as raw materials but the fixed factors such as capital equipment cannot, , be varied i.e. it remain the same. Thus in the short-run, a firm is tied to a particular plant, , capacity., The cost-output relationship in the short run explains the variations in costs resulting, from variations in the level of output. To examine the cost output relationship in the short, , run, we may begin our analysis with consideration ofthe following cost concepts, 1. Short-run total cost and output., 2. Short-run average cost and output., 1., , Short-run total cost and output, To examine the cost - output relationship in the short-run, we may begin our analys, , with consideration of the following three total cost concepts., , 1. Total Fixed Cost (TFC): Total Fixed Cost is the cost, , y, , incurred on all the fixed factors like machinery at any given level, of output. Fixed cost is not related to the level of output., , cost, , TFC, , In the fig. 7.8, fixed cost (TFC) curve is a horizontal straight, line parallel to X-axis. The curve shows that the total fixed cost, remains same, whatever be the level of output., , 0, , output, Fig. 7.8
Page 12 :
133, ble Cost (TVC): Tolal Variable Cost is the cost incurred on all the variable, , 1olal Varialble, , aClors like raw material at any given level of output. Variadie, /, , Cost is related to the level of output ie. it varies directly with the, , change, , in, , the level of output., , Fig 7.9 shows total variable cost curve. It is inverse, shaped curve starting from the origin, showing that costs, increasing with increased output., , oulput, , Fig. 7.9, Total Cost (TC): Total Cost is, , the total cost, , incurred by, , are, , TC, , ucing a given level of output. Total cost is the, firm in produc, the, o f total fixed cost and total variable cost., COst, , TFC + TVC, i.e. TC=, , Eio, 7.10 shows that the TC curve has the same slope as the, output, , sC curve hut it is above TVC Curve. The TC curve starts from, above the origin because even at zero output, irms bears some, , Fig. 7.10, , fixed costs., , Table 7.8 Total Cost, , Fixed Cost Variable Cost, , Output, , Total Cost, , (Units), , ), , ), , (1), , (2), , (3), , (2+3), , 10, , 0, , 10, , 10, , 12, , 22, , 10, , 22, , 32, , 3, , 10, , 30, , 40, , 4, , 10, , 36, , 46, , 5, , 10, , 42, , 52, , 6, , 10, , 50, , 60, , 1, , The total cost-output relationship in the short run can be explained by assuming a, model., Suppose there are two inputs namely capital and labour. It is assumed that labour is a, variable input and capital is a fixed input., 1. TFC is constant at all levels of output. It is the same even when the output is nil., Fixed cost are thus independent of output., , 2. TVC varies with the output. The TVC curve starts from the origin O. It is nil when, there is no output. TVC are zero when output is, , zero and rises when output rises. Initially TVC, Increases at decreasing rate but after sometime it, rate. Behaviour of TVC is, at, , ncreases, , TC, TVC, , increasing, , determined by law of variable proportion., TC is vertical summation of TFC and TVC. TC, as the TVC curve. TC, has the same, , urve, , slope, , in the, ncreases with increase in output. Thus,cost are, Snort period, the changes in total, total variable, entirely due to changes in the, of, Costs, as fixed costs, the other component, , olal costs, remain constant., , TFC, , y, output, Fig. 7.11, , X
Page 13 :
Business Iconomcs (1.Y.B.C om.) (5em., , 134, , ) (Papr, , In the above Fig. 7.11., a), , Since TFC remain constant, TFC, , curve is a straight horisontal line parallel to, o X,v, X-axis, , of all levels of output., V C c u r v e begin at zero and then slope upward. Initially it rises gradually, tu, , denoting characteristic of fixed, , costs, , eventually becomes steeper denoting a sharp rise in total varable (osls. The upwr, , rising total variable costs are related to the size of the output., C)TC cuve is upward sloping. The TC, because the, , shape, , of, , TC, , is, , largely, , curve has the same slope as the TVC irv, influenced, , by, , the, , shape oi, , TV.., , But it i, , is, , everywhere above TVC., , 2., , Short-run average cost and output, The average cost and output relationship in short-run is explained by considering, , following concepts, 1., , Average Cost: Average Cost or Average Total Cost (ATC) is obtained by dividing T, , by the level, , of output produced., , Short Run, , AC, 2., , Average, , level, , Cost is the, , TC, =, , total of average fixed, , sum, , cost and average variable cost., , AFC + AVC, , Average Fixed, , output produced, 3., , ATC, , ., , Cost:, , Average fixed, , of output produced., Marginal, , by, , the level of, , AFC =, , Average Variable Cost: Average, , 4., , TFC, , by dividing, , cost is obtained, , Cost:, , ., , AVC, , Variable Cost is obtained, , by dividing, , TVC, , by, , the, , TVC, , =, , Marginal Cost, , is the addition made, , to the total, , cost, , by producing, , one more units of output., MC = TCn-TCn-1, The, , properties of the average, , cost, , (AFC, AVC, ATC) and, , marginal, , cost c a n, , briefly, , described as follows:, Table 7.9, , Output, , TFC, , TVC, , TC, , AC, , AFC, , AVC, , MC, , 100, , 100, , 120, , 120, , 100, , 20, , 20, , 20, , 100, , 25, , 125, , 62.5, , 50, , 12.5, , 5, , 100, , 13.33, , 100, , 33.33, , 3, , 140, , 46.66, , 15, , 40, , 25, , 4, , 150, , 37.5, , 10, , 50, , 12.5, , 100, , 20, , 16, , 100, , 180, , 36, , 30, , 80, , 16.66, , 20, , 100, , 220, , 36.66, , 40, , 120, , 2, , 5, , 6, , be
Page 14 :
Analysis, , 1, , Y, , MC, AC, AVC, , AFC, , X, , Output, AFC goes, , 1., , Fig. 7.12, on, , diminishing, , with the increase in, output but, , it never, , becomes, , zero., , AVC initially fully reaches a minimum and then rises as output increases. Av cUrve, is a 'U' shaped curve., 3. AC initially decreases as output increases, reaches a minimum point and then starts, , rising. AC curve is a 'U' shaped curve., 4. MC declines initially as output increases, thereafter finally increases thus MC Curve, , is also 'U' shaped curve., 5. When the AC is minimum MC =AC., , 6. SHAPES OFSHORT-RUN AVERAGE AND MARGINAL COST CURVE, The behaviour patterns and relations of short-run unit costs become more explicit when, , we plot the cost data on a graph and draw the, respective cost curves., , 7.13, however, depicts a generalised form, of cost-behaviour in the short run. Here, the cost, smoothed out, curves are drawn as the idealised or, , MC, , Fig., , ATC/AC, AVC, , versions of the cost-data., , Fig., , illustrates four short, , 7.13, , cost, , period, , 8, , curves, , 1., , 1. AFC curve,, , 3., , ATC (AC)curve, and, , 2. AVC curve,, , 4., , MC curve., , The AFC, , curve, , is, , rectangular hyperbola, , that overheads costs, when output is increased., , indicating, , 2., , curve, , spread, , are, , AFC, , out, OUTPUT, , Curves, , Fig.7.13: Short-Run Average Cost, indicating that, The AVC is a U-shaped curve, then rises with, AVC initially falls and, returns., diminishing, reflects the law of, It, curve is, c u r v e s . The ATC, increasing output., AFC and AVC, , A T C curve, , shaped., MC curve, , is viewed, , as, , the, , sum, , It is, is also U-shaped., , Average Fixed Cost Curve (AFC, , U., , of the, , TVC, derived from the, , curve, , curve., , and larger output, costs get spread over larger, fixed, the, total, increases, the, declining. Consequently,, the, output, on, progressively, AS, its entire stretch., fixed cost goes, the right throughout, therefore, the averagedownwards from the left to, it gets very, asymptotically, i.e.,, both the axes, age fixed c u r v e slopes, approaches, AFC curve, athematical terms,, axis., of average fixed cost, that the product, close to but ver touches either, fixed cost is, remains c o n s t a n t . In, average, always, c h a r a c t e r i s t i c of, level of output, An, , important, , for a8iven level of output multiplied by, , a, , the given
Page 15 :
Business t conomics (F.Y.B.Con.) (Sem. - ) (Paper., , I36, , Paper -), , our illustrative cost schedule, if we multiply the average flxed cost tor chairs hy th, , corresponding number of chairs, thee product would be in all cases, , 200 which is the toal, , fixed cost. Geometrically, a curve representing such data is always a rectangular hyperb,l, Hence, the AFC curve is a rectangular hyperbola. I, thus, implies that any point on the cur, gives the same total cost as the product of multiplication of average fixed cost by the units od, , output. This property of the curve signifies the fact that total fixed cost is constanu, , stant, , throughout., Average Variable Cost Curve (AVC Curve), , The average variable cost generally declines in the initial stages as the firm expands and, , approaches the optimum level of output. After the plant capacity output is reached, the, average variable cost begins to rise sharply. Thus, usually the average variable cost curve, , declines initially, reaches the minimum and then goes on rising. The AVC curve is, thus, , slightly U-shaped, indicating that as the output increases initially, the average variable costis, decreasing, then it remains constant for a while and again starts increasing. There are, thus,, , three phases of AVC curve () decreasing phase, (i) constant phase and (ii) increasing, phase. These stages in the AVC curves correspond to the stages of increasing, constant and, decreasing average product (returns to the variable factors) underlying the law of variabie, proportions., Average Total Cost Curve (ATC Curve)/Average Cost, Curve (AC Curve), Since the average total cost is the sum of fixed average variable costs, the ATC curve is, also a vertical summation of the AFC and AVC curves. Hence, the curve ATC is derived by, , the superimposition of the AVC curve over the AFC curve. As such, the ATC curve is, U-shaped, indicating that if the output of the firm is increased, initially the average total cost, a point, then it remains constant for a while and, thereafter, it starts rising., The lowest point of U-shape average cost occurs at which the quantity of output has a, , decreases upto, , minimum average cost. This output level is called the 'efficient scale' of the firm., , Marginal Cost Curve (MC Curve), The marginal cost curve also assumes U-shape indicating that in the beginning, the, marginal cost declines as output expands, thereafter, it remains constant for a while and then, starts rising upward., , Marginal cost is the rate of change in total costs when output is increased by one unit., In a geometrical sense, marginal cost at any output is the slope of the total cost curve at the, , corresponding point., Apparently, the slope of the MC curve also reflects the law of diminishing returns., In the short run, the marginal cost is independent of fixed cost and is directly related to, , the variable cost. Hence, the MC curve can also be derived from the TVC curve. In fact, the, TC and TVC curves have an identical slope at each level of output, because TC curve is, , derived just by shifting TVC curve at TFC level. Thus, MC can be derived from the TVC curve, and AVC curve is also derived from the TVC curve. However, MC will not be the same as, As matter of fact,, Curve and MC curve are the reflection and the, consequence of, a, the law of non-proportional output operating in the short-run., As a matter of fact, the AVC curve is exactly the reverse of AP curve, whereas MC curve, is exactly the reverse of MP curve., , AVC., , 7., , AVC, , THE RELATIONSHIP BETWEEN AC AND MC, Economists have observed a unique relationship between AC and MC as follows, 1. When AC is minimum, the MC is equal to AC. Thus, MC curve must intersect at the, minimum point of AC curve., , 2. When AC is falling, MC is also falling initially, after a point MC may start rising but, AC continues to fall. However, AC is greater than MC (AC > MC). Hence, ultimately
Page 16 :
C o s tA n a l y s i s, , both costs will, 137, be, lies below the AC, equal., Thus, when MC and AC are falling, MC curve, curve., Once MC Is equal to, AC,, continues to rise further butthennowas the output increases AC will start, rising ana 1C, MC, , at a point, , 3, , be greater than AC., will, when, the costs are, MC curve will both, lie above the AC, , rising, , Therefore,, , MC, , always, , curve., , AC, , above-stated relationship is easy to, see, Arough geometry of AC and MC, curves,, as, shown, in Fig. 7.14., The, , M, , Itcan be seen that:, , Initially,, , 1., , both MC and, AC, sloping downward. When ACcurves are, falling MC curve lies below it. curve is, , 2., , When AC, , curve is, after the point of, MC cunve lies, above it., , rising,, , intersection,, , 3. It follows thus that when MC, is less than, , AC,, , it exerts, , a, , downward pull, , on, , OUTPUT, , Fig., , 7.14:, , Relationship between AC and MC, , the AC curve. When MC is, , more than AC it exerts, the AC curve., MC, must, the minimum. Hence, MC, equal AC, while AC is at, curve intersects the AC, curve at its minimum lowest, from below. It may be recalled that, point, MC, also intersects the lowest, AVC curve. Thus, it is a, point of, significant, mathematical, of, property MC curve that it always, cuts both the AVC and AC curves, at their minimum, points., In Fig. 7.14 thus MC curve crosses the, AC curve at point E. At this, point P, for OQ level, of output the average cost is, EQ which is the, , upward pull, , on, , Consequently,, curve, , minimum., should be noted that no such, relationship can ever be traced between the MC, and the AFC curve,, because, simply, the MC, by, It, , definition,, , cost., , Further,, , the, , area, , output., In, , underlying the, , MC, , curve, , is, , curve, , equal, , fact, the point on each average cost curve, underlying them denotes total costs as under:, , to the total, , measures, , the, , is, , independent, , variable, , average, , of fixed, , cost of a, , cost, , curve, , given, , but the, , area, , 1. Total area underlying the AFC curve measures the total fixed cost., 2. The area underlying the AVC curve measures the total variable cost., ., , The area underlying the MC curve measures the total variable cost., , 4. The area underlying the ATC curve measures the total cost., , Finally, the MC curve is important because it is the cost concept relevant to rational, , 1on-making. It has greater significance in determining the equilibrium of the firm. In, ,, , the increasing MC due to diminishing returns sets a limit to the expansion of a firm, , uring the period. Further, it is the MC curve which acts on the supply curve of the firm., Prom the above discussion of cost behaviour, we may conclude that short-run average, Curves (AVC, ATC and MC curves) are U-shaped, except the AVC curve, which is a, , ectangular hyperbola.
Page 17 :
Business, , 138, , 8., , COST-OUTPUT, , ATIONSHIP, , IN THE, , fconomcs, , LONG-RUN, , /, , (F. Y.B.Com) (Sem,, m.-1), -, , (Paper, , ONG-RUN, OF LON, BEHAVIOUROF, , COST CURVES, , firm to vary all its factor inpute, to enable a, enough, is, long, irom one plant ca, long8-run period, It can m o v e, long run, a firm is not tied to a particular plant capacity. of the changes in demand, the light, to another,, henever it is obliged to do so in, increase in dem, meet the long-term, nand, Can expand its plant in order to, ne, , o, , products. The firm, , reduce plant capacity if there is a drop in demand., Is, , the long, , n, , thus, there, cost, , run,, dichotomy, of total, , no, , analysis., In the, , variable costs, , are only the, into fixed and, , variable, , or direct costs as, , costs, , as, , we, , see, , cost, , total, in, , TL, , There, , the short.., , Tun, , long run, when we examine the unit cost of a, , firm,, , we come across only, , study the shape, average marginal costs. Hence, w e have only, cost curve., ong-run average cost curve and the long-run marginal, to, , and, , the, , relationships of the, , All economic activity actuall,, of fact, the long run is a 'planning horizon'., view tor the future course, of, in the short run, the long run is only a perspective, operates, action. Thus, an economic, entity entrepreneur or consumer Can plan his course of action, As a matter, , in the long run, but in the real course of operation chooses actually numerous aspects of the, , short run. This means, the long run comprises all possible short-run situations from whicha, choice is made for the actual course of operation., , In reality, thus, the long run consists of perspective planning for the expansion ofthe, firm; hence, it involves, , various short-run, , adjustments, , visualised, , period of time., , over a, , Derivation of the Long-run Average Cost Curve, , A long run average cost curve is derived with the help, A short run, of various short run average cost curves., known as 'plant curve' because SAC, average cost is, , SAC,, , H, , E, , represents a particular size of plant., , It is assumed that in short run there, of the plant--- small, medium and large., , can, , be three sizes, , SAC.SAC, , L, , K, , for a, is relevant for a small size plant, SAC2, size plant. When, medium size plant and SAC3 for a large, X, will choose smallest, the output demanded is OA, the firm, D, Output, ABC, medium size plant SAC2 as the, size plant SAC; than the, than the, Fig.7.15, of small size plant (LA) is lower, average cost, When, same output (OA)., medium size plant (HA) of the, the firm will go either for small size plant SAC1 or mediumS12e, the output demanded is OB,, OB, 1e, are equal i.e. QB. But for an output beyond, the, both, of, plants, cost, plant SAC2, as the, small Sie, as the average cost of, OC the firm will choose medium size plant, , SAC, , for, , an, , output, , plant is higher for the same output 0C >, choose, si, For output OD, the firm will cost of large, the, lag, plant (SAC3) as the average, , SAC, , SAC SAC size plant SAC3 is lower than the medium si, LAC, , plant. (FD < ED)., , In the short- run, the firm is tied wi, oves, , firm mo, given plant but in the long- run, the, from one plant to another. As the scal, production, , X, , 0, Output, Fig. 7.16, , is changed, a, , new plant is a e, , least posib, long-run cost of productior is, cOst of production of any given level ot ouhe, , The, , when all, , inputs, , become, , ariable,, , includin,
Page 18 :
C o s tA n a l y s i s, , 139, , of Pa a, , i z e, , plant, , ng-run average, on the, , cost curve is, , decided level of, , called, , Curve', of a firm as, cu, 'planning, The, , it helps, curve is also, , output., long run average, ge cost, curve asit support, or envelopes a group of, run cost., o t touch at, calle LAC does, not, does n, minimum point of SAC's short, the, It is, i, while it Is falling. It is, tangential, tangential, to, the lowest point of SAC wne it is, it is tangential to the, rising portion of SAC while it is, LAC is U-sha, shaped curve that implies initially cost decreas withrising., the increase in output,, const, nstant with the increase in, while cost is, or, output and eventu, ntually cost increases with the, increase in output., c h o o s i r, , a l l e de n v e l o p e c u, , alling portion,, , allingand, , hor, , a, , shaped of LAC curve is, , due to laws of returns, to scale. Falling portion of LAC, law of increasing return to scale, rising, portion, of LAC epresents law of, , represe, , asing return of scale and horizontal portion of LAC shows law of constant returns to, , decreasing return, , stale., , Features, , of the LAC curve, , Eollowing are the main teatures of the LAC curve:, 1., , Tangent Curve, , By joining the loci of various plant curves relating to different operational short-run, , hacas,, phas, , the LAC, , curve is, , drawn, , as a, , tangent, , i.e. the LAC, , tangential to various, SAC curves. It is tangential to the SAC at the falling portion, while it is falling. It is tangential, curve, , curve is, , to the lowest point of SAC, when it is horizontal and it is tangential to the rising position of, , SAC while it is rising. Thus LAC curve is locus of the these points of tangency. SAC curve, , Fan never be below the LAC curve in the long run., Y, , SAC3, , SAC2, , SAC, , Qs, , Q2, , X, , OUTPUT, , Fig., , 7.17, , :, , Derivation of the LAC, , LAC, , curve, , The LAC approximates a smooth. curve, if the plant sizes can be varied by infinitely, Small capacities and there are numerous short-run average cost curves to each of which the, , LAC is a tangent. In the fig. 7.17,the LAC is derived as tangent to various short-run cost curve, , SAC1, SAC2 and SAC3. The LAC is, thus, a flatter U-shaped curve, 2., , Envelope Curve, , because it is the, ne LAC curve is also referred to as the 'envelope curve',, OShort-run average cost curves appropriate to different levels of output., , 7.18,, 8 SACs., tho, the related, , the LAC, , a, , is, , enveloping, , or, , tangential, , to a number of, , plant sizes and, , drawn on the basis of three possible plant sizes. This is a, however, the firm may come across with a choice, umption. Normally,, the LAC is to be drawn with, variety of plants. Thus, more realistically, in, , the LAC, Muck87.17, nuch simplified assum, , among, large, , curve, , envelope of a, , large, , curve is, , number, , of possible plant sizes,, , as, , shown, , Fig., , 7.18.
Page 19 :
,B.Com.) (Sem. - ) (, , Economics, , (F. Y.B.C, , Business, , 140, , Paner -I, , LAC, SAC, , X, , M, TIME, OUTPUT PER UNIT, , Fig., , 3., , 7.18: The LAC, , curve drawn from, , many, , plant sizes, , Planning Curve, , LAC curve is regarded as the long-run planning device, as it denotes the least unit cos, of producing each possible level of output. The entrepreneur would determine his course, , expansion of output and the size of the plant in relation to the LAC curve. A rational, scale of plant is that, would select the optimum scale of plant. The optimum, entrepreneur, plant size at which a SAC is tangent to the LAC, such that both the curves have the minimum, , point of tangency. In Fig. 7.17 at OQ2 level of output, SAC is tangent to LAC at both the, minimum points. Thus, OQ2 is regarded as the optimum scale of output, as it has the, minimum per unit cost. It should be noted that, there will be only one such point on the LAC, , curve to which a SAC curve is tangent as well as both have the minimum points at the point, , of tangency. And as such this particular SAC phase is regarded as the most efficient one. All, other SAC curves are tangent to the LAC but at the point of tangency neither LAC nor SAC, curve has the minimum point. In fact, at all these points SAC curves are either rising or, falling, showing a higher cost., , Anyway, the optimum scale of plant will inevitably be adopted in the long run by the, firm under perfect competition. But the firms under monopoly and monopolistic competition, are less likely to select the optimum plant size., 4., , Minimum Cost Combinations, Since LAC is derived as the tangent to various SAC curves under consideration, the cost, , levels represented by the LAC curve for different levels of output reflect minimum cos, combinations of resource inputs to be adopted by the firm at each long-run level of output., 5., , Flatter U-Shaped, The LAC, , U-shaped or rather dish-shaped. This means that in the beginning, it gradualy slopes downwards and then, after, reaching a certain point, it gradually begins to, curve is, , less, , slope upwards. This implies that in the long run when the firm' adopts a larger scale o, output, its long-run average cost in the beginning tends to decrease. At a certain point, t, remains constant, and then rises. This behaviour of long-run average costs is attributed to tne, operation of laws of returns to scale. Increasing returns in the beginning cause decreasing, costs, constant returns, constant costs, and then, 9., , RELATIONSHIP BETWEEN LAC AND LMC, , decreasing returns, increasing, , costs., , Like the short-run marginal cost-curve, the, long-run marginal cost curve is also deriveu, from the slope of total cost curve at the various points, relating to the given output each tin, The shape of LMC curve has also a tlatter, U-shape, indicating that initially as output expan, in the long run with the increasing scale of, production, LMC tends to decline. At a certa, stage, however, LMC tends to increase. The behaviour of, the LMC curve is shown, Fig. 7.19.
Page 20 :
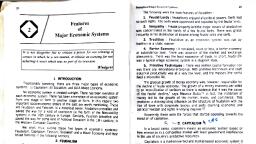
aptu, , 11. LEARNING CURVE, The, , learning, , curve, , indicates the cumulative, , experience in the production of a product, overtime increases efficiency in the use of, inputs (such as labour and raw materials) leading, to the reduction in the cost, per unit of output. It means that with the increase in, in the, experience, , production, productivity gains, , of a, from, , Doing', , The, , learning, , product overtime,, , experience, , curve is, , and, , also referred to, , The, In, , the cost per unit of, output decreases., , improved knowledge, as, , learning curve is graphically shown, the fig. 7.24 the cumulative total output, , Crowwon, P. C.F., and Richards, B.A. Economies for, , is measured, , Managers,, , Ibid, p. 195., , It is, of course,, , 6, , Hague, D.C.,, Ibid., p. 119, , a, , matter of research to, , verify this hypothesis., , Managerial Economies, p., , 119., , as, , 'Learning Dy, , experience curve or efficiency curve., in fig. 7.24., , See, Mc Connell, C.R. and Gupta, H.G., Op. Cit; p. 195, , 5., , called, , Ths, , the, , on, , measured on Y-axis., 3., , are, , p. 49, , X-axis and the cost per unt
Page 21 :
C o s tA n a l y s i s, , 145, YA, , In the fig. 7.24 1C is the Learning, Curve which slopes downward showing, a decline in the cost per unit of output, as cumulative, output increases over, , time and the firm learns from its work, is, curve, The, , experience., , learning, , convex to the origin. The learning curve, , has a steeper, becomes flatter as, , initially, , LC, , Learning, , between, , Curve, , slopes and, shown, , describes, , output and, , then, n, , it, , fig., , relation, , amount of cost, , involved for each output., , Cumulative Total Output, Fig. 7.24, , Algebraically, the learning curve can be expressed as follows:, C, Where, C, , aQb, = the cumulative average time required to produce X units, , a, , the time, , b, , the learning rate, , required to produce the first unit of output, , Q = number of units to be produced, , This formula calculates only direct labour time against given number of units., Learning Curve Effect, According to K.J. Arrow the firm can, carry on their production functions more, efficiently due to increased experience and, , learning. The firm's learning experience, , would reduce costs and this reduction in cost, due to increase in efficiency is referred as, , Effect. The learDing curve, effect mostly occurs in the reduction of cost, in fig. 7.25, per unit of output. This is shown, , Learning Curve, , LAC, , LAC, , The fig. 7.25 shows that the long run, declines from LAC, average cost curve (LAC), to, and then to LAC2. It can be observed, , LAC, , LAC2, , Output, that the long-run average cost (LAC), effect., shift downward which shows learning, Fig. 7.25: Learning Effect on LAC, in, increase, This reduction in cost is due to, unit. The learning, leads to fall in the cost of production per, effect, Thus, learning, efficiency., curve over time., run average cost (LAC), Curves are measured by shifts in long, several kinds of improvements, effect comes through, In real sense, the learning curve, curve, , Suchas, , reached due to, Perfection and precision, , constant, , practice of managerial decision, , making., and business procedure., production, efficient, inding more, take less time, easy and, J o b familiarization, , as, , it becomes, , reducing waste., , Use of better tools and equipment, 5., , More skillful, , movements, , of workers., , to instruct, , workers, thus
Page 22 :
(F.Y.B.Com.), , (Sem., Sem., , Economics, , Business, , / 1), -, , aper-l, , 146, , 7., , quality control method, Right placement of right people, , 8., , management, Better coordination and, , 9., , Less rejection and, , 6, , Better, , redoing of the job, , control., , process, , etc., effect. Learning, , curve, , effect, ct isis seseen, , economy, the scale, eing constan, constan, and input price being, is different from, effect, projection,, Learning, and, estimatod, technology, actual average costs, scale of output,, between, periodic, assuming, difference, of scale are measuro, economies, ured, measured as the, h e learning effect is, way,, technical, effecti, a, The, learning, in costs. In, time period., costs. It implies saving, per, output, of, average, in level, change., LAC as a change, cumulative output, through the given, to, respect, with, the LAC, m e a s u r e d by the shift in, from aircrat, curves, aircraft, industries-ranging, industries-ranging, Importance of Learning, several, in, c o n d u c t o r memov, effect is observed, to s e m i, 1., plants, Learning c u r v e, power, refineries,, building, oil, manutacturing, ship, to 30%., , chip, , 2, , 3., , 4., , production and its, , between, rate varies, , effect rate, , 20%, , is useful, , in production cost, manager, U.S. adopted an, Instruments in the, , to, , a, , knowledge of learning, Texas, For instance,, strategies., It is important in determing, c u r v e effect., forecasting and pricing, in view of the learning, its dominant position., aggressive price strategy, assuming, and, market, advantage in the, information system and, the firm's competitive, integrated, firm, through, incentives and total, be realised by the, Team work,, Learning effect is to, experience., the, with gaining of, effect benefit is enjoyable by, zeal tor improvement, Learning, this regard., wide, a r e crucial in, considered to be economy, cannot be, quality management, but, undifferentiated, industry specific,, industries producing, firm or at the most, new, in, is important, because the phenomenon, rarely fit into this pattern., sectors of the economy, but, many, industries where experience, products, in those, importance, has its strategic, an improvement in, The learning curve, process implies, the, learning, for, enhance the, marked influence, additional cost. This may, factor has its, no, at, or, and quality of output, and maintain leadership, production efficiency, acquire, it, to, and enable, and, market share time, its, firm's competitive advantage, increasing, market, by, in the concerned, dominating position, , The, , again.