Page 1 :
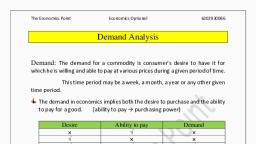
Busness tconomie s (1.Y.H.Com.) (Sn,, - 1)1) (pP, n. -, , (Paper, , 2, MARKET DEMAND, , &, SUPPLY, , SYNOPSIS, 1., , Introduction, Demand, , Supply, Equilibrium Price Determination, , 5., , Case Study, , 1., , INTRODUCTION, , Demand and supply is one of the most, backbone of a market economy., , fundamental concepts of economics, , and it is the, , desired by the buyers. In, Demand represents how much quantity of a product is, made by a consumer. Demand refers to, ordinary language, demand refers to the purchases, , the amount of a commodity which will be bought at a particular price., , refers to the various amount, of a commodity that sellers are able and willing to offer for sale at different price., , Supply represents, Price, therefore is, , 2., , how much the market, , a, , reflection of, , can, , offer. Supply, , supply and demand., , DEMAND, , In economics, demand, willingness to pay for it., , means, , desire for, , a, , commodity backed by the ability, , ana, , Demand Desire +ability to pay +Willingness to pay, Demand refers to the quantity of a commodity to be purchased at a given price per un, of time., , Demand is a function of price, assuming all other factors remaining constant. D = i(P)., , It varies inversely with its price., 1., , Individual Demand, , Individual demand refers to the demand for a commodity by an individual buyer, at, particular price and time, , in the market. Individual demand is part of market demand.
Page 2 :
Market Demand and Supply, , Individual Demand Schedule, , 21, , idual demand schedule, cammodity, , that, , that commodity, , is a tabular, statement, individual consumer, is willing to buy, at a point of time. it, indicates an nverse, while other factors like, income,, , showing different amounts of, corresponding to different prices of, relationship, hetween price and, of, , an, , uLantity demanded, constant., , prices, , Price, , etc. remain, , 100, , 40, , 200, , 30, , 300, , 20, , 400, , 10, , be, , related goods, , Qty. demanded, (units), , 50, , It can, , a, , 500, , from the demand schedule that, when, is 50/- per, unit, the, purchases 100 units of the commodity. When the the price, falls, to, price, 40/consumer purchases 200 units of, per unit, the, when the price, Similarly,, demand goes up and so on i.e. thecommodity., again falls his, table shows that when, falls, price, demand rises and, vice-versa., seen, , consumer, , Individual Demand Curve, When the individual demand schedule, curve., , is, , graphically represented,, , we, , get, , an, , demand, , 50, 40, , 30, , -, , 20, 10, , Demand, , (D), 0, , 100, , 200, , 300, , 400, , 500, , Quantity, Fig. 2.1, In the, , above fig. 2.1, price is measured on Y-axis and quantity demanded on X-axis., At the point 'A' when, the price is, 50/-, the consumer purchase 100 units of commodity., Point 'B' represent the, purchase of 200 units of commodity at the reduced price of F 40/Similarly 'C, 'D' and 'E' represent all other combination of price and quantities. By joining, these points, we get demand curve. The demand curve is downward, sloping indicating that, with the fall in the, price, quantity demanded rises,, 2., , Market Demand, , Market demand refers to the total demand for a commodity by all individual buyers in, the market. In other words, market demand is the sum of individual demands by all the
Page 3 :
Business Economics (F.Y.B.Com.) (5em. - ), , time period, and at a, demand consist of individual demand., , consumer, over a, , given price,, , other factors, , remaining, , the, , (Paper-, , same., , Marks, , Market Demand Schedule, statement of various quantities of a commodity, Market demand schedule is a tabular, of time., a, demanded by different consumers at different prices during given period, Market Demand Schedule, , Market Demand, , Price of the, Commodity x, , A+1B, , Consumer 'B', , Consumer 'A', , 3, , 50, 40, , 2, , 4, , 6, , 30, , 3, , 6, , 9, , 20, , 4, , 8, , 12, , 10, , 15, , 10, , Actually market demand is derived by adding up all the individual demand schedules, The market demand schedule shows an inverse relationship between price and quantity, demanded. When this schedule is plotted on a graph, we get market demand curve., Y, , 50-, , 40, 30, 20, 10, , DM (A+B), , DB, , DA, , o12 4 56789 10 11 12 13 14 15 X, Quantity Demanded, Fig. 2.2, , the above, , fig. 2.2, quantity demanded is measured on X-axis and price is, Y-axis. DA is the individual demand curve, A. DB is the individual demand, of, curve of consumer B and DM is the market, demand curve (DA + DB). The demand curve, DA, DB and market demanded curve DM are sloping downward, In, , on, , measured, , consumer, , shows inverse relationship between price and quantity demanded., , 3., , from left, , to, , right, , which, , SUPPLY, , economics, supply means the quantity of the, commodity offered for sale at different, price per unit of time. Supply refers to the various, of the, commodity which the, sellers are able and willing to offer for sale at different quantity, price during a given period of time., In, , Prof. Thomas: "The, , supply, , of, , a given time at various prices"., , Supply, , is, , a, , function of price,, , goods, , is the, , assuming all, , It varies directly with its price., , quantity offered,, , other factors, , for sale in, , a, , given, , remaining constant S, , =, , market at, f(P)
Page 4 :
Market Demand and SupPply, , 2.3, , 1. Individual Supply, Individual supply refers to the amount of commodity which an individual producer or, seller is able and willing to offer for sale at a particular price during a given period of time., Individual Supply Schedule, , Individual supply schedule refers to the tabular statement showing different quantities, offered for sale by an individual seller at different price at a given time. It is the supply, schedule of an individual firm in the market., Individual Supply Schedule, Price, , Quantity Supplied, (Units), , 1, , 5, 10, 15, , 4, , 20, , Table shows that when the price is 1, the seller is ready to supply only 5 units. But, when price increases to 2, the seller is ready to supply 10 units. Similarly, when the price, again rises, the seller supply more and more quantities. The table shows that when the price, rises the supply also rises and vice-versa., Individual supply curve, Individual supply curve is a graphic presentation of supply schedule showing positive, relationship between price of a commodity and its quantity supplied., , Using the above table we get supply curve:, , 5, , 10, , 15, , 20, , +X, , Quantity Supplied, Fig. 2.3, , In the fig. 2.3, price is measured on Y-axis and quantity on X-axis. SS is the individual, curve which, indicating that at a higher price more is supplied and at, , a, , Ipply, , lower, , slopes upwards, price less is supplied., , 2., , Market Supply, Market supply refers to the total amount of commodity which all producers or sellers, of, a, together are able and willing to offer for sale at a particular price during given period, , time., Market Supply Schedule, Market supply schedule refers to tabular statement showing total quantities of the, , offered for sale by all the individual sellers at different price in a particular, Commodity, period. It is the aggregate supply schedule of all the sellers or producers in the market., , time
Page 5 :
Business Lconomics (F.Y.B.Com.) (Sem., , 1) (Paper, , I), , Market Supply Schedule, Market supply schedule, , Quantity Supplied by, , Price ), , Producer A, , (units)A +B, , Producer B, 5, , 0, , 10, , 5, , 10, , 15, , 15, , 20, , 20, , 25, , 15, 25, 35, 45, , Market Supply Curve, , all individual supply, horizontal summation of, obtained, by, Market supply curve is, the market supply curve. It, on a graph we get, is, schedule, plotted, market, the, curves. When, and quantity supplied, direct relationship between price, , slopes upwards, , to, , the, , right showing, , as shown in the Fig. 2.4., Y, , SA, SB, , O, , 0, , 023 30 3 40 45, , SM (A+B), , X, , Quantity Supplied (units), Fig. 2.4, , In the fig 2.4, Quantity supplied is measured on X-axis and price is measured on Y-axis., SA is the supply curve of seller A, SB is the, supply curve of seller B. SM is the market supply, curve (SA + SB). The Supply curve SA, SB and market, Supply curve SM are sloping upwards, from left to right showing a positive, , relationship between price and quantity supplied., , 4, , EQUILIBRIUM PRICE DETERMINATION, Markets exist in all types of goods and services. The, market price is determined, interaction of market demand and market, by the, This market price is called an, supply., price. It is also called as market clearing price because at, equilibrium, shortages and surpluses. That is there is not excess dermand orthis price market is 'cleared' o, supply at this price., The below table shows the, at which the, point, demand curve meets the, the equilibrium price., is, -, , supply, , curve
Page 6 :
Market, , Demand and Supply, , 25, , Quantity Supplied, , Quantity, , Price ), , demanded, 5, , 5, , 4, , 10, 6, , 6, , 9, , 2, , supply price falls, excess, supply price falls, , Equilibrium, demand price rises, excess demand, price rises, , excess, , 12, , Couilibrium occurs, , excess, , at, , a, , price, , of R 3. i.e., , equilibrium, demanded is equal to quantity supplied. The equilibrium, 6, , units., , When the price, , price, , is 7 3, , where, , quantity, quantity demanded and supplied, is, 3,, , is above the, , of, quantity supplied is greater than, demanded. Firms are unable toequilibrium, sell all they want to at, that price. There is an, Supply and there is pressure for the price to fall. If the, excess, is below, price, 3. there is excess demand and this creates, i.e. below, equilibrium, for the, , quantity, , equilibrium price, , i.e. R 3 is there, , no, , pressure, pressure for price to rise, , price, , or, , to rise., , fall., , Only, , at, , the, , Supply, , Demand, X, , O, , Quantity, Fig. 2.5, , Demand, supply curves are simply graphs of demand and supply, Equilibrium occurs where the supply and demand, curves intersect at an, and, , schedules., , a n d an, price of, equilibrium quantity bought and sold of 6 units. Excess supplyequilibrium, or excess demand, at, any price is simply the horizontal, distance between the supply and demand curves., he, equilibrium price will change wherever there is a change in demand or, supply or, both., Increase in demand, supply remaining unchanged, the equilibrium price rises., , Y, Price, , D, , P, , Quantity, , X, , Fig. 2.6, , In the above Fig. 2.6, P is the initial price determined corresponding to the original, demand (D) and supply (S) curves intersecting at point E. When demand increases,, the demand curve shifts upward to D1. Assuming supply to be unchanged, the D1, Curve intersects supply (S) curve at point E. This means, with an increase in, , 3/E.YB.Com.-Business Economics (Sem.-1) (Paper-l)
Page 7 :
26, , Rusiness lcoomics (F.Y.B.Com.) (Sem. -), , demand,, , supply remaining unchanged,, , the, , equilibrium price, , rises to, , (Paper -), , Ej and, , quantity is demanded QQ)., Decrease in, , b, , mor, , demand, supply remaining unchanged, the equilibrium price falls., D, , Price, , S, , D, , X, , Q,-Q Quantity, Fig. 2.7, , Shift in the demand curve to the left (without, affecting the supply curve) will, decrease the equilibrium price and less quantity is demanded, (QQ1)., c)Increase in supply, demand remaining unchanged, the equilibrium price falls., Price, , D, , P, , Q0, In the above, , Fig. 2.8,, , Fig. 2.8, P is the initial, price, , Quantity, determined, , corresponding to the original, at point E. When, intersecting, supply increases,, the supply curve, ie. S1. Assuming demand to be unchanged, the, supply curve Si intersects demand (D) curve at point E1. This means, with an, increase in supply, demand, remaining unchanged, the equilibrium price falls and, more quantity is, supplied (QQ1)., d Decrease in supply, demand remaining unchanged, the, equilibrium price rises., Price, demand (D), , and, , supply, , (S) curves, shift to the right, , D, , 9,-Q, , Quantity, , Fig. 2.9, , Shift, the, , in the, , supply, , curve to, , equilibrium price and, , less, , the left, , quantity, , is, , (without, , affecting, , supplied (QQ1)., , the, , demand curve) will increase
Page 8 :
Market, , Demalnd., , OBJECTIVE QUESTIONS, A., , Define the following, 1., , concepts:, , Demand, , 2. Supply, , (Nov. 2016), , 3. Equilibrium price, 4., , Market demand, , 5. Individual supply, Fill in the blanks, , B., , :, , refers to the total demand for a commodity by all buyer in the market., The market demand schedule shows, , relationship, , an, , between, , price, , and, , demand., , 3. The market demand curve slopes, refers to the total quantities of commodity offered for sale by all in producers., 4., , 5. When the market schedule is plotted on a graph we get, 6., , he market supply curve slopes, , 7. The, , Curve., , to the right., , is determined by the interaction of market demand and supply., , 8. The point at which quantity demand equals to supply is the, , 9. With an increase in supply, demand remaining unchanged, the equilibrium price, the equilibrium price., , 10. Shift in the supply curve to the left will, 11. Shift in the, , supply curve to the left will, , increase the, , [Ans. (1) Market demand; (2) inverse; (3), supply; (6) upwards; (7) market price; (8), , downward; (4) market supply; (5) market, equilibrium point; (9) falls; (10) increase;, , (11) equilibrium pricel, C., , Multiple choice questions:, ., The market demand curve slopes, , a) downward, , b) upward, , 2. The market supply schedule shows, , from left to right., d) vertical, c)horizontal, relationship between price and quantity, , supplied., d) none of these, C)no, b) direct, The point at which the quantity demanded equals supplied is the,, , a), , inverse, , b)total demand c) equilibrium point d) none of these, a) total supply, 4. A case of increase in demand, supply remaining unchanged, the equilibrium price, d) none of these, c)constant, b) falls, A case of decrease in supply, demand remaining unchanged, the equilibrium price, , a), , rises, , a) falls, , ., , As price-, , c) constant, d) None of these, rises, quantity demanded decreases and quantity supplies increases., , b), , c)remain constant d) None ofthese, b) increases, a) decreases, is derived by adding up all the individual demand., 7. Market., a) demand, , b) supply, , c) price, , d, , none, , of these
Page 9 :
(F.Y.B.Com.), Business Economics, , 32, , ., , (Sem., , -, , I) (Pano, , Which of the following shows the relationship between the price of a good, (Nov.and, 2016), h, amount of the good that consumers want at that pricer, , 9, , a), , Supply curve, , b), , c), , Supply schedule, , d), , The market clearing, a) current price, , price, , D., , -, , b), d), , b), (3 -c), (4, , Match the columns, I., , Production possibilities frontier, , (Nov. 2016), , is also called the., , c)equilibrium price, , Ans. (1 a), (2, , Demand curve, , -a), (5, , -, , prevailing price, None, , of the above, , b), (6 b), (7, -, , -, , a), (8, , b), (9, , -, , C), , Group 'B', , Group 'A, 1., , Market demand, , 2., , Market, , 3., , Equilibrium point, , supply, , -, , curve, , curve, , demand =supply, , a), , b) downward sloping8, , c) upward sloping, , Ans. (1b), (2, , E., , - c), (3 -a)], State whether the following statements are true or false, 1., , The market demand schedule shows, , 2., , quantity demanded., The market supply curve, , 3., 4., 5., , a, , direct, , relationship, , between price and, , slopes upwards to the right., The equilibrium price will, change wherever there is a change in income only., With decrease in demand,, supply remaining unchanged, the equilibrium price falls., With an increase in, supply, demand remaining unchanged, the, rises., equilibrium price, , 6. Shift in the supply curve to the left will increase, the equilibrium, price., 7. Shift in the demand curve to, the left will increase the, , Ans. True: 2, 4,, , 6, , False: 1,3, 5, 71, , equilibrium price.