Page 1 :
Consumption Function, , 1., , 61, , P'RR, , INTRODUCTION, , is the major constituent of aggregate demand in an, Consumption, expenditure, economy. The level of a community's expenditure on consumption is determined by a, multitude of factors such as house-hold income, tastes and preferences, current and, , expected prices, expected future income, holding of liquid assets, interest rates, debts, real, wealth, advertising and sales propaganda, taxation, inflation and availability of goods., , Keynes, however, assumed that in the short run, real consumer spending is primarily, determined by current real personal disposable income (that is, gross personal income, minus personal tax liabilities)., In specific terms, Keynes held that current consumption depends upon current, disposable income. A rise in income leads to a rise in consumption and vice versa, , The empirical consumption-income relationship is represented by the consumption, function., , 2. THE CONCEPT OF CONSUMPTION FUNCTION, As demand of commodity depends upon its price. Similarly consumption of a, , commodity depends upon the level of income., The comsumption function or the propensity to consume shows the relationship, between income and consumption., , Consumption function refers to the functional relationship between total income and, total consumption., Symbolically, it is expressed as, C f(Y), , where,, , C, , f, , total consumption, , functional relationship, , Y = total income, , Here consumption is dependent variable and, income is independent variable., , Consumption function shows that when the income rises, consumption also rises. Hence, consumption is dependent on income. Apart from income there are other factors also, , which influence consumption. But Keynes postulates that ceteris paribus (other things, being equal) consumption is a function of income., Schedule of the propensity to consume / Consumption function., Consumption function is a schedule of various amounts of consumption expenditure, , which people are, , epared to make at various corresponding levels of income. Such a list, , schedule of the propensity to consume or the schedule of consumption, function. A schedule of the propensity to consume is a statement showing the functional, relationship between the level of consumption at each level of income. Such a schedule is, illustrated in Table 7.1., , is also called, , Table 7.1, , Consumption Function, Income (Y) (In crores of ), , Consumption (C) (In crores of), , 200, 300, , 600, , 220, 300, 380, 460, 540, , 700, , 620, , 400, 500, , Table 7.1 shows that consumption is an increasing function of inconme as both, variables, Income (Y) and Consumption (C) move in the same direction. Consumption
Page 2 :
Business Economics (S.Y.B.Com. - Sem., , s's'9, , 62, and, , income, , correlated. When, , positively, , are, , cr. the consumptio, income is 2 0 0, be because a, o v e r income may, , natio, , of consumption, amounting, When income incrases to 300 cr, from, borrowings., o, r, may draw upon their past savings to income. Thus there is no savings and is called th, to, , the, , 7 220, , consumption, , cr., , This, , becomes, , excess, , equal, , break- even point (Y = C)., , change by 80 crores for each, function. This, stable or constant consumption, to, , to, that consumption is shown, , It may further be, means a, 100 crores change in income. This, the short, is o n the assumption of Keynes that in, will remain stable., noticed, , U C= Y), , run, , at, , any rate, the propensity, , consume, , Y, , S, C=A+BY, , C, , ca, B, , 45°, , Y2, , Y1, , Income, , Income GNP (= GNI) (Y, , Fig. 7.1:Linear Consumption, , Fig., , Consumption, Function, as in Figure 7.1. As, , 7.2: Non-Linear, , Function, , a, , We may represent the consumption function diagrammatically, be linear as in Figure 7.1, or non-linear as, matter of fact, the consunption function may, shown in Figure 7.2., and X-axis real income., In both the diagrams, the Y-axis measures consumption, The CC, line which shows Y, A line OU making 45° angle is the income-unity, that, function curve. It slopes upward to the right indicating, c u r v e is the consumption, consumption increases as income increases., function c u r v e CC lies, At lower level of income (less than OY1), the consumption, is greater than the, above the OU line, showing that at lower level of income, consumption, increases, or from borrowings. As income, income. It may be because of the past savings, to, At point B, the consumption OC1 equals, consumption also increases upto point B., break-even point 'B', income, income OY1. This is called break-even point. Beyond the, increase in consumption C1C2 is less than the, increases consumption also increases but the, function curve CC lies below the, increase in income Y1Y2. Therefore the consumption, income-unity line U ., is, consumed is saved, diagrammatically SS, Now, since that part of income that is not, the, and the CC curve. Thus,, the saving the gap between OU, the income-unity curve, on consumption but the, the amount, =, , C., , -, , function, , consumption, , measures, , income-unity, shape and position, , amount saved. The, , line, while the, , spent, be regarded as the zero-saving, thus, line, may, of the CC curve indicate the division of income between, not, , only, (45° line), , consumption and saving., CC, , shape of propensity to c o n s u m e curve, i.e., theThis, to the right, but less steeply than the unity curve., curve, is such that it moves upward, the, Usually,, , as w e, , have, , seen,, , the, , in terms of, shape of the consumption function is explained by Keynes are, states "that m e n, disposed as, fundamental psychological law of consumption when he, but not, , normal, a, , rule and, , on, , the average,, , to increase, , their consumption, , by as much as the increase in their incomes.", , as, , their income increases,
Page 3 :
Consumption Function, , 3., , PROPERTIESOR TECHNICAL ATTRIBUTES OF, In, , dealing, , es, Keynes, , considered, , sume, , onsu, , With the, its two, , and (1) the, , significance., , consumption function, , the, , 63, , cONSUMPTION FUNCIIO, , propensity average to consu, technical attributes or, properties: (i) the average prope, marginal propensity to consume,, both having substantial economc, or, , Average Propensity to Consume, (APC), The average, propensity to consume (APC) is the ratio of total, consumption to total, income in a given period of time. Thus, the, intund by dividing cornsumption by income. average propensity to consume (APC)) can be, , 1,, , Symbolically,, , APC, , where, APC, , =, , C, Y, , Average Propensity to consume, total consumption, and, , =, , total income., , The Fig. 7.3 shows, average, consume (APC). The APC is, , single point, , which, , income., , In, , the, , to, , Y, , measured a, consumption CC curve, , the, shows the ratio, on, , propensity, , of, , at, , consumption, , fig. 7.3, point A, onthe CC curve which is OC1, , measures, , to, C, , APC, , Ci, , y The flatenning, right shows that APC, , of the CC, , curve to the, declines as income increases., , Average propensity to consume shows, the, percentages of income consumed. In table, , 7.2, , the, , Y1, Income, Fig. 7.3, , APC is, , calculated at various levels of, income. When the level of, income is 300, the APC is 100%. As income increases (400,, 600, 700) APC decreases (95%, 92%, 90%,, 88%). The table shows that the APC decreases500,, income increases, because the, proportion of income spent on consumption decreases. as, Since the, average propensity to consume is 100%0, 959%, 929%, 90% and, that the, 88%, it follows, average propensity to save (APS) increases ie. 0, 5%,, 8%, 10% and 12%., Thus, as income increases, the average, to, average propensity to save (APS) increases. proppensity consume (APC) decrease and, Table 7.2, , Income, (Y, , Schedule of Propensity, , Consumption, , to, , Consume, , Average Propensity to, Consume, 3001 or 100%, , 400, , 380, , 400 0.95 or 95%, , 500, , 460, , 460, 5000.92 or 92%, 540, , 700, , 620, , MPC ) AY, , 300, , 300, , 540, , Consume, , APC, , (C), , 300, , 600, , Marginal Propensity to, , 380, , 600 0.90 or 90%, 620, , 700 0.88 or 88%, , 80, 100, , 80, , 100, , 0.8 or 80%, 0.8 or 80%, , 80, , T00 0.8 or 80%, , 80, , T00, , 0.8 or 80%
Page 4 :
Business Economics (S. Y.B.Com. -- Sem, Sem., , 64, , ), , The economic significance of the APC is that it tells us what proportion of the t, cost of a given output from planned employment may be expected to be recovero, by selling consumer goods alone. It tells us what proportion of the total amount, goods and services demanded by the community originates in the demand for consumen, , ered, , goods., , The APS tells what proportion of the total cost of a given output will have to be, recovered by the sale of capital goods. Other things remaining equal, the relatine, development of consumer goods and capital goods industries in an economy depends on, , the APC and the APs. This suggests that in highly industrialised economies, the APCi, persistently low and the APS is persistently high., 2., , Marginal Propensity to Consume (MPC), , The marginal propensity to consume (MPC) is the ratio of the change in the levelo, total consumption to a change in the level of total income. The MPC, thus, refers to the, effect of additional income on consumption., , Marginal Propensity to Consume (MPC) can be found by dividing a change in, consumption by a change in income., , Symbolically,, AC, , MPC, , AY, , where, MPC = Marginal Propensity to Consume, A, , (delta) indicates the change (increase or decrease), and, , AC change in consumption and, AY change in income., , The Fig. 7.4 shows marginal propensity to, consume (MPC). The MPC is measured by the, slope of the cornsumption CC curve. This is, shown in Fig. 7.4 by change in, consumption, (AC) ie. C1C2 and change in income (AY), ie. Y1Y2, , Y, C, , AC, , CI, , AY, C, , MPC 4 S C1C2, AYYYY2, In Table, , 7.2, the MPC, , is, , calculated, , income levels., , X, , Income, , various, , Fig. 7.4, , When the income increases from, 300 cr to 620 cr. Further, the, cr change in income., MPC, , Y1 Y2, at, , 80, , AYTO0, , 300, , cr to, , consumption, , 700cr, the, , is shown, , to, , consumption increases tron, change by T 80cr for each R1, , 0.8 or 80%, , Here, MPC is 0.8 or 80% at all levels which means, the MPC is constant an, therefore, we get linear consumption funcions curve, which has a positive, When MPC is not constant (if MPC, sioy, we get non-linear, falls),, consumption functto, curve.
Page 5 :
Consumption Function, , 1., , MPC is always greater than zero,, , but less than, , Ifpeople spend the entire increase in, If,no portion ot increase in income is, But,, , it, , people, , part is save,, , then, , do not, , 65, , R'o'R, one i.e, , income on, , spend the entire increase, <, , >, , 0 and, , consumption, then MPC, , in, , income, , on, , Thus, if the, , or, , MPS= I, , marginal propensity, , -, , MPC, , to consume is, , according, formula, must be 0.2, as MPC, than unity, MPS tends to be always, positive., to this, , +, , 1.e some, , 1)., , following, , AS, A, , AY, , =, , consumption, , This mean that, MPC will, always be positive but less than one., From the marginal, propensity to consume (MPC), we can derive, nropensity to save (MPS) by, the, formula:, MPS, , 1)., , <, , consumption, then MPC=AC, AY =0, , spend on, , MPC=<1 (or MPC >0 and, , (MPC, , or, , MPS, , 0.8, the, , MPS, , =, , 1, , the, , marginal, , AC, , - AV, , marginal propensity to, , =1. Again,, , as, , MPC is, , save,, , always, , less, , Features of MPC, 1., , According to Keynes, MPC is greater, , 2., , MPCis always positive., , 3, , As income increases, MPC may fall, , 4., , MPC may rise, fall, , than zero but less than, , one, , (0< MPC < 1)., , remain constant between the limit set., However, Keynes implicitly stated that the MPC will not be constant when, cyclical, fluctuations cause changes in objective factors, the propensity to consume., determining, Thus, it may be inferred that during the cyclical upswing, the MPC will fall, while, during, the downswing, it will rise., Keynes, however, opines that the long-run MPC has tended to, decline as nations have become richer., or, , Significance:, The economic significance of the concept of marginal, propensity to, that it throws light on the possible division of, extra, income, any, , (MPC) is, consumption and, investment, thus, facilitating the planning of investment to maintain the desired level of, ncome. It has further significance in the multiplier theory., consume, , It has been observed that the MPC is higher in the case of poor than in that of rich, people. Therefore, in underdeveloped countries, the MPC tends to be high, whereas in, , advanced countries it tends to be low. Consequently, the MPC is high in rich sections and, is, , low in, , poor sections, , of the, , community., , The same is true of rich, , nations., , nations and, , poor, , Empirical relationship between APC and MPC, The two consumption propensities are closely interrelated., When the MPC is constant, the consumption function is linear, i.e. a straight line, curve. The APC will also be constant only if the consumption function passes
Page 6 :
m.- Sem,, , Busincss Economics (S. Y. B. Com, -Se, , g'R'g, , 66, , through, , When it does not pass, , the origin., , constant., As income rises, the MPC also, , APC., As income, rate., , falls, the, , falls,, , through, , the, , but it falls to, , will, MPC rises. The APC, , origin,, , will not be, , the APC will, , greater extent, , a, , also, , rise, , but, , at, , no., , than, a, , the, ., , slou., , we, , SAVING FUNCTION, , ., , or not consumed by th, of income which is not spent, to that, Saving Itrefers, consumer., increases aspart, income increases. Actually, income is divided betwen, , consumption and saving., S S, Hence Y =C+S, Where, Y =total income, C = total consumption, S, , Y-C, , = total saving, , The saving function or the propensity to save refers to the functional relationship, between total income and saving., It is expressed as S = f{Y), , Here, saving is dependent variable and income is independent variable. Saving, function shows that when income increase, saving also increases., , Properties or technical attributes of saving function:, 1. Average propensity to save (APS), 2. Marginal propensity to save (MPS), 1., , Average propensity to save (APS), Average propensity to save (APS) is the ratio of total saving to total income., , Thus, APS =, Since APS is the counterpart of APC, both together constitute total income., ie, APC + APS = 1, , or APS = 1 - APC, , or, , APS = 1, , -, , APC, APS, as, varies, income rises. If APC falls as income rises, then APS, increase as income rises because these two ratio add to 1 at all levels of income. This all, shows that APC is a decreasing fune tion while APS is an, function of, , wil, , and, , 2., , increase in, , increasing, , income., Marginal Propensity to save (MPS), , Marginal propensity to save (MPS) is the ratio of the change in the total saving (AS) t, a change in total income AY., , Thus,, , MPS, , =, , AS, , AY, , Since MPS is also the, income., , counterpart, , i.e. MPC + MPS = 1, , or, , of, , MPC, both together constitute total addition", , MPS= 1-MPC, , or, , MPS, , If the MPC falls as income rises, then the MPS, will increase, these two ratio add to 1 at all levels of income., , as, , =, , 1 -, , AY, , income rises, , becau
Page 7 :
Consumptiom Function, , 67, , The saving function is shown in Fig. 7.6, Total income (Y) Y = C+ S, , ?S, , Saving, , CConsumption Curve, , SSaving Curve, C, , /Dissaving, Saving, 450, , O, , S4, , X, , Dissaving, , Income, S, , Fig:7.6, It is clear from the fig 7.6 that when the level of income is less than OY, the, consumption is greater than income and hence there is dis-saving. The savings curve SS is, , therefore shown in negative quadrant. (i.e belowX - axis). At OY level of income, the, consumption is equal to income and hence, saving is'zero. The saving curve SS intersects, X-axis where saving is zero. When the level of income, increases to OY2, the consumption, , is less than income. The portion of income not consumed is saved. Thus saving portion is, shown by, 1. the vertical distance between the 45° line and, the consumption curve CCi.e. S1S2,, 2. the vertical distance between X- axis and the, saving curve SS i.e. S3S4., , 5, , KEYNES'PSYCHOLOGICAL LAW OF CONSUMPTION, The Keynesian concept of consumption function stems from the fundamental, , psychological law of consumption which states that there is a common tendency for, people to spend more on consumption when income increases, but not to the same extent, as the rise in income,, because a part of the income is also saved. The community, as a rule,, Consumes as well as saves a larger amount with a rise in income., , Thus, Keynes' psychological law of consumption is based on the following, propositions:, When the total income of a community increases, the consumption expenditure of, the community will also increase, but less than proportionately., It follows from this that, and saving., , an, , increase in income is, , always bifurcated into spending, , An increase in income will, thus, lead to an increase in both consumption and, , Savings, This means that with an increase in income in the community, we cannot, normally expect a reduction in total consumption or a reduction in total savings., A rising income will often be accompanied by increased, savings, and a, , falling, , income by decreased savings. The rate of increase or decrease in savings will be, greater in the initial stages of increase or decrease of income than in the later, , stages., The gist of Keynes' law is that consumption mainly depends on income and that, ncome recipients always do not tend to spend all of the increased income, on, Consumption. This is the fundamental maXim upon which Keynes' concept of, , Consumption function is based.
Page 8 :
Bustness Economics (S., , 68, , .Com.-Sem., , Assumptions of Keynes Law:, , Keynes' law is based on the following assumption8, Institutional Factors: Keynes assumes tha, , Constant Psychological and same, constant psychological, owing to the, to c o n s u m e will remain, propensity factors. This means that consumption depends upon income alone. Thatan, institutional, , and institutional factors such, income changes, whereas, all other psychological, only, habits, tastes, price, population growth etc, which influence consumption expenditure, d, , not change., 2. Normal Economic Conditions : The economic conditions are normal in t, economy and there are, revolution, inflation, etc., , no, , abnormal and, , extraordinary, , circumstances such as, , wa, , 3. Laissez-faire Policy It is assumed that there exists a free capitalist economy,i, which there is no government restriction on consumption when income increases. Thi, means that in a socialists economy, Keyne's Law of Consumption is inapplicable., , Implications of the Psychological Law of Consumption, of consumption has the following important implications:, law, Keynes', 1. Highlighting the crucial importance of investment in an economy: A, , vital point, in the law is the tendency of people not to spend on consumption the full amount of an, increase in their income. There is thus a "gap" between total income and total, consumption. Asuming the consumption function to be stable during a short-run period, , the "gap" will widen with an increase in income. This gives rise to the problem of, , investment. Investment should be increased to fill the gap between income and, consumption. Keynes, therefore, stresses that investment is the crucial and initiating, , determinant of levels of income and employment., 2. Refuting Say's Law : Keynes refutes Say's Law of market by indicating the, , demand deficiency and possibility of over production. Say's Law states that supply creates, its own demand but Keynes Law of Consumption refutes Say's Law. According to him, when income increases, consumption also increases but consumption increases less than, the increase in income. This leads to the problem of demand deficiency ie. all that is, , The supply fails to create its, is not automatically, resulting in over-production and unemployment., , supplied, , demanded., , own, , demand, , 3. Explanation of the business cycle/trade cycle : Keynes law of consumption, , explain the turning points of the business cycle. When the trade cycle as reached the uppe, turning point ie. a boom, income increases as much as with the increase in income, , because there is limit to the rise in consumption and so the downward movement start, Similarly, when the trade cycle has reached the lower turning point, income reduces. ur, consumption does not decrease in the same proportion of increase in income because there, is limit to the fall in consumption and the upword movement starts., , 4. Oversaving gap: A.ccording to Keynes, when income increases consumption als, increase but consumption increases less than the increase in income. The part of incon, which is not consumed is saved. As the gap between income and consumption wide, there arises a danger of over-saving., , 5. Income generation : Keynes law of consumption explains the slow nature, income generation. If income increases, it will increase consumption but to smaller extes, than increase in income that is, the entire income is not spend on consumption. This sho, the slow nature of income generation., , 6. Decline in Marginal Efficiency of capital: The expected rate of profitability, marginal efficiency of capital may decline when consumption does not increase in, same proportion of increase in income. As a result, there is fall in demand which in t, , leads to decline demand for capital and the expected rate if profit. But this tendency, , ot
Page 9 :
Consumption Function, , 69, , declining, , arginal efficiency, of, , of, , capital could, , increase in income., , same proportic, , be avoided of, , consumption, , increase in the, , Need of state itervention: Classical economists states that there is, adjustment between demand and, automatc, in the economy as there is absence of, Supply, government intervention. But Keyne's Law of, emphasises gover, intervention. The governmnent should encourage consumption, so that demand does, consumption, and, below, the, ih, fall, supply, problem of overproduction does not arise., FACTORS AFFECTING, 7., , THE, , b., , According, , to, , Keynes,, , subjective and objective., , two, , CONSUMPTION FUNCTION, types of factors influence the consumption, , function, , A. Subjective Factors, , Subjective, , function (i.e.,, The, , its, , factors, , basically, , underlie and determine the form. of the, , slope and position)., , consumption, , subjective factors are endogenous or internal to the economic system itself. Ihe, subjective factors relate to psychological characteristics of human nature, social, structure,, social institutions and social, These are, , practices., remain more or less stable, likely todetermine, during the short period. These factors fundamentally, the form of the, consumption function (i.e. slope and position of the propensity to consume, the C curve)., Human behaviour, and, regarding, out of increased, , consumption, , savingswhich "lead individuals, income, depends on psychological motives. First, there are motives, to, refrain from spending out of their incomes.", Keynes enlists eight such motives:, 1. The Motive of Precaution. The desire to, build up a reserve against unforeseen, , contingencies. Such as accident, sickness etc reduces consumption and increases savings., 2. The Motive of, , eg. old age/ family, 3., , date, , Foresight., , The desire, , to, , provide, , for, , anticipated, , future needs,, , education,, consumption., The-Motive of Calculation. The desire to enjoy a, larger consumption,, of interest and, , by way, , present., , etc. reduces, , appreciation, people prefer, , smaller immediate, , at a, , future, , consumption at, , TheMotive of Improvement. The desire to enjoy a, gradually, expenditure in order to improve the standard of living, people spend less., 4., , increasing, , 5. The Motive of Independence. The desire to enjoy a sense of independence and the, power to do things. People spend less., 6. The Motive of Enterprise. The desire to secure sufficient wealth to carry on, , speculation or establish business projects., 7. The Motive of Pride. The desire to possess or to bequeath a fortune., 8. The Motive of Avarice. The desire to satisfy pure, miserliness, i.e., miserly people, spend less and save more., To this, Keynes adds a list of motives on consumption such as, enjoyment, short, 5ightedness, generosity, mis-calculation, ostentation and extravagance., Subjective motivations also apply to the behaviour patterns of business corporations, and governmental bodies. In this respect, Keynes listed the, following motives for, , accumulation:, , a) The Motive of Enterprise. The desire to do big things, to expand, to secure, , resources to carry out further capital investment,, b) The Motive of Liquidity. The desire to tace emergencies and difficulties, , successfully., , c) The Motive of Improvement. The desire to secure a rising income and to, , aemonstrate successful management., d) The Motive of Financial Prudence. The desire to ensure adequate financial, Provision against depreciation and obsolescence and to discharge debts., , OS.Y.B.Com.-Business Economics-(Sem.-11HPaper-ly
Page 10 :
Business Economics (S. Y.B.Com, 70, , B., , g''*, , Sem. I, , Objective Factors, , function a r e exogenous, or extern., consumption, the, affecting, factors, Thus, obiee, objective, undergo rapid changes., factors may at times, the economy, These, itself., my, function., tactors nmay cause a shift in the consumption, v i o l e n t shifts, in, and causing, changes, to, rapid, subject, Objective factors,, consumption function, are considered below:, accrue to people, th., or losses, windfall, gains, When, Losses., 1. Windfall Gains o r, gains in st, For instance, the postwar windtall, the, in, rich, U.S.A., consumption level may change suddenly., people, spending of, seem to have raised the onsumption, he, , the, , their, , stock, and, , exchanges, to that extent, the consumption function was shifted upward., , is also affected by variations in fisest, The propensity to consume, of heavy taxes tends to reduce th, of the government: For instance, imposition, Policy, may adversely chanoa, so its level of consumption, disposable real income of the community; cause a n upward shift of consumption function, Similarly, withdrawal of certain taxes may, 2., , Fiscal Policy., , to, , consume, , is, , also, , affectedh., , The propensity, war, 3. Change in Expectations., considerabi, For instance, a n expected, expectations regarding future changes. about future scarcity and rising prices. This, influences consunmption by creating fears, i.e. to hoard. Thus, the ratio o, leads people to buy more than they immediately need,, that the consumption function will, , consumption to current inçome, be shifted upward., , will rise, which, , means, , 4. The Rate of Interest. In the long run, substantial changes in the market rate of, interest may also influence consumption. A significant rise in the rate of interest mav, induce people to reduce their consumption at each income level, because people will save, more in order to take advantage of the high interest. Moreover, if the rate of interest rises, then the lending of the present saving (realised by consuming less) will enable one to, obtain an even larger quantity of consumption goods in the future, , In addition to these four factors, Keynes also mentioned changes in the wage level, in, accounting practices with respect to depreciation (indicating the difference between, income and net income), as the objective factors affecting the consumption function., , Keynes' disciples, however, considered his list of objettive factors inadequate and, have listed others which we consider below:, , 1. The Distribution of Income. With the given level of income, aggregat, consumption will vary if income is distributed in different ways among the people. A, community with a greatly unequal distribution of income tends to have a low propensity, , to consume on the whole, while a community with a high degree of equality ofincom, will have a high propensity to consume in general. Thus, redistribution of income throug, fiscal measures of the State will affect the propensity to consume. It may be noted her, that Keynes does not specify income distribution as an objective factor but incudes ", under the common heading of fiscal policy., 2. Holding of Saving - Liquid Assets. According to Kurihara,3 another fact, , affecting the consumption function is the volume of accumulated savings by the peop, The larger the amount of such savings (i.e. holding of liquid assets, like cash balan, savings accounts and government bonds), the more likely people will tend to spend ou, their current income, because the holding of savings in the form of liquid assets, willg, them a greater sense of security. A change in the real value of such assets held by tne, , owing to general price changes, might also affect the consumption function., ot, 3. Corporate Financial Policies. Kurihara observes that business policies, ents, corporations with respect to income retention, dividend payments, and re-investmen, produce some effect on the propensity of equity holders to consume. A cautious divide, en, , policy followed by corporations and corporate savings will reduce the consun, , p t i o n, , function by reducing the residual disposable income of the shareholders (who, consumers, in a way)., , art
Page 11 :
Consumption Function, , 71, , KEY TERMS, , Consumption, , function : Consumption function refers, relationship between total income, and total, consumption., Symbolically, it is expressed as, , to, , the, , funct1ond, , C f(Y), , where,, , C, , total, functional relationship, total real, , consumption expenditure, , f, , Y, Here consumption is dependent variable and income is independent variable., , income, , Average Propensity to Consume: The average propensity to consume (APC) 18 the, ratio of total consumption to total income in a, given period of time. ThuS, the, average propensity to consume (APC) can be found by dividing consumption by, , income., , Symbolically,, APC Y, , where,, , C, , =, , Y, , = total for income., , total consumption, and, , Average propensity to consume shows the percentages of income consumed., Marginal Propensity to Consume : The marginal propensity to consume (MPC) is, the ratio of the change in the level of total consumption to a change in the level of, total income. The MPC, thus, refers to the effect of additional income on, , consumption., Saving function: The saving function or the propensity to save refers to the, functional relationship between total income and saving, , It is expressed as S = f(Y), , Here, saving is dependent variable and income is independent variable. Saving, function shows that when income increase, saving also increases., Average Propensity to Save: Average propensity to save (APS) is the ratio of total, saving to total income., , Thus, APS =, Since APS is the counterpart of APC, both together constitute total income., i e ,APC + APS = 1, , or, , APS = 1 -, , APC, , or, , APS, , =, , 1, , -, , APC and APS varies as income rises., , Marginal Propensity to Save : Marginal propensity to save (MPS) is the ratio of, the change in the total saving (A5) to a change in total income AY., Thus, MPS, , =, , AS, AY, , MODEL QUESTIONNS, Questions and Answers available with scratch card proviaded in the book. Please follow instructions, , Provided for downloading., , function., , Explain the concept ofconsumption, function., Examine the properties ofthe consumption, of, Law, 3., consumption., Explain the Keynes' Psychological, What is consumption function? Explain the factors affecting consumption function., 5,, , 6., , Define consumption function and explain the subjective and objective factors, , affecting consumption., , (Nov. 2017), , What is saving function? Explain the relationship between income and saving., , Explain the implications of the Psychological Law of consumption.
Page 12 :
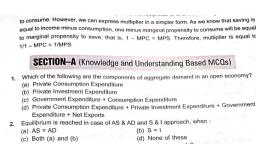
Comsumption Function, , 73, , P'R'R, , APS-10/50= -0.2, , When disposable income was INR 150, billion, , New APS=10/1500.066, Therefore as disposable income increases, the, savings rate rises., OBJECTIVE QUESTION, A., , Explain theifollowing, , concepts., , 1. Consunmption function, 2. Saving function, 3., , Average propensity, , to consume, , 4. Marginal propensity to consume, 5. Average propensity to save, , 6. Marginal propensity to save, B., , Choose the correct alternative from below and rewrite the statements:, 1., , 2., , Consumption function refers to the relationship between, , a) income and consumption, c)saving and investment, b) income and saving, d) consumption and investment, function, shows the relationship, Saving, between,, a) income and consumption, c)income and investment, b) income and saving, d) none of these, , 3. Average propensity to consume =, , a) AC/AY, 4., , b) S/Y, , c)DS/DY, , d) DC/DDY, , b) 1-APC, , Marginal propensity, a) MPC, , 7., , d) AS/Y, , Average propensity to save =,, a) S/Y, , 6., , c) C/Y, , Marginal propensity to consume =, , a) C/Y, 5., , b) S/Y, , to, , save, , b), , is, , c)1-C/Y, the counterpart of., , APC, , d) All of the above, d) All of the above, , c)APS, , Propensity to consume is affected by, a) windfall gains, , c)both a and b, , b) Fiscal policy, , d) Only b, , 8. If people spend the entire increase in income on consumption then MPC =, a) 0, 9., , b), , 1, , According to Keynes, MPC is, , c)5, , d) 8, , a) 0 > MPC> 1, , c)0 < MPC < 1, , b) 0 = MPC = 1, , d) 0 < MPC> 1, , 10. If MPC falls as income rises, then the, , will increase, , c) LPP, b) APC, a) APS, 11. The Psychological law of consumption was given by ., , a) Marshall, , b), , Keynes, , c)Adam Smith, , d) MPS, , d) Samuelson, , 12. Keynes Psychological Law assumes, , a) Laissez fire, , c) Normal economic conditions, , b) Constant psychological factor, , d) All of the above, , 13, When income equals consumption, savings will be, , (Nov. 2017), zero, c), b), negative, a) Positive, d) infinity, [Ans.: (1- a), (2- b), (3-c), (4-d), 5-d), (6-a), (7-c), (8 - b), (9-c), (10-d, , (11 b), (12- d), (13-c))
 Learn better on this topic