Page 1 :
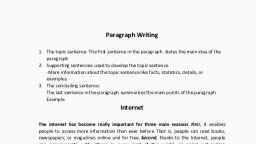
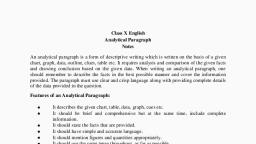
Paragraph Writing, 1. The topic sentence: The first sentence in the paragraph states the main idea of the, paragraph, 2. Supporting sentences: used to develop the topic sentence, -More information about the topic sentence like facts, statistics, details, or, examples., 3. The concluding sentence:, The last sentence in the paragraph summarizes the main points of the paragraph, Example, , Internet, The Internet has become really important for three main reasons. First, it enables, people to access more information than ever before. That is, people can read books,, newspapers, or magazines online and for free. Second, thanks to the Internet, people, can communicate with others in every part of the world via social networking, websites like Facebook,, WhatsApp, WeChat, Twitter,, Skype,, Viber,, Snapchat, LinkedIn, Reddit, etc. Third, the Internet is a perfect tool to study and get, certificates from well-known top universities. In other words, now more than ever,, anyone can do free online courses in a variety of subjects. In short, the Internet is,, beyond doubt, an essential and valuable tool nowadays., , Writing Analytical Paragraph, Analytical Paragraph: a problem, issue, situation etc. studied in detail, reasons or logic/ justifications facts to support something, 1. Writer makes a statement, 2. He or she proves that statement by giving facts, arguments etc. using the data given, in a line graph, a bar graph, a table, a pie chart etc., Writer tries to analyse an issue (look at an issue or problem /situation systematically,, carefully and in detail, Presents the pros and cons (arguments in favour or against something i.e a problem, Compares - similarity/dissimilarity/sameness/difference between two or more things, Contrasts – how one thing is opposed to another, Summarizes or concludes the paragraph with a one line statement
Page 2 :
Rule No. 1: Observe or Study the given graph / chart / table carefully, Format of Analytical paragraph writing, Para 1. Introduction, Explain in one or two lines the subject of the graph given., Starting lines (Phrases), The chart illustrates /shows, , , , , , According to the chart, The table states that, The pie chart shows that, The data reveals that, Para 2. Body, Explain in detail what the graph is about, use relevant figures, explain trends (direction in which something is moving),, make comparisons and contrasts (divide into sub paragraphs, if required), Comparing quantities, Similarly, In the opposite case, ‘Whereas’ : is used for contrast, In contrast with, However/still, In comparison to, Describing words, Greater than/less than, Highest /lowest, At the peak, 60% of, 3 by 4 of, Almost equal, Movement upward or downward, Rising/increasing/, Declining/diminishing/falling, Huge gap/minor difference, Slight increase/slight decrease, Steep fall, , Para 3. Conclusion, Conclude the paragraph giving the overall view or summary of the graph., Words used to give the overall view: to conclude, to summarize, in a nutshell/in short,, therefore, , -1-
Page 3 :
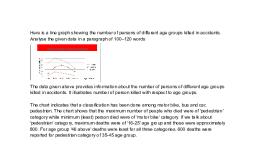
HERE IS A LINE GRAPH SHOWING THE NUMBER OF PERSONS OF DIFFERENT AGE GROUPS KILLED IN, ACCIDENTS. ANALYSE THE GIVEN DATA IN A PARAGRAPH OF 100-120 WORDS., , ANALYTICAL PARAGRAPH, Persons Killed in Road Accidents, The line graph illustrates the number of persons of different age groups killed in accidents., It is evident from the graph that the maximum number of people who are killed in road accidents, are pedestrians. Among pedestrians, too, people of 16-25 age group record the highest number of, accident deaths that is 800. Coincidentally, this age group faces the maximum motor-bikers deaths, in road accidents which is one-fourth of pedestrians’ deaths., Whereas, maximum number of people who die due to bus or car accidents belong to the 26-35 age, group. But, after the age of 35 people get less caught in road accidents., It can be concluded that 16-35 years of generation falls victim to road accidents more than the, people who have crossed 35 years. However, pedestrians are at the highest risk of accidents, followed by bus and car riders., , -2-
Page 4 :
2. The chart below displays data about the number of digital devices purchased in Rishunagar, across the years 2015-2019. Write a paragraph analyzing the given data., , Number of digital devices purchased in Rishunagar across the years 2015-2019., There has been a steady increase in the purchase of both smartphones and computers from 2015 to, 2017. But, in the year 2018, the number of computers purchased reduced to 45000 from, approximately 81000., Smartphone sellers, too, witnessed a 10% decrease in the annual sale in 2018. However, the next, year itself saw a boom (sharp rise) in the purchase of smartphones and computers., To conclude, after 2017, the residents of Rishunagar preferred smartphones over computers in their, purchase of digital devices., , Exercises for practise, 1. Write a paragraph on ‘The Importance of Reading’, , -3-
Page 5 :
Q2. The data of rainfall in the years 2012-2017 is presented in the bar graph given below. Interpret, the data in your own words., , -4-