Notes of CLASS 9, Economy Class-9-Economics.pdf - Study Material
Page 2 :
CONTENTS, FOREWORD, , ✐✐✐, , CHATPER 1, The Story of Village Palampur, , 1, , CHAPTER 2, People as Resource, , 16, , CHAPTER 3, Poverty as a Challenge, , 29, , CHAPTER 4, Food Security in India, , 42
Page 3 :
1, , Chapter, , The Story of Village Palampur, , Overview, The purpose of the story is to introduce, some basic concepts relating to production, and this we do through a story of a, hypothetical village called Palampur., Farming is the main activity in, Palampur, whereas several other, activities, such, as, small, scale, manufacturing, dairy, transport, etc. are, carried out on a limited scale. These, production activities need various types, of resources — natural resources, manmade items, human effort, money, etc. As, we read through the story of Palampur,, we will learn how various resources, combine to produce the desired goods and, services in the village., Palampur is well-connected with, neighbouring villages and towns. Raiganj,, a big village, is 3 kms from Palampur. An, all weather road connects the village to, Raiganj and further on to the nearest, small town of Shahpur. Many kinds of, transport are visible on this road starting, from bullock carts, t ✁✂✄☎, bogeys (wooden, cart drawn by buffalos) loaded with jaggery, (✂❣✆ ) and other commodities to motor, vehicles like motorcycles, jeeps, tractors, and trucks., This village has about 450 families, belonging to several different castes. The, 80 upper caste families own the majority, of land in the village. Their houses, some, of them quite large, are made of brick with, cement plastering. The SCs (dalits), comprise one third of the population and, live in one corner of the village and in, much smaller houses some of which are, of mud and straw. Most of the houses have, , Picture 1.1 ❙✝✞✟✞ ✠✡ ☛ ☞✌✍✍☛✎✞, , electric connections. Electricity powers, all the tubewells in the fields and is used, in various types of small business., Palampur has two primary schools and, one high school. There is a primary health, centre run by the government and one, private dispensary where the sick are, treated., • The description above shows that, Palampur has fairly well-developed, system of roads, transport, electricity,, irrigation, schools and health centre., Compare these facilities with those in, your nearby village., The story of Palampur, an imaginary, village, will take us through the different, types of production activities in the, village. In villages across India, farming, is the main production activity. The other, production activities, referred to as nonfarm, activities, include, small, manufacturing, transport, shop-keeping,, etc. We shall take a look at both these, types of activities, after learning a few, general things about production., , The Story of Village Palampur, , 1
Page 4 :
Organisation of Production, The aim of production is to produce the, goods and services that we want. There, are four requirements for production of, goods and services., The first requirement is land, and, other natural resources such as water,, forests, minerals., The second requirement is labour, i.e., people who will do the work. Some, production activities require highly, educated workers to perform the, necessary tasks. Other activities require, workers who can do manual work. Each, worker is providing the labour necessary, for production., The third requirement is physical, capital, i.e. the variety of inputs required, at every stage during production. What, are the items that come under physical, capital?, (a) ❚ ✁✂✄ ☎✆✝✞✟✠✡✂✄ ☛☞✟✁✌✟✠✍✂✎ Tools and, machines range from very simple tools, such as a farmer’s plough to, sophisticated machines such as, generators, turbines, computers, etc., Tools, machines, buildings can be used, in production over many years, and, are called fixed capital., (b) ❘✆✏ ☎✆✑✡✒✟✆✁✂ ✆✠✌ ☎ ✠✡✓ ✟✠ ✞✆✠✌✎, Production requires a variety of raw, materials such as the yarn used by, the weaver and the clay used by the, potter. Also, some money is always, required during production to make, payments and buy other necessary, items. Raw materials and money in, hand are called working capital., Unlike tools, machines and buildings,, these are used up in production., There is a fourth requirement too. You, will need knowledge and enterprise to be, able to put together land, labour and, physical capital and produce an output, either to use yourself or to sell in the, market. This these days is called human, 2, , Economics, , capital. We shall learn more about human, capital in the next chapter., • In the picture, identify the land, labour, and fixed capital used in production., , Picture 1.2, , ❆ ✔✕✖✗✘✙✚✛ ✜✢✗✣ ✤✥✦✥✙✕✧ ✧✕★✘✩✙✥✙✤, ✕❛✪ ✣✥✕✦✚ ✫✕✖✣✢❛✥✤, , Every production is organised by, combining land, labour, physical capital, and human capital, which are known as, factors of production. As we read through, the story of Palampur, we will learn more, about the first three factors of production., For convenience, we will refer to the, physical capital as the capital in this, chapter., , Farming in Palampur, 1. Land is fixed, Farming is the main production activity, in Palampur. 75 per cent of the people, who are working are dependent on, farming for their livelihood. They could, be farmers or farm labourers. The wellbeing of these people is closely related to, production on the farms., But remember that there is a basic, constraint in raising farm production., Land area under cultivation is practically, fixed. Since 1960 in Palampur, there has, been no expansion in land area under
Page 5 :
cultivation. By then, some of the, wastelands in the village had been, converted to cultivable land. There exists, no further scope to increase farm, production by bringing new land under, cultivation., , larger areas of land more effectively. The, first few tubewells were installed by the, gover nment. Soon, however, far mers, started setting up private tubewells. As a, result, by mid-1970s the entire cultivated, area of 200 hectares (ha.) was irrigated., , The standard unit of measuring land, is hectare, though in the villages you, may find land area being discussed, in local units such as ❜ ✁✂✄☎ ✁✆ ✝✞✂✄, etc. One hectare equals the area of a, square with one side measuring 100, metres. Can you compare the area of, a 1 hectare field with the area of your, school ground?, , Not all villages in India have such, high levels of irrigation. Apart from, the riverine plains, coastal regions in, our country are well-irrigated. In, contrast, plateau regions such as the, Deccan plateau have low levels of, irrigation. Of the total cultivated area, in the country a little less than 40, per cent is irrigated even today. In, the remaining areas, farming is, largely dependent on rainfall., , 2. Is there a way one can grow more, from the same land?, In the kind of crops grown and facilities, available, Palampur would resemble a, village of the western part of the state of, Uttar Pradesh. All land is cultivated in, Palampur. No land is left idle. During the, rainy season (kharif) farmers grow jowar, and bajra. These plants are used as cattle, feed. It is followed by cultivation of potato, between October and December. In the, winter season (rabi), fields are sown with, wheat. From the wheat produced, farmers, keep enough wheat for the family’s, consumption and sell the surplus wheat, at the market at Raiganj. A part of the, land area is also devoted to sugarcane, which is harvested once every year., Sugarcane, in its raw form, or as jaggery,, is sold to traders in Shahpur., The main reason why farmers are able, to grow three different crops in a year in, Palampur is due to the well-developed, system of irrigation. Electricity came early, to Palampur. Its major impact was to, transform the system of irrigation., Persian wheels were, till then, used by, farmers to draw water from the wells and, irrigate small fields. People saw that the, electric-run tubewells could irrigate much, , To grow more than one crop on a piece of, land during the year is known as multiple, cropping. It is the most common way of, increasing production on a given piece of, land. All farmers in Palampur grow, atleast two main crops; many are growing, potato as the third crop in the past fifteen, to twenty years., , Picture 1.3, , ❉✟✠✠✡☛✡☞✌ ✍☛✎✏✑, , Let’sDiscuss, •, , The following Table1.1 shows the land, under cultivation in India in units of, million hectares. Plot this on the graph, provided. What does the graph show?, Discuss in class., , The Story of Village Palampur, , 3
Page 6 :
Table 1.1: Cultivated area over the years, Cultivated Area, 1950, 1960, , 120, 130, , 1970, 1980, 1990, , 140, 140, 140, , 2000, , 140, , ✶✹✂, ✶✷✂, ✶✂✂, ✆✂, ✄✂, , were traditional ones with relatively low, yields. T raditional seeds needed less, irrigation. Farmers used cow-dung and, other natural manure as fertilizers. All, these were readily available with the, farmers who did not have to buy them., The Green Revolution in the late 1960s, introduced the Indian farmer to, cultivation of wheat and rice using high, yielding varieties (HYVs) of seeds., Compared to the traditional seeds, the, HYV seeds promised to produce much, greater amounts of grain on a single plant., As a result, the same piece of land would, now produce far larger quantities of, foodgrains than was possible earlier. HYV, seeds, however, needed plenty of water, and also chemical fertilizers and, , ✹✂, ✷✂, ✂, •, , ✶ ✁✂ ✶ ✄✂ ✶ ☎✂ ✶ ✆✂ ✶, , ✂ ✷✂✂✂, , Is it important to increase the area, under irrigation? Why?, You have read about the crops grown, in Palampur. Fill the following table, based on information on the crops, grown in your region., , •, , You have seen that one way of, increasing production from the same, land is by multiple cropping. The other, way is to use modern farming methods, for higher yield. Yield is measured as, crop produced on a given piece of land, during a single season. T ill the mid1960s, the seeds used in cultivation, Name of crop, , 4, , Month sown, , Economics, , Picture 1.4 ✥✝✞✟✠✡ ☛☞✠✌✍✡✎ ✥✟✏✑✝✞✒✓ ✔✕✖, , Month Harvested, , ✒✟✟✞✒✗ ✘✑✟✌✍✘☞✙ ✚✟✠✏✍✙✍✛✟✠ ✟✏✘✜, , Source of irrigation (Rain,, tanks, tubewells, canals, etc.)
Page 7 :
pesticides to produce best results. Higher, yields were possible only from a, combination of HYV seeds, irrigation,, chemical fertilisers, pesticides etc., Farmers of Punjab, Haryana and, Western Uttar Pradesh were the first to, try out the modern farming method in, India. The farmers in these regions set, up tubewells for irrigation, and made use, of HYV seeds, chemical fertilizers and, pesticides in farming. Some of them, bought farm machinery like tractors and, threshers, which made ploughing and, harvesting faster. They were rewarded, with high yields of wheat., In Palampur, the yield of wheat grown, from the traditional varieties was 1300 kg, per hectare. With the HYV seeds, the yield, went up to 3200 kg per hectare. There, was a large increase in the production of, wheat. Farmers now had greater amounts, of surplus wheat to sell in the markets., , Let’sDiscuss, •, •, , •, , What is the difference between, multiple cropping and modern farming, method?, The following table shows the, production of wheat and pulses in, India after the Green revolution in, units of million tonnes. Plot this on a, graph. Was the Green r evolution, equally successful for both the crops?, Discuss., What is the working capital required, by the farmer using modern farming, methods?, , •, , Modern farming methods require the, farmer to start with more cash than, before. Why?, , Suggested Activity, •, , During your field visit talk to some, farmers of your region. Find out:, , 1. What kind of farming methods—, modern or traditional or mixed— do, the farmers use? Write a note., 2. What are the sources of irrigation?, 3. How much of the cultivated land is, irrigated? (very little/nearly half/, majority/all), 4. From where do farmers obtain the, inputs that they require?, , 3. Will the land sustain?, Land being a natural resource, it is, necessary to be very careful in its use., Scientific reports indicate that the modern, farming methods have overused the, natural resource base., In many areas, Green Revolution is, associated with the loss of soil fertility, due to increased use of chemical, fertilizers. Also, continuous use of, groundwater for tubewell irrigation has, reduced the water -table below the, ground. Environmental resources like soil, fertility and groundwater are built up over, many years. Once destroyed it is very, difficult to restore them. We must take, care of the environment to ensure future, development of agriculture., , Suggested Activity, Table 1.2: Production of pulses and wheat, Production, of Pulses, , Production, of Wheat, , 1965 - 66, , 10, , 10, , 1970 - 71, , 12, , 24, , 1980 - 81, , 11, , 36, , 1990 - 91, , 14, , 55, , 2000 - 01, , 11, , 70, , •, , After reading the following reports from, newspapers/magazines, write a letter, to the Agriculture Minister in your own, words telling him how the use of, chemical fertilizers can be harmful., ....Chemical fertilizers provide, minerals which dissolve in water and, are immediately available to plants., But these may not be retained in the, , The Story of Village Palampur, , 5
Page 8 :
Picture 1.5, , ✥ ✁ ✂✄☎✆ ✝✞✁✁ ✟✠✡ ☛✞☞✌✆✞✍☎✌✞✎✏ ✎✑ ✒☎✁✌✞✝ ✌✠✓ ✁ ✏✓, , soil for long. They may escape from, the soil and pollute groundwater,, rivers and lakes. Chemical fertilizers, can also kill bacteria and other microorganisms in the soil. This means, some time after their use, the soil will, be, less, fertile, than, ever, before....✭✔✕✖✗✘✙✚ Down to Earth, New, Delhi), .....The consumption of chemical, fertilizers in Punjab is highest in the, country. The continuous use of chemical, fertilizers has led to degradation of soil, health. Punjab farmers are now forced, to use more and more chemical, fertilizers and other inputs to achieve, the same production level. This means, cost of cultivation is rising very, The, Tribune,, fast.....✭✔✕✖✗✘✙✚, Chandigarh), , 4. How is land distributed between, the farmers of Palampur?, You must have realised how important, land is for farming. Unfortunately, not all, the people engaged in agriculture have, sufficient land for cultivation. In, Palampur, about one third of the 450, families are landless, i.e. 150 families,, most of them dalits, have no land for, cultivation., 6, , Economics, , Of the remaining families who own, land, 240 families cultivate small plots of, land less than 2 hectares in size., Cultivation of such plots doesn’t bring, adequate income to the farmer family., In 1960, Gobind was a farmer with, 2.25 hectares of largely unirrigated land., With the help of his three sons Gobind, cultivated the land. Though they didn’t, live very comfortably, the family managed, to feed itself with a little bit of extra, income from one buffalo that the family, possessed. Some years after Gobind’s, death, this land was divided among his, three sons. Each one now has a plot of, land that is only 0.75 hectare in size. Even, with improved irrigation and modern, farming method, Gobind’s sons are not, able to make a living from their land. They, have to look for additional work during, part of the year., You can see the large number of small, plots scattered around the village in the, picture. These are cultivated by the small, farmers. On the other hand, more than, half the area of the village is covered by, plots that are quite large in size. In, Palampur, there are 60 families of medium, and large farmers who cultivate more, than 2 hectares of land. A few of the large, farmers have land extending over 10, hectares or more.
Page 9 :
❲✴✱♦ ✴✵, ✰t✾ ✶✮✾❁✿✯❄ ❲t✾✺✰ ❅✱✴❆❇, ❆❁✴✳♣t✮✵♣ ✲❉ ✲✳❁❁✴❅♦✯❊, ✯✴s✮✵♣❊ ✯❆✱✺❉✮✵♣ ✴✶, ✮✵✯✾❅✰✮❅✮✿✾✯❊ ❅✳❁✰✮❂✺✰✮✴✵, ✲❉ ✰✱✺✿✮✰✮✴✵✺❁ ✼✾✰t✴✿❊, ❅✳❁✰✮❂✺✰✮✴✵ ✲❉ ✼✴✿✾✱✵, ✼✾✰t✴✿❊ ✺✵✿ ❅✳✰✰✮✵♣ ✴✶, ❅✱✴❆✯❝, Picture 1.6, , Let’sDiscuss, •, •, •, , Let’sDiscuss, , In the Picture 1.5, can you shade the, land cultivated by the small farmers?, Why do so many families of farmers, cultivate such small plots of land?, The distribution of farmers in India and, the amount of land they cultivate is given, in the following Graph 1.1. Discuss in, the classroom., Graph 1.1:, , ✬✮✯✰✱✮✲✳✰✮✴✵ ✴✶ ✹✺✱✼✾✱✯ ✺✵✿, ❀✳❁✰✮❂✺✰✾✿ ❃✱✾✺, , ❈✠✡☛☞✌✍☛✎✏ ✑✒✎✍, ✸✻✘, , ◆ ✁✂✄☎ ✆✝ ✞✟☎✁✄☎♠, ✷✗✘, , •, , Would you agree that the distribution, of cultivated land is unequal in, Palampur? Do you find a similar, situation for India? Explain., , 5. Who will provide the labour?, After land, labour is the next necessary, factor for production. Farming requires a, great deal of hard work. Small farmers, along with their families cultivate their, own fields. Thus, they provide the labour, required for farming themselves. Medium, and large farmers hire farm labourers to, work on their fields., , Let’sDiscuss, ✻✙✘, ❙✓✍✡✡ ✔✍✒✓✎✒✕, ✭✚✛✜✜ ✢✣✤✥ ✦ ✣✤✧★, , ✽✗✘, ▼✎✏☞✠✓ ✍✖✏, ▲✍✒❣✎ ✔✍✒✓✎✒✕, ✭✩✪✫✛ ✢✣✤✥ ✦ ✣✤✧★, , ❋●❍■❏❑❄ Agricultural statistics at glance 2003:, Dept of agriculture and cooperation,, Ministry of agriculture, Govt of India., , •, , Identify the work being done on the, field in the Pictures 1.6 and arrange, them in a proper sequence., , Farm labourers come either from, landless families or families cultivating, small plots of land. Unlike farmers, farm, labourers do not have a right over the, The Story of Village Palampur, , 7
Page 10 :
Picture 1.7 ❚, , ✁ ✂✄☎✆✁✝✞✟✠✡✄☎ ☛✁✠☞✁✁☎ ✌✟✍✟ ✟☎✎ ✏✟✑✒✟✍✡, , crops grown on the land. Instead they are, paid wages by the farmer for whom they, work. Wages can be in cash or in kind, e.g. crop. Sometimes labourers get meals, also. Wages vary widely from region to, region, from crop to crop, from one farm, activity to another (like sowing and, harvesting). There is also a wide variation, in the duration of employment. A farm, 8, , Economics, , labourer might be employed on a daily, basis, or for one particular farm activity, like harvesting, or for the whole year., Dala is a landless farm labourer who, works on daily wages in Palampur. This, means he must regularly look for work., The minimum wages for a farm labourer, set by the government is Rs 60 per day,, but Dala gets only Rs 35–40. There is
Page 11 :
heavy competition for work among the, farm labourers in Palampur, so people, agree to work for lower wages. Dala, complains about his situation to Ramkali,, who is another farm labourer., Both Dala and Ramkali are among the, poorest people in the village., , Let’sDiscuss, •, •, , Why are farm labourers like Dala and, Ramkali poor?, Gosaipur and Majauli are two villages, in North Bihar. Out of a total of 850, households in the two villages, there, are more than 250 men who are, employed in rural Punjab and Haryana, or in Delhi, Mumbai, Surat, Hyderabad, or Nagpur. Such migration is common, in most villages across India. Why do, people migrate? Can you describe, (based on your imagination) the work, that the migrants of Gosaipur and, Majauli might do at the place of, destination?, , 6. The capital needed in farming, You have already seen that the modern, farming methods require a great deal of, capital, so that the farmer now needs, more money than before., 1. Most small farmers have to borrow, money to arrange for the capital. They, borrow from large farmers or the, village moneylenders or the traders, who supply various inputs for, cultivation. The rate of interest on, such loans is very high. They are put, to great distress to repay the loan., Savita is a small farmer. She plans to, cultivate wheat on her 1 hectare of land., Besides seeds, fertilizers and pesticides,, she needs cash to buy water and repair, her farm instruments. She estimates that, the working capital itself would cost a, minimum of Rs 3,000. She doesn’t have, the money, so she decides to borrow from, Tejpal Singh, a large farmer. Tejpal Singh, , agrees to give Savita the loan at an, interest rate of 24 per cent for four, months, which is a very high interest rate., Savita also has to promise to work on his, field as a farm labourer during the harvest, season at Rs 35 per day. As you can tell,, this wage is quite low. Savita knows that, she will have to work very hard to, complete harvesting on her own field, and, then work as a farm labourer for Tejpal, Singh. The harvest time is a very busy, time. As a mother of three children she, has a lot of household responsibilities., Savita agrees to these tough conditions, as she knows getting a loan is difficult, for a small farmer, 2. In contrast to the small farmers, the, medium and large farmers have their, own savings from farming. They are, thus able to arrange for the capital, needed. How do these farmers have, their own savings? You shall find the, answer in the next section., , Thestorysofar...., We have read about the three factors of, production—land, labour and capital—, and how they are used in farming. Let us, fill in the blanks given below., Among the three factors of production,, we found that labour is the most, abundant factor of production. There are, many people who are willing to work as, farm labourers in the villages, whereas, the opportunities of work are limited. They, belong to either landless families or, . They are paid low wages,, and lead a difficult life., In contrast to labour,, is a scarce factor of production. Cultivated, . Moreover,, land area is, even the existing land is distributed, ✭ ✁✂✄☎☎✆✝✂✞ ✁✂✄☎☎✆✟ among, the people engaged in farming. There are, a large number of small farmers who, cultivate small plots of land and live in, The Story of Village Palampur, , 9
Page 12 :
conditions not much better than the, landless far m labourer. To make the, maximum use of the existing land,, and, farmers, use, . Both these have led to, increase in production of crops., Modern farming methods require a, . Small, great deal of, farmers usually need to borrow money to, arrange for the capital, and are put to, great distress to repay the loan. Therefore,, capital too is a scarce factor of production,, particularly for the small farmers., Though both land and capital are, scarce, there is a basic difference between, the two factors of production., is a natural resource,, is man-made. It, whereas, is possible to increase capital, whereas, land is fixed. Therefore, it is very, important that we take good care of land, and other natural resources used in, farming., , 7. Sale of Surplus Farm Products, Let us suppose that the farmers have, produced wheat on their lands using the, three factors of production. The wheat, is harvested and production is complete., What do the farmers do with the wheat?, They retain a part of the wheat for the, family’s consumption and sell the, surplus wheat. Small farmers like, Savita and Gobind’s sons have little, surplus wheat because their total, production is small and from this a, substantial share is kept for their own, family needs. So it is the medium and, large farmers who supply wheat to the, market. In the Picture 1.1, you can see the, bullock cart streaming into the market, each carrying loads of wheat. The traders, at the market buy the wheat and sell it, further to shopkeepers in the towns and, cities., 10, , Economics, , Tejpal Singh, the large farmer, has a, surplus of 350 quintals of wheat from all, his lands! He sells the surplus wheat at, the Raiganj market and has good earnings., What does Tejpal Singh do with his, earnings? Last year, Tejpal Singh had put, most of the money in his bank account., Later he used the savings for lending to, farmers like Savita who were in need of a, loan. He also used the savings to arrange, for the working capital for farming in the, next season. This year Tejpal Singh plans, to use his earnings to buy another tractor., Another tractor would increase his fixed, capital., Like Tejpal Singh, other large and, medium farmers sell the surplus farm, products. A part of the earnings is saved, and kept for buying capital for the next, season. Thus, they are able to arrange, for the capital for farming from their own, savings. Some farmers might also use the, savings to buy cattle, trucks, or to set up, shops. As we shall see, these constitute, the capital for non-farm activities., , Non-Farm Activities in Palampur, We have learnt about farming as the main, production activity in Palampur. We shall, now take a look at some of the non-farm, production activities. Only 25 per cent, of the people working in Palampur are, engaged in activities other than, agriculture., , 1. Dairy — the other common, activity, Dairy is a common activity in many families, of Palampur. People feed their buffalos on, various kinds of grass and the ❥ ✁✂✄ and, ❜✂❥✄✂ that grows during the rainy season., The milk is sold in Raiganj, the nearby large, village. Two traders from Shahpur town, have set up collection cum chilling centres, at Raiganj from where the milk is, transported to far away towns and cities.
Page 13 :
Optional Exercise, •, , Let us take three farmers. Each has grown wheat on his field though the, production is different (see Column 2). The consumption of wheat by each, farmer family is the same (Column 3). The whole of surplus wheat this year, is used as capital for next year’s production. Also suppose, production is, twice the capital used in production. Complete the tables., , Farmer 1, Production, , Consumption, , Surplus =, Production –, Consumption, , Capital for the, next year, , Year 1, , 100, , 40, , 60, , 60, , Year 2, , 120, , 40, , Surplus, , Capital for the, next year, , Surplus, , Capital for the, next year, , Year 3, , 40, , Farmer 2, , Year 1, , Production, , Consumption, , 80, , 40, , Year 2, , 40, , Year 3, , 40, , Farmer 3, , Year 1, , Production, , Consumption, , 60, , 40, , Year 2, , 40, , Year 3, , 40, , Let’sDiscuss, •, •, , Compare the production of wheat by the three farmers over the years., What happens to Farmer 3 in Year 3? Can he continue production? What, will he have to do to continue production?, , 2. An example of small-scale, manufacturing in Palampur, At present, less than fifty people are, engaged in manufacturing in Palampur., , Unlike the manufacturing that takes, place in the big factories in the towns, and cities, manufacturing in Palampur, involves very simple production methods, The Story of Village Palampur, , 11
Page 14 :
and are done on a small scale. They are, carried out mostly at home or in the fields, with the help of family labour. Rarely are, labourers hired., , Kareem has opened a computer class, centre in the village. In recent years, a large number of students have been, attending college in Shahpur town., Kareem found that a number of, students from the village are also, attending computer classes in the, town. There were two women in the, village who had a degree in computer, applications. He decided to employ, them. He bought computers and set, up the classes in the front room of, their house overlooking the market., High school students have started, attending them in good numbers., , Mishrilal, has, purchased, a, mechanical sugarcane crushing, machine run on electricity and has, set it up on his field. Sugarcane, crushing was earlier done with the, help of bullocks, but people prefer to, do it by machines these days., Mishrilal also buys sugarcane from, other farmers and processes it into, jaggery. The jaggery is then sold to, traders at Shahpur. In the process,, Mishrilal makes a small profit., , Let’sDiscuss, , •, •, •, •, •, , Let’sDiscuss, , •, , What capital did Mishrilal need to set, up his jaggery manufacturing unit?, Who provides the labour in this case?, Can you guess why Mishrilal is unable, to increase his profit?, Could you think of any reasons when, he might face a loss?, Why does Mishrilal sell his jaggery to, traders in Shahpur and not in his, village?, , •, , 3. The shopkeepers of Palampur, People involved in trade (exchange of, goods) are not many in Palampur. The, traders of Palampur are shopkeepers who, buy various goods from wholesale, markets in the cities and sell them in, the village. You will see small general, stores in the village selling a wide range, of items like rice, wheat, sugar, tea, oil,, biscuits, soap, toothpaste, batteries,, candles, notebooks, pen, pencil, even, some cloth. A few of the families whose, houses are close to the bus stand have, used a part of the space to open small, shops. They sell eatables., 12, , Economics, , In what ways is Kareem’s capital and, labour different from Mishrilal’s?, Why didn’t someone start a computer, centre earlier? Discuss the possible, reasons., , 4. Transport: a fast developing, sector, There are variety of vehicles on the road, connecting Palampur to Raiganj., ❘ ✁ ✂ ✄ ☎ ✆ ✝ ✆ ✞ ✞ ✆ ☎ ✄ , t ✟ ✠ ✡ ✆ ✝ ✆ ✞ ✞ ✆ ☎ ✄ ☛ jeep,, tractor, truck drivers and people driving, the traditional bullock cart and bogey are, people in the transport services. They, ferry people and goods from one place to, another, and in return get paid for it. The, number of people involved in transport, has grown over the last several years., Kishora is a farm labourer. Like other, such labourers, Kishora found it, difficult to meet his family’s needs from, the wages that he received. A few years, back Kishora took a loan from the, bank. This was under a government, programme which was giving cheap, loans to poor landless households., Kishora bought a buffalo with this, money. He now sells the buffalo’s milk.
Page 15 :
Further, he has attached a wooden cart, to his buffalo and uses it to transport, various items. Once a week, he goes to, the river Ganga to bring back clay for, the potter. Or sometimes he goes to, Shahpur with a load of jaggery or other, commodities. Every month he gets some, work in transport. As a result, Kishora, is able to earn more than what he used, to do some years back., , Let’sDiscuss, •, •, •, •, , What is Kishora’s fixed capital?, What do you think would be his, working capital?, In how many production activities is, Kishora involved?, Would you say that Kishora has, benefitted from better roads in, Palampur?, , Summary, Farming is the main production activity in the village. Over the years there have, been many important changes in the way farming is practiced. These have allowed, the farmers to produce more crops from the same amount of land. This is an, important achievement, since land is fixed and scarce. But in raising production, a great deal of pressure has been put on land and other natural resources., The new ways of farming need less land, but much more of capital. The medium, and large farmers are able to use their own savings from production to arrange, for capital during the next season. On the other hand, the small farmers who, constitute about 80 per cent of total farmers in India, find it difficult to obtain, capital. Because of the small size of their plots, their production is not enough., The lack of surplus means that they are unable to obtain capital from their own, savings, and have to borrow. Besides the debt, many of the small farmers have, to do additional work as farm labourers to feed themselves and their families., Labour being the most abundant factor of production, it would be ideal if, new ways of farming used much more labour. Unfortunately, such a thing has, not happened. The use of labour on farms is limited. The labour, looking for, opportunities is thus migrating to neighbouring villages, towns and cities. Some, labour has entered the non-farm sector in the village., At present, the non-farm sector in the village is not very large. Out of every, 100 workers in the rural areas in India, only 24 are engaged in non-farm activities., Though there is a variety of non-farm activities in the villages (we have only, seen a few examples), the number of people employed in each is quite small., In the future, one would like to see more non-farm production activities in the, village. Unlike farming, non-farm activities require little land. People with some, amount of capital can set up non-farm activities. How does one obtain this capital?, One can either use his own savings, but more often has to take a loan. It is, important that loan be available at low rate of interest so that even people without, savings can start some non-farm activity. Another thing which is essential for, expansion of non-farm activities is to have markets where the goods and services, produced can be sold. In Palampur, we saw the neighbouring villages, towns and, cities provide the markets for milk, jaggery, wheat, etc. As more villages get, connected to towns and cities through good roads, transport and telephone, it is, possible that the opportunities for non-farm activities production in the village, would increase in the coming years., The Story of Village Palampur, , 13
Page 16 :
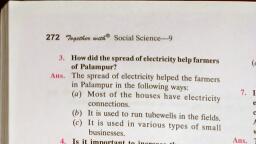
Exercises, 1. Every village in India is surveyed once is ten years during the Census and, some of details are presented in the following format. Fill up the following based, on information on Palampur., a. LOCATION:, b. TOTAL AREA OF THE VILLAGE:, c. LAND USE (in hectares):, Cultivated Land, Irrigated, , Unirrigated, , Land not available for cultivation, (Area covering dwellings, roads,, ponds, grazing ground), 26 hectares, , d. FACILITIES:, Educational, Medical, Market, Electricity Supply, Communication, Nearest Town, 2. Modern farming methods require more inputs which are manufactured in, industry. Do you agree?, 3. How did the spread of electricity help farmers in Palampur?, 4. Is it important to increase the area under irrigation? Why?, 5. Construct a table on the distribution of land among the 450 families of, Palampur., 6. Why are the wages for farm labourers in Palampur less than minimum wages?, 7. In your region, talk to two labourers. Choose either farm labourers or labourers, working at construction sites. What wages do they get? Are they paid in cash, or kind? Do they get work regularly? Are they in debt?, 8. What are the different ways of increasing production on the same piece of, land? Use examples to explain., 9. Describe the work of a farmer with 1 hectare of land., 10. How do the medium and large farmers obtain capital for farming? How is it, different from the small farmers?, 11. On what terms did Savita get a loan from Tajpal Singh? Would Savita’s condition, be different if she could get a loan from the bank at a low rate of interest?, 12. Talk to some old residents in your region and write a short report on the changes, in irrigation and changes in production methods during the last 30 years., (Optional), 14, , Economics
Page 17 :
13. What are the non-farm production activities taking place in your region? Make, a short list., 14. What can be done so that more non-farm production activities can be started, in villages?, , References, ETIENNE, GILBERT. 1985. ❘ ✁✂✄ ☎✆✝✆✄✞✟✠✆✡☛ ☞✡ ✌✍☞✂: Meetings with Peasants, Sage, Publications, New Delhi., ETIENNE, GILBERT. 1988. ❋✞✞✎ ✂✡✎ ✏✞✝✆✁☛✑✒ ✓✡✎☞✂✔✍ ✕✂✄✖ ✗✞✡ ✘✂☛☛✄✆, Sage Publications,, New Delhi., RAJ, K.N. 1991. ‘❱☞✄✄✂✙✆ ✓✡✎☞✂ ✂✡✎ ☞☛✍ ✏✞✄☞☛☞✚✂✄ ✛✚✞✡✞✠✑’ in C.T. Kurien (Edited) Economy,, Society and Development, Sage Publications., THORNER, DANIEL AND ALICE THORNER. 1962. ▲✂✡✎ ✂✡✎ ▲✂✘✞ ✁ ☞✡ ✓✡✎☞✂, Asia Publishing, House, Bombay., , The Story of Village Palampur, , 15
Page 18 :
2, , People as Resource, , Chapter, , Overview, The chapter 'People as Resource' is an, effort to explain population as an asset, for the economy rather than a liability., Population becomes human capital when, there is investment made in the form of, education, training and medical care., In fact, human capital is the stock of, skill and productive knowledge embodied, in them., 'People as Resource' is a way of, referring to a country’s working people, in terms of their existing productive, skills and abilities. Looking at the, population from this productive aspect, emphasises its ability to contribute to, the creation of the Gross National, Product. Like other resources population, also is a resource — a 'human resource'., This is the positive side of a large, population that is often overlooked when, we look only at the negative side,, considering only the problems of, providing the population with food,, education and access to health facilities., When the existing 'human resource' is, further developed by becoming more, educated and healthy, we call it 'human, capital formation ' that adds to the, productive power of the country just like, 'physical capital formation'., Investment in human capital, (through education, training, medical, care) yields a return just like investment, in physical capital. This can be seen, directly in the form of higher incomes, earned because of higher productivity, of the more educated or the better trained, persons, as well as the higher, productivity of healthier people., 16, , Economics, , India’s Green Revolution is a, dramatic example of how the input, of greater knowledge in the form of, improved production technologies can, rapidly increase the productivity of, scarce land resources. India’s IT, revolution is a striking instance of, how the importance of human capital, has come to acquire a higher position, than that of material plant and, machinery., , ❙ ✁✂✄☎: Planning Commission, Govt. of India.
Page 19 :
population need not be a liability. It can, be turned into a productive asset by, investment in human capital (for example,, by spending resources on education and, health for all, training of industrial and, agricultural workers in the use of modern, technology, useful scientific researches, and so on)., The two following cases illustrate how, people can try to become a more productive, resource:, Story of Sakal, , Picture 2.1, , Let’sDiscuss, •, , Looking at the photograph can you, explain how a doctor, teacher, engineer, and a tailor are an asset to the, economy?, , Not only do the more educated and the, healthier people gain through higher, incomes, society gains also in other indirect, ways because the advantages of a more, educated or a healthier population spreads, to those also who themselves were not, directly educated or given health care. In, fact, human capital is in one way superior, to other resources like land and physical, capital: human resource can make use of, land and capital. Land and capital cannot, become useful on its own!, For many decades in India, a large, population has been considered a liability, rather than an asset. But a large, , There were two friends Vilas and, Sakal living in the same village, Semapur. Sakal was a twelve-yearold boy. His mother Sheela looked, after domestic chores. His father Buta, Chaudhary worked in an agricultural, field. Sakal helped his mother in, domestic chores. He also looked after, his younger brother Jeetu and sister, Seetu. His uncle Shyam had passed, the matriculation examination, but,, was sitting idle in the house as he, had no job. Buta and Sheela were, eager to teach Sakal. They forced him, to join the village school which he, soon joined. He started studying and, completed his higher secondary, examination. His father persuaded, him to continue his studies. He raised, a loan for Sakal to study a vocational, course in computers. Sakal was, meritorious and interested in studies, from the beginning. With great vigour, and enthusiasm he completed his, course. After some time he got a job, in a private firm. He even designed a, new kind of software. This software, helped him increase the sale of the, firm. His boss acknowledged his, services and rewarded him with a, promotion., People as Resource, , 17
Page 20 :
Picture 2.2, , ✥☎✆✝✞✟✠ ✆✡ ☛✞☞✌✠ ✌✍✎ ✥✌✏✌☞, , Story of Vilas, Vilas was an eleven-year old boy, residing in the same village as Sakal., Vilas’s father Mahesh was a, fisherman. His father passed away, when he was only two years old. His, mother Geeta sold fish to earn money, to feed the family. She bought fish, from the landowner’s pond and sold, it in the nearby ♠ ✁✂✄ . She could, earn only Rs 20 to 30 a day by selling, fish. Vilas became a patient of, arthritis. His mother could not afford, to take him to the doctor. He could, not go to school either. He was not, interested in studies. He helped his, mother in cooking and also looked, after his younger brother Mohan., After some time his mother fell sick, and there was no one to look after, her. There was no one in the family, to support them. Vilas, too, was forced, to sell fish in the same village. He, like his mother earned only a meagre, income., , 18, , Economics, , Let’sDiscuss, •, , Do you notice any difference between, the two friends? What are those?, Activity, Visit a nearby village or a slum area, and write down a case study of a boy, or girl of your age facing the same, condition as Vilas or Sakal., , In the two case studies we saw Sakal, went to school and Vilas did not go. Sakal, was physically strong and healthy. He did, not need to visit the doctor frequently., Vilas was a patient of arthritis. He lacked, the means to visit the doctor. Sakal, acquired a degree in computers. Sakal, found a job in the private firm while Vilas, continued with the same work as his, mother. He earned a meagre income like, his mother to support a family., In the case of Sakal, several years of, education added to the quality of labour., This enhanced his total productivity., Total productivity adds to the growth of, the economy. This in turn pays an
Page 21 :
individual through salary or in some other, form of his choice. In case of Vilas, there, could not be any education or health care, in the early part of his life. He spends his, life selling fish like his mother., Henceforth, he draws the same salary of, unskilled labour as his mother., Investment in human resource (via, education and medical care) can give high, rates of return in the future. This, investment on people is the same as, investment in land and capital. One, invests in shares and bonds expecting, higher return in the future., A child, too, with investments made, on her education and health, can yield a, high return in the future in the form of, higher earnings and greater contribution, to society. Educated parents are found to, invest more heavily on the education of, their child. This is because they have, realised the importance of education for, themselves. They are also conscious of, proper nutrition and hygiene. They, accordingly look after their children’s, needs for education at school and good, health. A virtuous cycle is thus created, in this case. In contrast, a vicious cycle, may be created by disadvantaged parents, who, themselves uneducated and lacking, in hygiene, keep their children in a, similarly disadvantaged state., Countries like Japan have invested in, human resource. They did not have any, natural resource. These countries are, developed/rich countries. They import the, natural resource needed in their country., How did they become rich/developed?, They have invested on people especially, in the field of education and health. These, people have made efficient use of other, resource like land and capital. Efficiency, and the technology evolved by people have, made these countries rich/developed., , Economic Activities by Men and Women, Like Vilas and Sakal people have been, engaged in various activities. We saw Vilas, sold fish and Sakal got a job in the firm., The various activities have been classified, into three main sectors i.e., primary,, secondary and tertiary. Primary sector, includes agriculture, forestry, animal, husbandry, fishing, poultry farming, and, mining. Quarrying and manufacturing is, included in the secondary sector. Trade,, transport, communication, banking,, education, health, tourism, services,, insurance etc. are included in the tertiary, sector. The activities in this sector result, in the production of goods and services., These activities add value to the national, income. These activities are called, economic activities. Economic activities, have two parts — market activities and, non-market activities. Market activities, involve remuneration to any one who, performs i.e., activity performed for pay, or profit. These include production of goods, or services including government service., Non-market activities are the production, for self-consumption. These can be, , Picture 2.3 ❇, , ✁✂✄ ☎✆ ✝✞✂ ✟✠✡✝☛☞✂ ✡ ✆ ✌☎☛ ✡✍ ✁✁✠✎✌, ✝✞✂✁✂ ✡✝✠✥✠✝✠✂✁ ✠✆✝☎ ✝✞☞✂✂ ✁✂✡✝☎☞✁✏, People as Resource, , 19
Page 22 :
consumption and processing of primary, product and own account production of, fixed assets., Activity, Visit a village or colony located near, to your residential area and note, down, the, various, activities, undertaken by the people of that, village or colony., If this is not possible, ask your, neighbour what is their profession?, In which of the three sectors will you, categorise their work?, Say whether these activities are, economic or non-economic activities:, Vilas sells fish in the village market., Vilas cooks food for his family., Sakal works in the private firm., Sakal looks after his younger brother, and sister., Due to historical and cultural reasons, there is a division of labour between men, and women in the family. Women, generally look after domestic chores and, men work in the fields. Sakal’s mother, Sheela cooks food, cleans utensils, washes, clothes, cleans the house and looks after, her children. Sakal’s father Buta, cultivates the field, sells the produce in, the market and earns money for the family., Sheela is not paid for the services, delivered for upbringing of the family., Buta earns money, which he spends on, rearing his family. Women are not paid, for their service delivered in the family., Their work is not accounted in the, national income which is a sum total of, goods and services produced in a country., Geeta, mother of Vilas, earned an, income by selling fish. Thus women are, paid for their work when they enter the, labour market. Their earning like that of, their male counterpart is determined on, the basis of education and skill. Education, 20, , Economics, , helps individual to make better use of the, economic opportunities available before, him. Education and skill are the major, determinants of the earning of any, individual in the market. A majority of, the women have meagre education and, low skill formation. Women are paid low, compared to men. Most women work, where job security is not there. Various, activities relating to legal protection is, meagre. Employment in this sector is, characterised by irregular and low income., In this sector there is an absence of basic, facilities like maternity leave, childcare, and other social security systems., However, women with high education and, skill formation are paid at par with the, men. Among the organised sector,, teaching and medicine attract them the, most. Some women have entered the, administrative and other services, including those, which need high levels, of scientific and technological service. Ask, your sister or your classmate what she, would like to take up as a career?, , Quality of Population, The quality of population depends upon, the literacy rate, health of a person, indicated by life expectancy and skill, formation acquired by the people of the, country. The quality of the poulation, ultimately decides the growth rate of the, country. Illiterate and unhealthy, population are a liability for the economy., Literate and healthy population are an, asset., , Education, Sakal’s education in the initial years of, his life bore him the fruits in the later, years in terms of a good job and salary., We saw education was an important, input for the growth of Sakal. It opened, new horizon for him, provided new, aspiration and developed values of life., Not only for Sakal, education contributes
Page 23 :
Picture 2.4 ✞✟✠✡✡☛ ✟✠☞☛✌✍✎✏, , towards the growth of society also. It, enhances the national income, cultural, richness and increases the efficiency of, governance. There is a provision made, , ...human being is a positive asset and, a precious national resource which, needs to be cherished, nurtured and, developed with tenderness and care,, coupled with dynamism. Each, individual’s growth presents a, different range of problems and, requirements. ... The catalytic action, of education in this complex and, dynamic growth process needs to be, planned meticulously and executed, with great sensitivity., , ❙ ✁✂✄☎: National Education Policy, 1986., , Graph 2.1: Literacy rates in India, person, , ✝✵, , male, , ✼✵, , woman, , ✻✵, ✺✵, ✹✵, ✸✵, ✷✵, ✶✵, ✵, , ✶✆✺✶, , ✶✆✻✶, , ✶✆✼✶, , ✶✆✝✶, , ✶✆✆✶, , ✷✵✵✶, , ❙ ✁✂✄☎: Census of India 2001, Series I India, Paper 1 of 2001., for providing universal access, retention, and quality in elementary education with, a special emphasis on girls. There is also, an establishment of pace setting of, schools like Navodaya Vidyalaya in each, district. Vocational streams have been, developed to equip large number of high, school students with occupations related, to knowledge and skills. The plan outlay, on education has increased from Rs 151, crore in the first plan to Rs 43,825 crore, in the tenth plan. The expenditure on, education as a percentage of GDP rose, from 0.64% in 1951–52 to 3.98% in 2002–, , Let’sDiscuss, Study the graph and answer the following, questions:, 1. Has the literacy rates of the population, increased since 1951?, 2. In which year India has the highest, literacy rates?, 3. Why literacy rate is high among the, males of India?, 4. Why are women less educated than men?, 5. How would you calculate literacy rate, in India?, 6. What is your projection about India’s, literacy rate in 2010?, People as Resource, , 21
Page 24 :
2010 .... It is a time bound initiative of, the central Government, in partnership, with the states, the local Government, and the community for achieving the goal, of universalisation of elementary, education.” Along with it, bridge courses, and back-to-school camps have been, initiated to increase the enrollment in, elementary education. Mid-day meal, scheme has been implemented to, encourage attendance and retention of, children and improve their nutritional, status. These policies could add to the, literate population of India., The tenth plan endeavoured to, increase the enrollment in higher, education of the 18 to 23 years age group, from the present 6% to 9% by the end of, the plan period. The strategy focuses on, increasing access, quality, adoption of, states-specific curriculum modification,, vocationalisation and networking on the, use of information technology. The plan, also focuses on distant education,, convergence of formal, non-formal, distant, and IT education institutions. Over the, past fifty years, there has been a, significant growth in the number of, university and institutions of higher, learning in specialised areas. Let us read, the table to see the increase in number, of college, universities, enrollment of, students and recruitment of teachers, since 1951 to 1999., , Activity, Count the number of boys and girls, studying in your class or in your, neighbouring co-ed school., Ask the school administrator to, provide you with the data of boys and, girls studying in your class below five, years and ten years. Study the, difference if any and explain it in the, classroom., 03 (Budgetary estimate). The literacy, rates have increased from 18% in 1951, to 65% in 2001. Literacy is not only a, right, it is also needed if the citizen are, to perform their duties and enjoy their, right properly. However, a vast difference, is noticed across different sections of, population. Literacy among males is, nearly 50% higher than females and it, is about 50% higher in urban areas as, compared to the rural areas. Literacy, rates vary from 96% in some district of, Kerala to a below 30% in some parts of, Madhya Pradesh. The primary school, system has expanded to over 5,00,000, villages in India. Unfortunately, this huge, expansion of schools has been diluted by, the poor quality of schooling and high, dropout rates. “Sarva Siksha Abhiyan is, a significant step towards providing, elementary education to all children in, the age group of six to fourteen years by, , Table 2.1: Number of Institutions of Higher Education, Enrolment and Faculty, Year, , Number of, Colleges, , Number of, Universities, , Students, , Teachers, , 1950–51, , 750, , 30, , 2,63,000, , 24,000, , 1990–91, , 7,346, , 177, , 49,25,000, , 2,72,000, , 1996–97, , 9,703, , 214, , 67,55,000, , 3,21,000, , 1998–99, , 11,089, , 238, , 74,17,000, , 3,42,000, , ❙ ✁✂✄☎: UGC Annual Report 1996–97 and 1998–99 and Selected Educational, Statistics, Ministry of HRD., , 22, , Economics
Page 25 :
Let’sDiscuss, Discuss this table in the classroom and, answer the following questions., 1. Is the increase in number of colleges, adequate to admit the increasing, number of students?, 2. Do you think we should have more, number of Universities?, 3. What is the increase noticed among, the teachers in the year 1998–99., 4. What is your idea about future college, and Universities?, , Health, Firm maximise profit: Do you think any, firm would be induced to employ people, who might not work efficiently as a, healthy worker because of ill health?, The health of a person helps him to, realise his potential and the ability to, fight illness. An unhealthy person, becomes a liability for an organisation, indeed; health is an indispensable basis, for realising one’s well being. Henceforth,, , improvement in the health status of the, population has been the priority of the, country. Our national policy, too, aimed, at improving the accessibility of health, care, family welfare and nutritional, service with special focus on under privileged segment of population. Over the, last five decades India has built up a vast, health infrastructure and man power, required at primary secondary and, tertiary care in Government as well as in, the private sector., These measures adopted have, increased the life expectancy to over, 64 years in 2000. *Infant mortality, rate (IMR) has come down from 147, in 1951 to 75 in 2000. **Crude birth, rates have dropped to 26.1 and, ***death rates to 8.7 within the same, duration of time. Increase in life, expectancy and improvement in, childcare are useful in assessing the, future progress of the country., Increase in longevity of life is an, indicator of good quality of life, marked by self-confidence. Reduction, in infant mortality involves the, protection of children from infection,, ensuring nutrition along with mother, and childcare., , ❙✒✓✔✕✖: National Health Policy, 2002., , Let’sDiscuss, , Picture 2.5, *, **, ***, , ❈ ✁✂✄☎✆✝ ✞✟✠✝✄✁✝✡ ✁✝ ☛☞✆☞✆ ✌✍☎, ✆✠✂✟ ❤ ✆❤✎✏☞✑, , Study the Table 2.2 and answer the, following questions., 1. What is the percentage increase in, dispensaries from 1951 to 2001?, 2. What is the percentage increase in, doctors and nursing personnel from, 1951 to 2001?, , ■✗✘✙✗✚ ✛✜✢✚✙✣✤✚✥ ✢✙✚✦ ✤✧ ✚★✦ ✩✦✙✚★ ✜✘ ✙ ✪★✤✣✩ ✫✗✩✦✢ ✜✗✦ ✥✦✙✢ ✜✘ ✙✬✦✭, ❇✤✢✚★ ✢✙✚✦✧ ✤✧ ✚★✦ ✗✫✛✮✦✢ ✜✘ ✮✙✮✤✦✧ ✮✜✢✗ ✚★✦✢✦ ✘✜✢ ✦✯✦✢✥ ✰✱✲✲✲ ✳✦✜✳✣✦ ✩✫✢✤✗✬ ✙ ✳✙✢✚✤✪✫✣✙✢ ✳✦✢✤✜✩ ✜✘ ✚✤✛✦✭, ❉✦✙✚★ ✢✙✚✦ ✤✧ ✚★✦ ✗✫✛✮✦✢ ✜✘ ✳✦✜✳✣✦ ✳✦✢ ✰✱✲✲✲ ✴★✜ ✩✤✦ ✩✫✢✤✗✬ ✙ ✳✙✢✚✤✪✫✣✙✢ ✳✦✢✤✜✩ ✜✘ ✚✤✛✦✭, People as Resource, , 23
Page 26 :
Table 2.2: Health infrastructure over the years, 1951, , H, , 1981, , 2001, , 725, , 57,363, , 1,63,181, , 9.209, , 23,555, , 43,322, , 1,17,198, , 5,69,495, , 8,70,161, , Doctors (Allopathy), , 61,800, , 2,68,700, , 5,03,900, , Nursing Personnel, , 18,054, , 1,43,887, , 7,37,000, , SC/PHC/CHC, , Dispensaries and Hospitals, , Beds, , SC: Sub centre, PHC: Primary Health Centre, CHC: Community Health Centre., Source: National Health Policy, 2002., , 3. Do you think the increase in the, number of doctor and nurses adequate, for India? If not, why?, 4. What other facilities would you like to, provide in a hospital?, 5. Discuss about the hospital you have, visited?, 6. Can you draw graph using this table., There are many places in India which, do not have even these basic facilities., Just four states like Karnataka, Andhra, Pradesh, Tamil Nadu, Maharashtra have, 81 out of 181 medical colleges. On the, other hand states like Bihar and Uttar, Pradesh have poor health indices and few, medical colleges., Activity, Visit a nearby hospital, either, government or private and note down, the following details., How many beds are there in the, hospital you have visited?, 24, , Economics, , How many doctors are there in the, hospital?, How many nurses work in that, hospital?, Besides, try to gather the following, additional information:, How many hospitals are there in your, locality?, How many dispensaries are there in, your locality?, , Unemployment, Sakal’s mother Sheela looked after the, domestic chores, children and helped her, husband Buta in the field. Sakal’s, brother, Jeetu and sister Seetu spend, their time playing and roaming. Can you, call Sheela or Jeetu or Seetu, unemployed? If not, why?, Unemployment is said to exist when, people who are willing to work at the going, wages cannot find jobs. Sheela is not, interested in working outside her
Page 27 :
domestic domain. Jeetu and Seetu are too, small to be counted in the work force, population. Neither Jeetu, Seetu or Sheela, can be counted as unemployed. The, workforce population includes people from, 15 years to 59 years. Sakal’s brother and, sister do not fall within this age group so, they cannot be called unemployed. Sakal’s, mother Sheela works for the family. She, is not willing to work outside her domestic, domain for payment. She too cannot be, called unemployed. Sakal’s grandparents, (although not mentioned in the story), cannot be called unemployed., In case of India we have unemployment, in rural and urban areas. However, the, nature of the unemployed differs in rural, and urban areas. In case of rural areas,, there is seasonal and disguised, unemployment. Urban areas have mostly, educated unemployment., Seasonal unemployment happens, when people are not able to find jobs, during some months of the year. People, dependant upon agriculture usually face, such kind of problem. There are certain, busy seasons when sowing, harvesting,, weeding, threshing is done. Certain, months do not provide much work to the, people dependant on agriculture., In case of disguised unemployment, people appear to be employed. They have, agricultural plot where they find work., This usually happens among family, members engaged in agricultural activity., The work requires the service of five, people but engages eight people. Three, people are extra. These three people also, work in the same plot as five people. The, contribution made by the three extra, people does not add to the contribution, made by the five people. If three people, are removed the productivity of the field, will not decline. The field requires the, service of five people and the three extra, people are disguisedly employed., In case of urban areas educated, unemployment has become a common, , phenomenon., Many, youth, with, matriculation, graduation and post, graduation degrees are not able to find, job. A study showed that unemployment, of graduate and post-graduate has, increased, faster, than, among, matriculates. A paradoxical manpower, situation is witnessed as surplus of, manpower in certain categories coexist, with shortage of manpower in others., There, is, unemployment, among, technically qualified person on one hand,, while there is a dearth of technical skills, required for economic growth., Unemployment leads to wastage of, manpower resource. People who are an, asset for the economy turn into a liability., There is a feeling of hopelessness and, despair among the youth. People do not, have enough money to support their, family. Inability of educated people who, are willing to work to find gainful, employment implies a great social waste., Unemployment tends to increase, economic overload. The dependence of the, unemployed on the working population, increases. The quality of life of an, individual as well as of society is adversely, affected. When a family has to live on a, bare subsistence level there is a general, decline in its health status and rising, withdrawal from the school system., Hence, unemployment has detrimental, impact on the overall growth of an, economy. Increase in unemployment is an, indicator of a depressed economy. It also, wastes the resource, which could have, been gainfully employed. If people cannot, be used as a resource they naturally, appear as a liability to the economy., In case of India, statistically, the, unemployment rate is low. A large, number of people represented with low, income and productivity are counted as, employed. They appear to work, throughout the year but in terms of their, potential and income, it is not adequate, for them. The work that they are pursuing, People as Resource, , 25
Page 28 :
seems forced upon them. They may, therefore want other work of their choice., Poor people cannot afford to sit idle. They, tend to engage in any activity irrespective, of its earning potential. Their earning, keeps them on a bare subsistence level., , the secondary sector, small scale, manufacturing is the most labour absorbing. In case of the tertiary sector,, various new services are now appearing, like biotechnology, information technology, and so on., Let us read a story to know how people, could become an asset for the economy of, a village., Story of a Village, , Picture 2.6, , ✥ ✁ ✂✄☎ ✆✝✞✝✞✟✝✆ ✠✄✡ ✞☎☛✠ ☞✌☞, ✂✄☎ ② ✂ ✡✠✝✁ ✂✄☎ ✍✎✝☞ ✠✌✞ ✏✄, ✞✝✁☞ ✂✄☎✆ ✍✠✄✝✍ ✄✆ ✍✑✌②②✝✆✍✒, , Moreover, the employment structure, is characterised by self-employment in the, primary sector. The whole family, contributes in the field even though not, everybody is really needed. So there is, disguised unemployment in the, agriculture sector. But all the family also, have a share in what has been produced., This concept of sharing of work in the field, and the produce raised reduces the, hardship of unemployment in the rural, sector. But this does not reduce the, poverty of the family, gradually surplus, labour from every household tends to, migrate from the village in search of jobs., Let us discuss about the employment, scenario in the three sectors mentioned, earlier. Agriculture, is the most labour, absorbing sector of the economy. In recent, years, there has been a decline in the, dependence of population on agriculture, partly because of disguised unemployment, discussed earlier. Some of the surplus, labour in agriculture has moved to either, the secondary or the tertiary sector. In, 26, , Economics, , There was a village inhabited by, several families. Each family, produced enough to feed its members., Each family met its needs by the, members making their own clothes, and teaching their own children. One, of the families decided to send one of, its sons to an agriculture college. The, boy got his admission in the nearby, college of agriculture. After some time, he became qualified in agroengineering and came back to the, village. He proved to be so creative, that he could design an improved type, of plough, which increased the yield, of wheat. Thus a new job of agroengineer was created and filled in the, village. The family in the village sold, the surplus in a nearby neighbouring, village. They earned good profit,, which, they, shared, among, themselves. Inspired by this success, all the families after some time held, a meeting in the village. They all, wanted to have a better future for, their children too. They requested the, panchayat to open a school in the, village. They assured the panchayat, that they would all send their, children to school. The panchayat,, with the help of government, opened, a school. A teacher was recruited, from a nearby town. All the children, of this village started going to school., After sometime one of the families, gave training to his daughter in
Page 29 :
tailoring. She started stitching clothes, for all the families of the village for, everyone now wanted to buy and wear, well-tailored clothes. Thus another, new job, that of a tailor was created., This had another positive effect. The, time of the farmers in going far for, buying clothes was saved. As the, farmers spent more time in the field,, the yield of the farms went up. This, was the beginning of prosperity. The, farmers had more than they could, , consume. Now they could sell what, they produced to others who came to, their village markets. Over time, this, village, which formally had no job, opportunities in the beginning, had, many like teacher, tailor, agro–, engineer and many more. This was, the story of a simple village where, the rising level of human capital, enabled it to evolve into a place rich, with complex and modern economic, activities., , Summary, You have seen how inputs like education and health helped in making people an, asset for the economy. The chapter also discusses about the economic activities, undertaken in the three sectors of the economy. We also study about the problem, associated with unemployment. Finally the chapter ends with the story of a village, which formally had no job but later had plenty., , Exercises, 1. What do you understand by 'people as a resource'?, 2. How is human resource different from other resources like land and physical, capital?, 3. What is the role of education in human capital formation?, 4. What is the role of health in human capital formation?, 5. What part does health play in the individual’s working life?, 6. What are the various activities undertaken in the primary sector, secondary, sector and tertiary sector?, 7. What is the difference between economic activities and non-economic activities?, 8. Why are women employed in low paid work?, 9. How will you explain the term unemployment?, 10. What is the difference between disguised unemployment and seasonal, unemployment?, 11. Why is educated unemployed, a peculiar problem of India?, 12. In which field do you think India can build the maximum employment, opportunity?, 13. Can you suggest some measures in the education system to mitigate the problem, of the educated unemployed?, 14. Can you imagine some village which initially had no job opportunities but, later came up with many?, 15. Which capital would you consider the best — land, labour, physical capital, and human capital? Why?, People as Resource, , 27
Page 30 :
References, GARY, S. BECKER. 1966. ❍, , ✁✂✄ ☎✂✆✝✞✂✟: ❆ ✞✠✡☛☞✡✞✝✌✂✟ ✂✄✍ ✎✁✆✝☞✝✌✂✟ ❆✄✂✟✏✑✝✑✒ ✓✝✞✠ ✔✆✡✌✝✂✟, ❘✡✕✡☞✡✄✌✡ ✞☛ ✎✍ ✌✂✞✝☛✄, General Series. Number 80. New York. National Bureau, of Economic Research., , THEODORE W. SCHULTZ. “■✄✖✡✑✞✁✡✄✞, March 1961., , ✝✄ ❍ ✁✂✄ ☎✂✆✝✞✂✟” American Economic Review., , Economic Survey 2004–2005. Ministry of Finance, Government of India, New Delhi., India Vision 2020. The Report. Planning Commission. Government of India, New, Delhi., Mid-Term Appraisal of the Tenth Five Year Plan (2002–2007). Planning Commission,, Part II. New Delhi., Tenth Five Year Plan ( 2002–2007). Planning Commission, New Delhi., , 28, , Economics
Page 31 :
3, , Poverty as a Challenge, , Chapter, , ❞ ✆✝✆☎✞ They could also be beggars with, , Overview, This chapter deals with one of the most, difficult challenges faced by independent, India—poverty. After discussing this, multi-dimensional problem through, examples, the chapter discusses the way, poverty is seen in social sciences. Poverty, trends in India and the world are, illustrated through the concept of the, poverty line. Causes of poverty as well as, anti-poverty measures taken by the, government are also discussed. The, chapter ends with broadening the official, concept of poverty into human poverty., , Introduction, In our daily life, we come across many, people who we think are poor. They could, be landless labourers in villages or people, living in overcrowded ❥ ✁✂✂✄☎ in cities. They, could be daily wage workers at, construction sites or child workers in, , Picture 3.1, , children in tatters. We see poverty all, around us. In fact, every fourth person in, India is poor. This means, roughly 260, million (or 26 crore) people in India live, in poverty. This also means that India has, the largest single concentration of the poor, in the world. This illustrates the, seriousness of the challenge., , Two Typical Cases of Poverty, Urban Case, Thirty-three year old Ram Saran works, as a daily-wage labourer in a wheat, flour mill near Ranchi in Jharkhand., He manages to earn around Rs 1,500, a month when he finds employment,, which is not often. The money is not, enough to sustain his family of six—, that includes his wife and four children, aged betweem 12 years to six months., , ✥✟✠✡☛ ✠☞ ✌✍✎ ✥✍✡✍✏, Poverty as a Challenge, , 29
Page 32 :
He has to send money home to his old, parents who live in a village near, Ramgarh. His father a landless, labourer, depends on Ram Saran and, his brother who lives in Hazaribagh,, for sustenance. Ram Saran lives in a, one-room rented house in a crowded, basti in the outskirts of the city. It’s a, temporary shack built of bricks and, clay tiles. His wife Santa Devi, works, as a part time maid in a few houses, and manages to earn another Rs 800., They manage a meagre meal of dal and, rice twice a day, but there’s never, enough for all of them. His elder son, works as a helper in a tea shop to, supplement the family income and, earns another Rs 300, while his 10year -old daughter takes care of the, younger siblings. None of the children, go to school. They have only two pairs, of hand-me-down clothes each. New, ones are bought only when the old, clothes become unwearable. Shoes are, a luxury. The younger kids are, undernourished. They have no access, to healthcare when they fall ill., , Rural case, Lakha Singh belongs to a small village, near Meerut in Uttar Pradesh. His, family doesn’t own any land, so they, do odd jobs for the big farmers. Work, is erratic and so is income. At times, they get paid Rs 50 for a hard day’s, work. But often it’s in kind like a few, kilograms of wheat or ❞ ✁ or even, vegetables for toiling in the farm, through the day. The family of eight, cannot always manage two square, meals a day. Lakha lives in a ❦✂✄☎☎, hut on the outskirts of the village., The women of the family spend the, day chopping fodder and collecting, firewood in the fields. His father a, TB patient, passed away two years, ago due to lack of medication. His, mother now suffers from the same, disease and life is slowly ebbing away., Although, the village has a primary, school, Lakha never went there. He, had to start earning when he was 10, years old. New clothes happen once, in a few years. Even soap and oil are, a luxury for the family., Study the above cases of poverty, and discuss the following issues, related to poverty:, , Picture 3.2, 30, , ✥✆✝✞✟ ✝✠ ✡☛☞✌☛ ✥✍✎✏✌, , Economics, , •, , Landlessness, , •, , Unemployment, , •, , Size of families, , •, , Illiteracy, , •, , Poor health/malnutrition, , •, , Child labour, , •, , Helplessness
Page 33 :
These two typical cases illustrate many, dimensions of poverty. They show that, poverty means hunger and lack of shelter., It also is a situation in which parents are, not able to send their children to school, or a situation where sick people cannot, afford treatment. Poverty also means lack, of clean water and sanitation facilities. It, also means lack of a regular job at a, minimum decent level. Above all it means, living with a sense of helplessness. Poor, people are in a situation in which they, are ill-treated at almost every place, in, farms, factories, government offices,, hospitals, railway stations etc. Obviously,, nobody would like to live in poverty., One of the biggest challenges of, independent India has been to bring, millions of its people out of abject poverty., Mahatama Gandhi always insisted that, India would be truly independent only, when the poorest of its people become free, of human suffering., , Poverty as seen by social scientists, Since poverty has many facets, social, scientists look at it through a variety of, indicators. Usually the indicators used, relate to the levels of income and, consumption. But now poverty is looked, through other social indicators like, illiteracy level, lack of general resistance, due to malnutrition, lack of access to, healthcare, lack of job opportunities, lack, of access to safe drinking water,, sanitation etc. Analysis of poverty based, on social exclusion and vulnerability is, now becoming very common (see box)., Social exclusion, According to this concept, poverty, must be seen in terms of the poor, having to live only in a poor, surrounding with other poor people,, excluded from enjoying social equality, of better -of f people in better, surroundings. Social exclusion can be, , both a cause as well as a, consequence of poverty in the usual, sense. Broadly, it is a process through, which individuals or groups are, excluded from facilities, benefits and, opportunities that others (their, “betters”) enjoy. A typical example is, the working of the caste system in, India in which people belonging to, certain castes are excluded from, equal opportunities. Social exclusion, thus may lead to, but can cause more, damage than, having a very low, income., Vulnerability, Vulnerability to poverty is a measure,, which describes the greater, probability of certain communities, (say, members of a backward caste), or individuals (such as a widow or a, physically handicapped person) of, becoming, or remaining, poor in the, coming years. Vulnerability is, determined by the options available, to different communities for finding, an alternative living in terms of, assets, education, health and job, opportunities. Further, it is analysed, on the basis of the greater risks these, groups face at the time of natural, disasters (earthquakes, tsunami),, terrorism etc. Additional analysis is, made of their social and economic, ability to handle these risks. In fact,, vulnerability describes the greater, probability of being more adversely, affected than other people when bad, time comes for everybody, whether a, flood or an earthquake or simply a, fall in the availability of jobs!, , Poverty Line, At the centre of the discussion on poverty, is usually the concept of the “poverty line”., A common method used to measure, poverty is based on the income or, Poverty as a challenge, , 31
Page 34 :
consumption levels. A person is, considered poor if his or her income or, consumption level falls below a given, “minimum level” necessary to fulfill basic, needs. What is necessary to satisfy basic, needs is different at different times and, in different countries. Therefore, poverty, line may vary with time and place. Each, country uses an imaginary line that is, considered appropriate for its existing level, of development and its accepted minimum, social norms. For example, a person not, having a car in the United States may be, considered poor. In India, owning of a car, is still considered a luxury., While determining the poverty line in, India, a minimum level of food, requirement, clothing, footwear, fuel and, light,, educational, and, medical, requirement etc. are determined for, subsistence. These physical quantities are, multiplied by their prices in rupees. The, present formula for food requirement, while estimating the poverty line is based, on the desired calorie requirement. Food, items such as cereals, pulses, vegetable,, milk, oil, sugar etc. together provide these, needed calories. The calorie needs vary, depending on age, sex and the type of, work that a person does. The accepted, average calorie requirement in India is, 2400 calories per person per day in rural, areas and 2100 calories per person per, day in urban areas. Since people living, in rural areas engage themselves in more, physical work, calorie requirements in, rural areas are considered to be higher, than urban areas. The monetary, expenditure per capita needed for buying, these calorie requirements in terms of, food grains etc. is revised periodically, taking into consideration the rise in, prices., On the basis of these calculations, for, the year 2000, the poverty line for a person, was fixed at Rs 328 per month for the, rural areas and Rs 454 for the urban, areas. Despite less calorie requirement,, 32, , Economics, , the higher amount for urban areas has, been fixed because of high prices of many, essential products in urban centres. In, this way in the year 2000, a family of five, members living in rural areas and, earning less than about Rs 1,640 per, month will be below the poverty line. A, similar family in the urban areas would, need a minimum of Rs 2,270 per month, to meet their basic requirements. The, poverty line is estimated periodically, (normally every five years) by conducting, sample surveys. These surveys are, carried out by the National Sample Survey, Organisation (NSSO). However, for, making comparisons between developing, countries,, many, international, organisations like the World Bank use a, uniform standard for the poverty line:, minimum availability of the equivalent of, $1 per person per day., , Let’sDiscuss, Discuss the following:, • Why do different countries use different, poverty lines?, • What do you think would be the, “minimum necessary level” in your, locality?, Poverty Estimates, It is clear from the Table 3.1 that there is, substantial decline in poverty ratios in, India from about 55 per cent in 1973 to, 36 per cent in 1993. The proportion of, people below poverty line further came, down to about 26 per cent in 2000. If the, trend continues, people below poverty line, may come down to less than 20 per cent, in the next few years. Although the, percentage of people living under poverty, declined in the earlier two decades (1973–, 1993), the number of poor remained stable, around 320 million for a fairly long period., The latest estimates indicate a significant, reduction in the number of poor to about, 260 million.
Page 35 :
Table 3.1: Estimates of Poverty in India, Poverty ratio (%), , Number of poor (in millions), , Year, , Rural, , Urban, , Combined, , Rural, , Urban, , Combined, , 1973–74, , 56.4, , 49.0, , 54.9, , 261, , 60, , 321, , 1993–94, , 37.3, , 32.4, , 36.0, , 244, , 76, , 320, , 1999–00, , 27.1, , 23.6, , 26.1, , 193, , 67, , 260, , ❙ ✁✂✄☎✆ Economic Survey 2002–03, Ministry of Finance, Government of India., , Let’sDiscuss, Study the Table 3.1 and answer the, following questions:, • Even if poverty ratio declined between, 1973–74 and 1993–94, why did the, number of poor remain at about 320, million?, • Are the dynamics of poverty reduction, the same in rural and urban India?, , Vulnerable Groups, The proportion of people below poverty line, is also not same for all social groups and, economic categories in India. Social, groups which are most vulnerable to, poverty are scheduled caste and, scheduled tribe households. Similarly,, , ✻✵, , ✏, ✏✡ ✡☛✖ ✺✵, ✠✎ ✠✍, ✠☞ ✕✔, ☛ ✠ ✹✵, ✍ ♦✍, ✝☛, ✡☛ ✞☛ ✸✵, ☛✌ ✡☞, ☞☛ ✓☛ ✷✵, ✡✠ ✒✡✠, ✟ ✌, ✞ ✑✑ ✗✵, ✝ ✶, ◆, , ✵, , among the economic groups, the most, vulnerable groups are the rural, agricultural labour households and the, urban casual labour households. The, following Graph 3.1 shows the percentage, of poor people in all these groups., Although the average for people below, poverty line for all groups in India is 26,, 51 out of 100 people belonging to, scheduled tribes are not able to meet their, basic needs. Similarly, 50 per cent of, casual workers in urban areas are below, poverty line. About 50 per cent of landless, agricultural workers and 43 per cent of, scheduled castes are also poor. The double, disadvantage, of being a landless casual, wage labour household in the socially, disadvantaged social groups of the, , Graph 3.1: Poverty in India 2000: Most Vulnerable Groups, , ✺✗, , ✺✵, , ✹✭, , ✹✸, ✷✻, , ✘✙✚✛✜✢✣✛✜, t✤✥✦✛✧, , ❯✤✦★✩ ✙★✧✢★✣, ✣★✦❧✢✤✛✤✧, , ❘✢✤★✣ ★✪✤✥✙✢✣t✢✤✛, ✣★✦❧✢✤✛✤✧, , ✘✙✚✛✜✢✣✛✜, ✙★✧t✛✧, , Social Groups and Economic Categories, , ❆✈✛✤★✪✛ ✫✩✜✥★✩, ♣❧✈✛✤t✬ ✤★t✥❧, , ❙ ✁✂✄☎✆ Reports on Employment and Unemployment among Social Groups in India No. 469,472,, NSSO, Ministry of Statistics, Programme Implementation, Govt of India., Poverty as a Challenge, , 33
Page 36 :
Picture 3.3, , ✥ ✁✂✄ ✁☎ ✥✆✝✞✂✞✟✞✠, , scheduled caste or the scheduled tribe, population highlights the seriousness of, the problem. Some recent studies have, shown that except for the scheduled tribe, households, all the other three groups (i.e., scheduled castes, rural agricultural, labourers and the urban casual labour, households) have seen a decline in poverty, in the 1990s., Apart from these social groups, there, is also inequality of incomes within a, family. In poor families all suffer, but some, suffer more than others. Women, elderly, people and female infants are, systematically denied equal access to, resources available to the family., Therefore women, children (especially the, girl child) and old people are poorest of, the poor (see box)., 34, , Economics, , Story of Sivaraman, Sivaraman lives in a small village, near Karur town in Tamil Nadu. Karur, is famous for its handloom and, powerloom fabrics. There are a 100, families in the village. Sivaraman an, ❆✡☛☞✌✍✎✏✍✎✑☛✏✡ (cobbler) by caste now, works as an agricultural labourer for, Rs 50 per day. But that’s only for five, to six months in a year. At other, times, he does odd jobs in the town., His wife Sasikala too works with him., But she can rarely find work these, days, and even if she does, she’s paid, Rs 25 per day for the same work that, Sivaraman does. There are eight, members in the family. Sivaraman’s, 65 year old widowed mother is ill and
Page 37 :
needs to be helped with her daily, chores. He has a 25-year -old, unmarried sister and four children, aged between 1 year to 16 years., Three of them are girls, the youngest, is a son. None of the girls go to school., Buying books and other things for, school-going girls is a luxury he, cannot afford. Also, he has to get them, married at some point of time so he, doesn’t want to spend on their, education now. His mother has lost, interest in life and is just waiting to, die someday. His sister and elder, daughter take care of the household., Sivaraman plans to send his son to, school when he comes of age. His, unmarried sister does not get along, with his wife. Sasikala finds her a, burden but Sivaraman can’t find a, suitable groom due to lack of money., Although the family has difficulty in, arranging two meals a day,, Sivaraman manages to buy milk once, in a while, but only for his son., , Let’sDiscuss, Observe some of the poor families, around you and try to find the following:, •, •, •, •, , Which social and economic group do, they belong to?, Who are the earning members in the, family?, What is the condition of the old people, in the family?, Are all the children (boys and girls), attending schools?, , Inter-State Disparities, Poverty in India also has another aspect, or dimension. The proportion of poor, people is not the same in every state., , Although state level poverty has witnessed, a secular decline from the levels of early, seventies, the success rate of reducing, poverty varies from state to state. Recent, estimates show that in 20 states and, union territories, the poverty ratio is less, than the national average. On the other, hand, poverty is still a serious problem, in Orissa, Bihar, Assam, Tripura and, Uttar Pradesh. As the Graph 3.2 shows,, Orissa and Bihar continue to be the two, poorest states with poverty ratios of 47, and 43 per cent respectively. Along with, rural poverty urban poverty is also high, in Orissa, Madhya Pradesh, Bihar and, Uttar Pradesh., In comparison, there has been a, significant decline in poverty in Kerala,, Jammu and Kashmir, Andhra Pradesh,, Tamil Nadu, Gujarat and West Bengal., States like Punjab and Haryana have, traditionally succeeded in reducing, poverty with the help of high agricultural, growth rates. Kerala has focused more on, human resource development. In West, Bengal, land reform measures have, helped in reducing poverty. In Andhra, Pradesh and Tamil Nadu public, distribution of food grains could have been, responsible for the improvement., , Global Poverty Scenario, The proportion of people in developing, countries living in extreme economic, poverty— defined by the World Bank as, living on less than $1 per day—has fallen, from 28 per cent in 1990 to 21 per cent in, 2001. Although there has been a, substantial reduction in global poverty, it, is marked with great regional differences., Poverty declined substantially in China, and Southeast Asian countries as a result, of rapid economic growth and massive, investments, in, human, resource, development. Number of poors in China, has come down from 606 million in 1981, to 212 million in 2001. In the countries of, ❙ ✁✂✄ ☎✆✝✞ (India, Pakistan, Sri Lanka,, Nepal, Bangladesh, Bhutan) the decline has, Poverty as a challenge, , 35
Page 38 :
Graph 3.2: Poverty Ratio in Selected Indian States, 1999–2000, , ✌✺ ✢✣✤✥, ✹✌, ✢✥✤✦, ✧✣✤✢ ✧✦✤★, ✘✍✗ ✍ ✹✺, ✧✢✤✢, ✕✍ ✜✑✘ ✸✌, ✧★✤✥, ✗✖ ✛✒ ✸✺, ✎, ✥✣✤★ ✥✦✤★, ✕ ✍, ✥✩, ✍✔ ✚✕ ✷✌, ✥★✤★ ✥✪, ✓✒ ✗, ✑✍ ✙✕ ✷✺, ★✩✤✫ ★✩✤✧ ★✢, ✏✎ ✘✍ ✶✌, ★✥✤✣, ✍P ❜, ✫✤✣ ✫✤✥ ✣✤✦, ✶✺, ✦✤✥, ✧✤✩, ✌, ✺ ✮✯ ✯✬ ✮✰ ✻ ✬✯ ✮✰ ✯❛ ✭✯ ✬✯, ✲r ❃✯ ✰ ✯❀ ✬✯✽ ✯❛✯ ❀✯ ❛✰✭ ✮✰ ❄✯❈ ✭✬, ✮, ✵ ✯ r, ❡ ✲ ✽, ❖✬✭ ❇✭✰ ✴✬✯✲ ❆✮✮ ❚✬✭✴ ✾✬✯✲✵ ✽ ❇✵❀ ❆❛❛ ✿❀ ✯✬✯✮✰ ✻✭❛ ✼✯ ✯✬❀ ✯✽✯ ✾✬✯✲✵✮ ✯❄✯✮✽✰ ●r❄✯ ❂✵✬ ❍✯✬✳✯ ❊✵ ❛ ✾✬✯✲✵ ✾r❀ ✯✮✰✻, ✮, ❂, ✯✬, ✰✳✯, ✱✯✰ ❚✯ ❂ ❀✲✰✬✯ ❘, ❅✰✯, ❯✽✽ ❲✵, r❁, ✯, ✻, ✻, ✱✯✲, ✭, ❆, ❍, ❏✯✻, ❙❋■❑▲◆: Economic Survey 2001–02, Ministry of Finance, Government of India, Let’sDiscuss, Study the Graph 3.2 and do the following:, • Identify the three states where the, poverty ratio is the highest., • Identify the three states where poverty, ratio is the lowest., not been as rapid. Despite decline in the, percentage of the poor, the number of poor, has declined marginally from 475 million, in 1981 to 428 million in 2001. Because of, different poverty line definition, poverty in, India is also shown higher than the, national estimates., In Sub-Saharan Africa, poverty in fact, rose from 41 per cent in 1981 to 46 per, cent in 2001 (see graph 3.3). In Latin, America, the ratio of poverty remained the, same. Poverty has also resurfaced in, some of the former socialist countries like, Russia, where officially it was nonexistent earlier. Table 3.2 shows the, proportion of people living under poverty, in different countries as defined by the, ✐ ✁✂✄ ♥✁✐☎ ♥✆ ✝☎✞✂✄✁✟ ✆✐ ✂ (means, population below $1 a day). The ▼✐✆✆✂ ✐✠✡, ❉✂✞✂✆☎✝✡✂ ✁ ☛☎♥✆☞ of the United Nations, 36, , Economics, , calls for reducing the proportion of people, living on less than $1 a day to half the, 1990 level by 2015., , Let’sDiscuss, Study the Graph 3.4 and do the following:, • Identify the areas of the world, where, poverty ratios have declined., • Identify the area of the globe which has, the largest concentration of the poor., , Table 3.2: Poverty: Comparison among, Some Selected Countries, Country, 1. Nigeria, 2. Bangladesh, 3. India, 4. Pakistan, 5. China, 6. Brazil, 7. Indonesia, 8. Sri Lanka, , % of Population below, $1 a day, 70.8, 36.0, 35.3, 17.0, 16.6, 8.2, 7.5, 5.6, , ❙❋■❑▲◆: World Development Report, 2001.
Page 39 :
Graph 3.3: Share of people living on $1 a day, 1980–2001, , ✼✵, ✻✵, ✺✵, ✙✣, , ✢✜ ✹✵, , ❈✝✞✟✠, ❊✠✡☛ ☞✡✞✠ ✌, P✠✍✞✎✞✍, ✏✑✒☛✝ ☞✡✞✠, ✏✒✓✔✏✠✝✠✕✠✟ ☞✎✕✞✍✠, , ✏✒✓✔✏✠✝✠✕✠✟ ☞✎✕✞✍✠, , ✛✙, , ✚❝✙ ✸✵, ✘, , ✏✑✒☛✝ ☞✡✞✠, , ✷✵, ✶✵, ✵, , ❈✝✞✟✠, ❊✠✡☛ ☞✡✞✠ ✌, P✠✍✞✎✞✍, ▲✠☛✞✟ ☞✖✗✕✞✍✠✟ ✌ ❈✠✕✕✞✓✗✠✟, , ▲✠☛✞✟ ☞✖✗✕✞✍✠✟ ✌ ❈✠✕✕✞✓✗✠✟, , ✶☎✆✶, , ✶☎☎✵, ❨✤✥✦✧, , ✷✵✵✶, , ❙ ✁✂✄❡: World Development Indicators 2005, The World Bank., Graph 3.4: Number of poor by region ($ 1 per day) in millions, , ❍■❉❉, , ❍❉❉❉, , ◗ ★■❉❉, , ❂❃❄❅❂✯✬✯❁✯✮ ✳✿❁✭✾✯, , ❖, ◆❏, ❑❑, ❏, ▼, , ♦✲✬❀❁✱, , ✰✯✱✲ ✳✱✭✯ ✴, ✽✯✾✭✿✭✾, , ★❉❉❉, , ✫✬✭✮✯, , ■❉❉, , ❂♦❃✲✬ ✳✱✭✯, ❉, ★✩✪★, , ★✩✪❆, , ★✩✪❇, , ★✩✩❉, , ❘❚❯❱❲, , ★✩✩❋, , ★✩✩●, , ★✩✩✩, , ❍❉❉★, , ❙ ✁✂✄❡: World Development Indicators 2005, The World Bank., Poverty as a Challenge, , 37
Page 40 :
Causes of Poverty, There were a number of causes for the, widespread poverty in India. One, historical reason is the low level of, economic development under the British, colonial administration. The policies of, the colonial government ruined traditional, handicrafts and discouraged development, of industries like textiles. The low rate of, growth persisted until the nineteeneighties. This resulted in less job, opportunities and low growth rate of, incomes. This was accompanied by a high, growth rate of population. The two, combined to make the growth rate of per, capita income very low. The failure at both, the fronts: promotion of economic growth, and population control perpetuated the, cycle of poverty., With the spread of irrigation and the, Green revolution, many job opportunities, were created in the agriculture sector. But, the effects were limited to some parts of, India. The industries, both in the public, and the private sector, did provide some, jobs. But these were not enough to absorb, all the job seekers. Unable to find proper, jobs in cities, many people started working, as, rickshaw, pullers,, vendors,, construction workers, domestic servants, etc. With irregular small incomes, these, people could not afford expensive housing., They started living in slums on the, outskirts of the cities and the problems, of poverty, largely a rural phenomenon, also became the feature of the urban, sector., Another feature of high poverty rates, has been the huge income inequalities., One of the major reasons for this is the, unequal distribution of land and other, resources. Despite many policies, we have, not been able to tackle the issue in a, meaningful manner. Major policy, initiatives like land reforms which aimed, at redistribution of assets in rural areas, have not been implemented properly and, 38, , Economics, , effectively by most of the state, governments. Since lack of land resources, has been one of the major causes of, poverty in India, proper implementation, of policy could have improved the life of, millions of rural poor., Many other socio-cultural and, economic factors also are responsible for, poverty. In order to fulfil social obligations, and observe religious ceremonies, people, in India, including the very poor, spend a, lot of money. Small farmers need money, to buy agricultural inputs like seeds,, fertilizer, pesticides etc. Since poor people, hardly have any savings, they borrow., Unable to repay because of poverty, they, become victims of indebtedness. So the, high level of indebtedness is both the, cause and effect of poverty., , Anti-Poverty Measures, Removal of poverty has been one of the, major objectives of Indian developmental, strategy. The current anti-poverty, strategy of the government is based, broadly on two planks (1) promotion of, economic growth (2) targeted anti-poverty, programmes., Over a period of thirty years lasting, up to the early eighties, there were little, per capita income growth and not much, reduction in poverty. Official poverty, estimates which were about 45 per cent, in the early 1950s remained the same even, in the early eighties. Since the eighties,, India’s economic growth has been one of, the fastest in the world. The growth rate, jumped from the average of about 3.5 per, cent a year in the 1970s to about 6 per, cent during the 1980s and 1990s. The, higher growth rates have helped, significantly in the reduction of poverty., Therefore, it is becoming clear that there, is a strong link between economic growth, and poverty reduction. Economic growth, widens opportunities and provides the, resources needed to invest in human, development. This also encourages people
Page 41 :
to send their children, including the girl, child, to schools in the hope of getting, better economic returns from investing in, education. However, the poor may not be, able to take direct advantage from the, opportunities created by economic, growth. Moreover, growth in the, agriculture sector is much below, expectations. This has a direct bearing, on poverty as a large number of poor, people live in villages and are dependent, on agriculture., In these circumstances, there is a, clear need for targeted anti-poverty, programmes. Although there are so many, schemes which are formulated to affect, poverty directly or indirectly, some of them, are worth mentioning. ◆ ✁✂✄☎ ✆ ✝✞✟ ✆, ❊✠✡✆✄☛✠☞☎✁ ✌✞ ✟ ☎✁☞☞ ✍✎✁ (NREGA) 2005, was passed in September 2005. The Act, provides 100 days assured employment, every year to every rural household in 200, districts. Later, the scheme will be, extended to 600 districts. One third of the, proposed jobs would be reserved for, women. The central government will also, establish, National, Employment, Guarantee Funds. Similarly state, governments will establish State, Employment Guarantee Funds for, implementation of the scheme. Under the, programme if an applicant is not provided, employment within fifteen days s/he will, be entitled to a daily unemployment, allowance. Another important scheme has, been the ◆ ✁✂✄☎ ✆ ✏✄✄✑ ✒✄✟ ✓✄✟♦ ✔✟✄✕✟ ✠✠☞, (NFWP), which was launched in 2004 in, 150 most backward districts of the, country. The programme is open to all, rural poor who are in need of wage, employment and desire to do manual, unskilled work. It is implemented as a, 100 per cent centrally sponsored scheme, and foodgrains are provided free of cost, to the states. Once the NREGA is in force,, the NFWP will be subsumed within this, programme., , ✔✟✂✠☞ P✂☎✂✖✁☞✟ ✝✄✗✕ ✟ ✘✄✗ ☎ (PMRY), is another scheme which was started in, 1993. The aim of the programme is to, create self-employment opportunities for, educated unemployed youth in rural areas, and small towns. They are helped in, setting up small business and industries., , ✝✞✟ ✆ ❊✠✡✆✄☛✠☞☎✁ ✌☞☎☞✟ ✁✂✄☎ ✔✟✄✕✟ ✠✠☞, , (REGP) was launched in 1995. The aim of, the programme is to create selfemployment opportunities in rural areas, and small towns. A target for creating 25, lakh new jobs has been set for the, programme under the Tenth Five Year, plan. ❙✙ ✟☎ ♥ ☛ ☎✁✂ ✌✟ ✠ ❙✙ ✟✄✗✕ ✟, ✘✄♥ ☎ (SGSY) was launched in 1999. The, programme aims at bringing the assisted, poor families above the poverty line by, organising them into self help groups, through a mix of bank credit and, government subsidy. Under the ✔✟ ✑✚ ☎, P ☎✁✟✂ ✌✟ ✠✄✑ ☛ ✘✄✗ ☎ (PMGY), launched in 2000, additional central, assistance is given to states for basic, services such as primary health, primary, education, rural shelter, rural drinking, water and rural electrification. Another, important scheme is ✍☎✁☛✄✑ ☛ ✍☎☎, ✘✄✗ ☎ (AAY) about which you will be, reading more in the next chapter., The results of these programmes have, been mixed. One of the major reasons for, less effectiveness is the lack of proper, implementation and right targeting., Moreover, there has been a lot of, overlapping of schemes. Despite good, intentions, the benefits of these schemes, are not fully reached to the deserving poor., Therefore, the major emphasis in recent, years is on proper monitoring of all the, poverty alleviation programmes., The Challenges Ahead, Poverty has certainly declined in India., But despite the progress, poverty, reduction, remains, India’s, most, compelling challenge. Wide disparities in, poverty are visible between rural and, Poverty as a challenge, , 39
Page 42 :
urban areas and among different states., Certain social and economic groups are, more vulnerable to poverty. Poverty, reduction is expected to make better, progress in the next ten to fifteen years., This would be possible mainly due to, higher economic growth, increasing stress, on universal free elementary education,, declining population growth, increasing, empowerment of the women and the, economically weaker sections of society., The official definition of poverty,, however, captures only a limited part of, what poverty really means to people. It is, about a “minimum” subsistence level of, living rather than a “reasonable” level of, living. Many scholars advocate that we, must broaden the concept into ☛☞✌✍✎, ✏✑✒✓✔✕✖. A large number of people may, , have been able to feed themselves. But, do they have education? Or shelter? Or, health care? Or job security? Or selfconfidence? Are they free from caste and, gender discrimination? Is the practice of, child labour still common? Worldwide, experience shows that with development,, the definition of what constitutes poverty, also changes. Eradication of poverty is, always a moving target. Hopefully we will, be able to provide the minimum, “necessary” in terms of only income to all, people by the end of the next decade. But, the target will move on for many of the, bigger challenges that still remain:, providing health care, education and job, security for all, and achieving gender, equality and dignity for the poor. These, will be even bigger tasks., , Summary, You have seen in this chapter that poverty has many dimensions. Normally, this is, measured through the concept of “poverty line”. Through this concept we analysed, main global and national trends in poverty. But in recent years, analysis of poverty is, becoming rich through a variety of new concepts like social exclusion. Similarly, the, challenge is becoming bigger as scholars are broadening the concept into ❤ ✁✂✄, , ♣☎✆✝✞✟✠✡, , Exercises, 1., 2., 3., 4., 5., 6., 7., 8., 9., , 40, , Describe how the poverty line is estimated in India., Do you think that present methodology of poverty estimation is appropriate?, Describe poverty trends in India since 1973., Discuss the major reasons for poverty in India., Identify the social and economic groups which are most vulnerable to poverty, in India., Give an account of interstate disparities in poverty in India., Describe global poverty trends., Describe current government strategy of poverty alleviation., Answer the following questions briefly, (i) What do you understand by human poverty?, (ii) Who are the poorest of the poor?, (iii) What are the main features of the National Rural Employment, Guarantee Act 2005?, , Economics
Page 43 :
References, DEATON, ANGUS AND VALERIE KOZEL (Eds.) 2005., MacMillan India Limited, New Delhi., , ❚ ✁ ✂✄✁☎✆ ✝✞✟✠☎✞ ✡☛☞✁✄✆✌ ✍✁✎☎✆✁., , Economic Survey 2002–2003. Ministry of Finance, Government of India, New Delhi., (Chapter on social sectors, [Online web] URL: http://indiabudget.nic.in/, es_2002–03/social.htm), Economic Survey 2004–2005. Ministry of Finance, Government of India, New Delhi., (Chapter on social sectors, [Online web] URL: http://indiabudget.nic.in/, es_2004–05/social.htm), Mid-Term Appraisal of the Tenth Five Year Plan 2002–2007. Planning Commission,, New Delhi. Part II, Chapter 7: Poverty Elimination and Rural Employment,, [Online web] URL: http://www.planningcommission.nic.in/midterm/englishpdf/chapter-07.pdf, National Rural Employment Guarantee Act 2005. [Online web] URL: http://, rural.nic.in/rajaswa.pdf, Tenth Five Year Plan 2002–2007. Planning Commission, New Delhi. (Chapter 3.2,, Poverty Alleviation in Rural India: Strategy and Programmes, [Online web] URL:, http://www.planningcommission.nic.in/plans/planrel/fiveyr/10th/volume2/, v2_ch3_2.pdf, World Development Report 2000–2001. Attacking Poverty, The World Bank, Oxford, University Press, Delhi., , Poverty as a Challenge, , 41
Page 44 :
4, , Food Security in India, , Chapter, , Overview, •, , Food security means availability,, accessibility and affordability of food, to all people at all times. The poor, households are more vulnerable to food, insecurity whenever there is a problem, of production or distribution of food, crops. Food security depends on the, Public Distribution System (PDS),, Government vigilance and action at, times when this security is threatened., , What is food security?, Food is as essential for living as air is for, breathing. But food security means, something more than getting two square, meals. Food security has following, dimensions, (a) ❛ ❛✁✂❛✄✁✂ ✁☎✆ ✝✞ ✞✝✝✟ means food, production within the country, food, imports and the previous years stock, stored in government granaries., (b) ❛✠✠✡☛☛✁✄✁✂✁☎✆ means food is within reach, of every person., (c) ❛✞✞✝☞✟❛✄✁✂✁☎✆ implies that an individual, has enough money to buy sufficient,, safe and nutritious food to meet one's, dietary needs., Thus, food security is ensured in a, country only if (1) enough food is available, for all the persons (2) all persons have, the capacity to buy food of acceptable, quality and (3) there is no barrier on, access to food., Why food security?, The poorest section of the society might, be food insecure most of the times while, persons above the poverty line might also, be food insecure when the country faces, 42, , Economics, , In the 1970s, food security was, understood as the “availability at all times, of adequate supply of basic foodstuffs”, (UN, 1975). Amartya Sen added a new, dimension to food security and, emphasised the “access” to food through, what he called ‘entitlements’ — a, combination of what one can produce,, exchange in the market alongwith state, or other socially provided supplies., Accordingly, there has been a substantial, shift in the understanding of food security., The 1995 World Food Summit declared,, “Food security at the individual,, household, regional, national and global, levels exists when all people, at all times,, have physical and economic access to, sufficient, safe and nutritious food to meet, their dietary needs and food preferences, for an active and healthy life” (FAO, 1996,, p.3). The declaration further recognises, that “poverty eradication is essential to, improve access to food”., , a national disaster/calamity like, earthquake, drought, flood, tsunami,, widespread failure of crops causing, famine, etc. ❍✌✍ ✎✏ ✑ ✌✌✒ ✏✓✔ ✕✖✎✗✘, ✙✑✑✓✔✗✓✒ ✒✕✖✎✚✛ ✙ ✔✙❝✙✜✎✗✘✢ Due to a, natural calamity, say drought, total, production of foodgrains decreases. It, creates a shortage of food in the affected, areas. Due to shortage of food, the prices, go up. At the high prices, some people, cannot afford to buy food. If such calamity, happens in a very wide spread area or is, stretched over a longer time period, it, may cause a situation of starvation., A massive starvation might take a turn, of famine., , ❆ ✣❛✤✁✥✡ ✁☛ ✠✦❛☞❛✠☎✡☞✁☛✡✟ ✄✆ ✧✁✟✡, ☛s☞✡❛✟ ✟✡❛☎✦☛ ✟★✡ ☎✝ ☛☎❛☞ ❛☎✁✝✥ ❛✥✟
Page 45 :
❡✣✤✦❡✧✤★✩ ★✪✫✩❡✦ ✬✭ ✮✯✰★❡✦ ✫✩❡ ✯✮, ★✯❝✱✪✧✤❝✪✱❡✦ ✲✪✱❡✰ ✯✰ ✦❡★✪✭✤❝✳ ✮✯✯✦ ✪❝✦, ❧✯✩✩ ✯✮ ✬✯✦✭ ✰❡✩✤✩✱✪❝★❡ ✦✫❡ ✱✯ ✲❡✪✴❡❝✤❝✳, ✮✰✯✧ ✩✱✪✰❢✪✱✤✯❝✵, The most devastating famine that, occurred in India was the FAMINE OF, BENGAL in 1943. This famine killed thirty, lakh people in the province of Bengal., , Do you know who were affected the, most by the famine? The agricultural, labourers, fishermen, transport, workers and other casual labourers, were affected the most by dramatically, increasing price of rice. They were the, ones who died in this famine., , Table 4.1: Production of Rice in the Province of Bengal, Year, , Production, (Lakh tonnes), , Imports, (Lakh tonnes), , Exports, (Lakh tonnes), , Total Availability, (Lakh tonnes), , 1938, , 85, , –, , –, , 85, , 1939, , 79, , 04, , –, , 83, , 1940, , 82, , 03, , –, , 85, , 1941, , 68, , 02, , –, , 70, , 1942, , 93, , –, , 01, , 92, , 1943, , 76, , 03, , –, , 79, , ❙✙✚✛✜✢: Sen, A.K, 1981 Page 61, , Let’sDiscuss, 1., 2., , Some people say that the Bengal famine happened because there was a shortage, of rice. Study the table and find out whether you agree with the statement?, Which year shows a drastic decline in food availability?, , Picture 4.1 ✥✆✠✁✔✠✆✂✌✄ ✔✂✗✆✂☞✕ ✠✁✁✂✔✂✄☎ ✠✆ ✠, , ✁✞✡✂✞✍ ✗✞✄✆✁✞✒ ✶✎✏r✘, , Picture 4.2, , ❉ ✁✂✄☎ ✆✝✞ ✟✞✄☎✠✡ ☛✠☞✂✄✞ ✌✍, ✶✎✏✑✒ ✠ ✍✠☞✂✡✓ ✡✞✠✔✞✕ ✂✆✕ ✔✂✡✡✠☎✞, ✂✄ ✐✝✂✆✆✠☎✌✄☎ ✖✂✕✆✁✂✗✆ ✂✄ ✟✞✄☎✠✡✘, , Food Security in India, , 43
Page 46 :
Suggested Activity, (a) What do you see in Picture 4.1?, (b) Which age group is seen in the first, picture?, (c) Can you say that the family shown in, the Picture 4.2 is a poor family? why?, (d) Can you imagine the source of, livelihood of the people, (shown in two, Pictures) before the occurrence of, famine? (In the context of a village), (e) Find out what type of help is given to, the victims of a natural calamity at a, relief camp., (f ) Have you ever helped such victims (in, the form of money, food, clothes,, medicines etc.), PROJECT WORK: Gather more, information about famines in India., Nothing like the Bengal Famine has, happened in India again. But it is, disturbing to note that even today, there, are places like Kalahandi and Kashipur, in Orissa where famine-like conditions, have been existing for many years and, where some starvation deaths have also, been reported. Starvation deaths are also, reported in Baran district of Rajasthan,, Palamau district of Jharkhand and many, other remote areas during the recent, years. Therefore, food security is needed, in a country to ensure food at all times., Who are food-insecure?, Although a large section of people suffer, from food and nutrition insecurity in, India, the worst affected groups are, landless people with little or no land to, depend upon, traditional artisans,, providers of traditional services, petty selfemployed workers and destitutes, including beggars. In the urban areas, the, food insecure families are those whose, working members are generally employed, in ill-paid occupations and casual labour, market. These workers are largely, 44, , Economics, , engaged in seasonal activities and are paid, very low wages that just ensure bare, survival., Story of Ramu, Ramu works as a casual labourer, in agriculture in Raipur village. His, eldest son Somu who is 10 years old, also works as a ♣ ✁✂ to look after the, cattle of the Sarpanch of the village, Satpal Singh. Somu is employed for, the whole year by the Sarpanch and, is paid a sum of Rs 1,000 for this, work. Ramu has three more sons, and two daughters but they are too, young to work on the field. His wife, Sunhari is also (part time) working, as house cleaner for the livestock,, removing and managing cow dung., She gets ½ litre milk and some, cooked food along with vegetables, for her daily work. Besides she also, works in the field along with her, husband in the busy season and, supplements, his, earnings., Agriculture being a seasonal, activity employs Ramu only during, times of sowing, transplanting and, harvesting. He remains unemployed, for about 4 months during the, period of plant consolidation and, maturing in a year. He looks for, work in other activities. Some times, he gets employment in brick laying, or in construction activities in the, village. By all his efforts, Ramu is, able to earn enough either in cash, or kind for him to buy essentials for, two square meals for his family., However, during the days when he, is unable to get some work, he and, his family really face difficulties and, sometimes his small kids have to, sleep without food. Milk and, vegetables are not a regular part of, meals in the family. Ramu is food, insecure during 4 months when he, remains unemployed because of the, seasonal nature of agriculture work.
Page 47 :
Let’sDiscuss, •, •, •, •, •, •, , Why is agriculture a seasonal activity?, Why is Ramu unemployed for about, four months in a year?, What does Ramu do when he is, unemployed?, Who are supplementing income in, Ramu’s family?, Why does Ramu face difficulty when, he is unable to have work?, When is Ramu food insecure?, Story of Ahmad, Ahmad is a rickshaw puller in, Bangalore. He has shifted from, Jhumri Taliah along with his 3, brothers, 2 sisters and old parents., He stays in a ❥ ✁✂✂✄. The survival of, all members of his family depends on, his daily earnings from pulling, rickshaw. However, he does not have, a secured employment and his, earnings fluctuate every day. During, some days he gets enough earning for, him to save some amount after buying, all his day-to-day necessities. On, other days, he barely earns enough, to buy his daily necessities. However,, fortunately, Ahmad has a yellow card,, which is PDS Card for below poverty, line people. With this card, Ahmad, gets sufficient quantity of wheat, rice,, sugar and kerosene oil for his daily, use. He gets these essentials at half, of the market price. He purchases his, monthly stock during a particular day, when the ration shop is opened for, below poverty people. In this way,, Ahmad is able to eke out his survival, with less than sufficient earnings for, his big family where he is the only, earning member., , Let’sDiscuss, •, •, , Does Ahmad have a regular income, from rickshaw-pulling?, How does the yellow card help Ahmad, , run his family even with small, earnings from rickshaw-pulling?, The social composition along with the, inability to buy food also plays a role in, food insecurity. The SCs, STs and some, sections of the OBCs (lower castes among, them) who have either poor land-base or, very low land productivity are prone to, food insecurity. The people affected by, natural disasters, who have to migrate to, other areas in search of work, are also, among the most food insecure people. A, high incidence of malnutrition prevails, among women. This is a matter of serious, concern as it puts even the unborn baby, at the risk of malnutrition. A large, proportion of pregnant and nursing, mothers and children under the age of 5, years constitute an important segment of, the food insecure population., According to the National Health and, Family Survey (NHFS) 1998–99, the, number of such women and children is, approximately 11 crore., , The food insecure people are, disproportionately large in some regions, of the country, such as economically, backward states with high incidence of, poverty, tribal and remote areas, regions, more prone to natural disasters etc. In, fact, the states of Uttar Pradesh (eastern, and south-easter n parts), Bihar,, Jharkhand, Orissa, West Bengal,, Chattisgarh, parts of Madhya Pradesh and, Maharasthra account for largest number, of food insecure people in the country., Hunger is another aspect indicating, food insecurity. Hunger is not just an, expression of poverty, it brings about, poverty. The attainment of food security, therefore involves eliminating current, hunger and reducing the risks of future, hunger. Hunger has chronic and seasonal, dimensions. Chronic hunger is a, consequence of diets persistently, inadequate in terms of quantity and/or, Food Security in India, , 45
Page 48 :
quality. Poor people suffer from chronic, hunger because of their very low income, and in turn inability to buy food even for, survival. Seasonal hunger is related to, cycles of food growing and harvesting. This, is prevalent in rural areas because of the, seasonal nature of agricultural activities, and in urban areas because of the casual, labour, e.g., there is less work for casual, construction labour during the rainy, season. This type of hunger exists when, a person is unable to get work for the, entire year., Table 4.2: Percentage of Households with, ‘Hunger’ in India, Type of hunger, Seasonal, , Chronic, , Total, , 1983, , 16.2, , 2.3, , 18.5, , 1993–94, 1999–2000, , 4.2, 2.6, , 0.9, 0.7, , 5.1, 3.3, , Year, , ❘ ✁✂✄, , ❯✁☎✂✆, 1983, , 5.6, , 0.8, , 6.4, , 1993–94, 1999–2000, , 1.1, 0.6, , 0.5, 0.3, , 1.6, 0.9, , ❙✝✞✟✠✡: Sagar (2004), , Picture 4.3, , ✥ ☛✂✁☞✌✁ ☛✁✍☞ ✎ ✆✏✂☎ ✑✒✂✆✓✔✆✕ ✔✆, ✂ ☛✔✌✄✓ ✍☛ ✍✆✌ ✍☛ ✒❛✌ ✖✔✕❛ ✗✔✌✄✓✔✆✕, ❱✂✁✔✌✒✔✌✑ ✍☛ ✘❛✌✂✒ ✍✆ ✘❛✔✙❛ ✒❛✌, ●✁✌✌✆ ❘✌✚✍✄ ✒✔✍✆ ✔✑ ☎✂✑✌✓✛, , special, stamp, entitled, ‘Wheat, Revolution’ in July 1968. The success, of wheat was later replicated in rice. The, increase in foodgrains was, however,, disproportionate. The highest rate of, growth was achieved in Punjab and, Haryana, where foodgrain production, jumped from 7.23 million tonnes in, 1964–65 to reach an all-time high of, 30.33 million tonnes in 1995–96., Production in Maharashtra, Madhya, Pradesh, Bihar, Orissa and the, northeastern states continued to, stagger. T amil Nadu and Andhra, Pradesh, on the other hand, recorded, significant increases in rice yield., , Suggested Activity, The percentage of seasonal as well as, chronic hunger has declined in India as, shown in the above table., India is aiming at Self-sufficiency in, Foodgrains since Independence., After independence, Indian policy, makers adopted all measures to achieve, self-sufficiency in food grains. India, adopted a new strategy in agriculture,, which resulted in the ‘ G r e e n, Revolution’ especially in the production, of wheat and rice., Indira Gandhi, the then Prime, Minister of India, officially recorded the, impressive strides of the Green, revolution in agriculture by releasing a, 46, , Economics, , Visit some farms in a nearby village and, collect the details of food crops cultivated, by the farmers., Food Security in India, Since the advent of the Green revolution, in the early-’70s, the country has avoided, famine even during adverse weather, conditions., India has become self-sufficient in, foodgrains during the last thirty years, because of a variety of crops grown all, over the country. The availability of, foodgrains (even in adverse weather, conditions or otherwise) at the country, level has further been ensured with a
Page 49 :
Graph 4.1: Production of Foodgrains in India, (Million Tonnes), , ✷ ✁, ✷✁✁, ✶ ✁, ✶✁✁, ✁, ✁, , ✶✂✄✁☎✄✶ ✶✂✆✁☎✆✶ ✶✂✝✁☎✝✶ ✶✂✂✁☎✂✶ ✷✁✁✁☎✁✶ ✷✁✁✶☎✁✷ ✷✁✁✷☎✁✞ ✷✁✁✞☎✁✟, , ❙✠✡☛☞✌: Economic Survey 2004–05., , Let’sDiscuss, Study the Graph 4.1 and answer the, following questions:, (a) In which year did our country cross, the 200 million tonnes per year mark, in foodgrain production?, (b) In which decade did India experience, the highest decadal increase in, foodgrain production?, (c) Is production increase consistent in, India since 2000–01?, carefully designed food security system, by the government. This system has two, components: (a) buffer stock and (b) public, distribution system., What is Buffer stock?, Buffer Stock is the stock of foodgrains,, namely wheat and rice procured by the, government through Food Corporation, of India (FCI). The FCI purchases wheat, and rice from the farmers in states, where there is surplus production. The, farmers are paid a pre-announced price, for their crops. This price is called, Minimum Support Price. The MSP is, declared by the government every year, , before the sowing season to provide, incentives to the farmers for raising the, production of these crops. The purchased, foodgrains are stored in granaries. Do, you know why this buffer stock is created, by the government? This is done to, distribute foodgrains in the deficit areas, and among the poorer strata of society, at a price lower than the market price, also known as Issue Price. This also, helps resolve the problem of shortage of, food during adverse weather conditions, or during the periods of calamity., What is the Public Distribution, System?, The food procured by the FCI is, distributed, through, government, regulated ration shops among the poorer, section of the society. This is called the, public distribution system (PDS). Ration, shops are now present in most localities,, villages, towns and cities. There are, about 4.6 lakh ration shops all over the, country. Ration shops also known as Fair, Price Shops keep stock of foodgrains,, sugar, kerosene oil for cooking. These, items are sold to people at a price lower, than the market price. Any family with, Food Security in India, , 47
Page 50 :
a ration card* can buy a stipulated amount, of these items (e.g. 35 kg of grains, 5 litres, of kerosene, 5 kgs of sugar etc.) every, month from the nearby ration shop., *There are three kinds of ration cards:, (a) Antyodaya cards for the poorest of, the poor; (b) BPL cards for those below, poverty line; and (c) APL cards for all, others., , Suggested Activity, Visit your area’s ration shop and get the, following details, 1. When does the ration shop open?, 2. What are the items sold at the ration, shop?, 3. Compare the prices of rice and sugar, from the ration shop with the prices, at any other grocery shop? (for families, below poverty line), 4. Find out:, Do you have a ration card?, What has your family recently bought, with this card from the ration shop?, Are there any problems that they face?, Why are ration shops necessary?, , The introduction of Rationing in India, dates back to the 1940s against the, backdrop of the Bengal famine. The, rationing system was revived in the wake, of an acute food shortage during the, 1960s, prior to the Green Revolution. In, the wake of the high incidence of poverty, levels, as reported by the NSSO in the, mid-1970s, three important food, intervention, programmes, were, introduced: Public Distribution System, (PDS) for food grains (in existence earlier, but strengthened thereafter); Integrated, Child Development Services (ICDS), (introduced in 1975 on an experimental, basis) and Food-for -Work** (FFW), (introduced in 1977–78). Over the years,, several new programmes have been, launched and some have been, restructured with the growing experience, of administering the programmes. At, present, there are several Poverty, Alleviation Programmes (PAPs), mostly in, rural areas, which have an explicit food, component also. While some of the, programmes such as PDS, mid-day meals, etc. are exclusively food security, programmes, most of the PAPs also, enhance food security. Employment, programmes greatly contribute to food, security by increasing the income of, the poor., , Suggested Activity, , P ✁✂✄☎✆ ✝✞✝, , 48, , Economics, , Gather detailed information about some, of the programmes initiated by the, government, which have food component., Hint: Rural wage employment, programme, Employment Guarantee, Scheme, Sampurna Grameen Rojgar, Yojana, Mid Day Meal, Integrated Child, Development Services, etc., Discuss with your teacher.
Page 51 :
**National Food for, Work Programme, National Food for Work Programme, was launched on November 14, 2004, in 150 most backward districts of the, country with the objective of, intensifying the generation of, supplementary wage employment. The, programme is open to all rural poor, who are in need of wage employment, and desire to do manual unskilled, work. It is implemented as a 100 per, cent centrally sponsored scheme and, the foodgrains are provided to States, free of cost. The Collector is the nodal, officer at the district level and has the, overall responsibility of planning,, implementation, coordination, monitoring, and supervision. For 2004–05, Rs 2,020, crore have been allocated for the, programme in addition to 20 lakh, tonnes of foodgrains., , Current Status of Public Distribution, System, Public Distribution System (PDS) is the, most important step taken by the, Government of India (GoI) towards, ensuring food security. In the beginning, the coverage of PDS was universal with, no discrimination between the poor and, non-poor. Over the years, the policy related, to PDS has been revised to make it more, efficient and targeted. In 1992, Revamped, Public Distribution System (RPDS) was, introducted in 1,700 blocks in the country., The target was to provide the benefits of, PDS to remote and backward areas. From, June 1997, in a renewed attempt, Targeted, Public Distribution System (TPDS) was, introducted to adpot the principle of, targeting the ‘poor in all areas’. It was for, the first time that a differential price policy, was adopted for poor and non-poor., Further, in 2000, two special schemes, were launched ✈✆✝ ., Antyodaya Anna, Yojana*** (AAY) and the Annapur na, Scheme (APS) with special target groups, , Table 4.3: Some Important Features of PDS, Name of, scheme, PDS, , Year of, Introduction, Up to 1992, , Coverage target, group, Universal, , Latest volume, , Issue price, (Rs per kg.), , –, , W-2.34, R-2.89, , RPDS, , 1992, , Backward blocks, , 20 kg of, food grains, , W-2.80, R-3.77, , TPDS, , 1997, , Poor and non-poor, , 35 kg of, food grains, , BPL – W-2.50, R-3.50, APL-W-4.50, R-7.00, , AAY, , 2000, , Poorest of the poor, , 35 kg of, food grains, , W-2.00, R-3.00, , APS, , 2000, , Indigent senior, citizens, , 10 kg of, food grains, , Free, , Note: W - Wheat; R - Rice; BPL - Below poverty line; APL - Above poverty line, ❙ ✁✂✄☎: Economic Survey, Food Security in India, , 49
Page 52 :
of ‘poorest of the poor’ and ‘indigent senior, citizens’, respectively. The functioning of, these two schemes was linked with the, existing network of the PDS., Some important features of PDS are, summarised in Table 4.3., The PDS has proved to be the most, effective instrument of government policy, over the years in stabilising prices and, making food available to consumers at, affordable prices. It has been instrumental, in averting widespread hunger and famine, by supplying food from surplus regions of, the country to the deficit ones. In addition,, the prices have been under revision in, favour of poor households in general. The, system, including the minimum support, price and procurement has contributed, to an increase in food grain production, and provided income security to farmers, in certain regions., However, the Public Distribution, System has faced severe criticism on, several grounds. Instances of hunger are, prevalent despite overflowing granaries., FCI go-downs are overflowing with grains,, Graph 4.2:, , ✼✵, ✻✵, , with some rotting away and some being, eaten by rats. The Graph 4.2 shows the, rising stocks of foodgrains till 2002., ***Antyodaya Anna Yojana (AAY), AAY was launched in December 2000., Under the scheme one crore of the, poorest among the BPL families, covered under the targeted public, distribution system were identified., Poor families were identified by the, respective state rural development, departments through a Below Poverty, Line (BPL) survey. Twenty five, kilograms of foodgrains were made, available to each eligible family at a, highly subsidised + rate of Rs 2 per, kg for wheat and Rs 3 per kg for rice., This quantity has been enhanced, from 25 to 35 kgs with effect from, April 2002. The scheme has been, further expanded twice by additional, 50 lakh BPL families in June 2003, and in August 2004. With this, increase, 2 crore families have been, covered under the AAY., , Central Foodgrains (Wheat + Rice) Stock and Minimum, Buffer Norm (Million Tonnes), , ✻✶✓✼, , ✻✸, , ❆✌✍✟✎✏ ✑✍☞✌✒, ❇✟✠✠❢✡ ☛☞✡♠, , ✺✵, ✸✺✓✷, , ✹✵, ✸✵, ✷✵ ✷✹✓✸, , ✷✹✓✸, , ✷✹✓✸, , ✷✔✓✔, ✷✹✓✸, , ✶✻✓✕, , ✶✵, ✵, ❏✆✝✞✵✶, , ❏✆✝✞✵✷, , ❙ ✁✂✄☎: Economic survey 2004–05., 50, , ✷✶✓✼, , Economics, , ❏✆✝✞✵✸, , ❏✆✝✞✵✹
Page 53 :
✰, , ❙✙ ✚✛✜✢ ✣, , ✜✛, , ✤, , ✦✤ ✣✧★ ✩✪, , ✪ ✫✤ ✪, , ✤, , ❣✬✭★✮ ✩✧★✩✪ ✧✤♥★✛ ✪✬ ✤ ✦✮✬✢✙♦★✮ ✪✬, ✛✙ ✦ ✦s★ ✧★ ✩✪ ✪✫ ★ ✧✤✮ ♥★✪ ✦✮✜♦★ ✬ ✯ ✤, ♦✬ ✧ ✧✬✢✜✪ ✣❝, , ❙✙ ✚✛ ✜✢ ✜★✛, , ♦✤ ✩, , ♥★★ ✦, , ♦✬✩✛✙✧★✮ ✦✮✜♦★✛ s✬✱ ✱✫✜s★ ✧✤✜✩✪✤✜✩✜✩❣, ✤ ✫✜❣✫★✮ ✜✩♦✬✧★ ✯✬✮ ✢✬✧★✛✪✜♦ ✦✮✬✢✙♦★✮✛❝, , Let’sDiscuss, Study the Graph 4.2 and answer the, following questions:, • In which recent year foodgrain stock, with the government was maximum?, • What is the minimum buffer stock, norm for the FCI?, • Why were the FCI granaries, overflowing with foodgrains?, In July 2002, the stock of wheat and, rice with FCI was 63 million tonnes, which was much more than the, minimum buffer norms of 24.3 million, tonnes. The stock eased after 2002–03, due to relief opertations undertaken by, the goverment as the year was declared, as drought year due to failure of, monsoon. The decline in stocks, continued in the subsequent years., However, these remained consistently, higher than the buffer norms. The, situation improved with the distribution, of foodgrains under different schemes, launched by the government. There is, a general consensus that high level of, buffer stocks of foodgrains is very, undesirable and can be wasteful. The, storage of massive food stocks has been, responsible for high carrying costs, in, addition to wastage and deterioration, in grain quality. Freezing of MSP for a, few years should be considered, seriously., The, increased, food, grains, #, procurement at enhanced MSP is the, result of the pressure exerted by leading, , ✥ ✁✂✄☎✆ ✝✞✟, , ❋✠✡☛☞✡✌ ✍✠✡✡✎✏✑✒ ✓✠✒✌ ✔✕ ✖✡✠✏✑✌, t✔ t✗☞ ✖✡✠✑✠✡✏☞✌✘, , foodgrain producing states, such as, Punjab, Haryana and Andhra Pradesh., Mor eover, as the pr ocur ement is, concentrated in a few prosperous, r egions (Punjab, Haryana, Wester n, Uttar Pradesh, Andhra Pradesh and to, a lesser extent in West Bengal) and, mainly of two crops— wheat and rice—, increase in MSP has induced farmers,, particularly in surplus states, to divert, land from production of coarse grains,, which is the staple food of the poor, to, the production of rice and wheat. The, intensive utilisation of water in the, cultivation of rice has also led to, environmental degradation and fall in, the water level, threatening the, sustainability of the agricultural, development in these states., #, , The rising Minimum Support Prices, (MSP) have raised the maintenance, cost of procuring foodgrains by the, government. Rising transportation, and storage costs of the FCI are other, contributing factors in this increase., Food Security in India, , 51
Page 54 :
Another major area of concern is the, marked ineffectiveness of PDS, which is, apparent from the fact that the average, consumption of PDS grain at the all-India, level is only 1 kg per person per month., The average consumption figure is as low, as less than 300 gm per person per month, in the states of Bihar, Orissa and Uttar, Pradesh. In contrast, the average, consumption in most of the southern, states like Kerala, Karnataka, Tamil Nadu, and Himachal Pradesh is in the range of, 3–4 kgs per person per month. As a result, the poor have to depend on markets rather, than the ration shops for their food needs., In Madhya Pradesh only 5% of wheat and, rice consumption of the poor are met, through the ration shops. In Uttar Pradesh, and Bihar the percentage is still lower., PDS dealers are sometimes found, resorting to malpractices like diverting, the grains to open market to get better, margin, selling poor quality grains at, ration shops, irregular opening of the, shops, etc. It is common to find that ration, shops regularly have unsold stocks of poor, quality grains left. This has proved to be, a big problem. When ration shops are, unable to sell, a massive stock of, foodgrains piles up with the FCI. In recent, years, there is another factor that has, led to the decline of the PDS. Earlier every, family, poor and non-poor had a ration, card with a fixed quota of items such as, rice, wheat, sugar etc. These were sold at, the same low price to every family. The, three types of cards and the range of, prices that you see today did not exist. A, large number of families could buy, foodgrains from the ration shops subject, to a fixed quota. These included low, income families whose incomes were, marginally higher than the below poverty, line families. Now, with TPDS of three, 52, , Economics, , different prices, any family above the, poverty line gets very little discount at, the ration shop. The price for APL family, is almost as high as open market price,, so there is little incentive for them to buy, these items from the ration shop., , Role of cooperatives in food security, The cooperatives are also playing an, important role in food security in India, especially in the southern and western, parts of the country. The cooperative, societies set up shops to sell low priced, goods to poor people. For example, out, of all fair price shops running in Tamil, Nadu, around 94 per cent are being run, by the cooperatives. In Delhi, Mother, Dairy is making strides in provision of, milk and vegetables to the consumers, at, controlled, rate, decided, by, Government of Delhi. Amul is another, success story of cooperatives in milk, and milk products from Gujarat. It has, brought about the White Revolution in, the country. These are a few examples, of many more cooperatives running in, different parts of the country ensuring, food security of different sections, of society., Similarly,, in, Maharashtra,, Academy of Development Science (ADS), has facilitated a network of NGOs for, setting up grain banks in different, regions. ADS organises training and, capacity building programmes on food, security for NGOs. Grain Banks are now, slowly taking shape in different parts of, Maharashtra. ADS efforts to set up, Grain Banks, to facilitate replication, through other NGOs and to influence the, Government’s policy on food security are, thus paying rich dividends. The ADS, Grain Bank programme is acknowledged, as a successful and innovative food, security intervention.
Page 55 :
Summary, Food security of a nation is ensured if all of its citizens have enough nutritious food, available, all persons have the capacity to buy food of acceptable quality and there, is no barrier on access to food. The people living below the poverty line might be food, insecure all the time while better off people might also turn food insecure due to, calamity or disaster. Although a large section of people suffer from food and nutrition, insecurity in India, the worst affected groups are landless or land poor households, in rural areas and people employed in ill paid occupations and casual labourers, engaged in seasonal activities in the urban areas. The food insecure people are, disproportionately large in some regions of the country, such as economically, backward states with high incidence of poverty, tribal and remote areas, regions, more prone to natural disasters etc. To ensure availability of food to all sections of, the society the Indian government carefully designed food security system, which is, composed of two components: (a) buffer stock and (b) public distribution system. In, addition to PDS, various poverty alleviation programmes were also started which, comprised a component of food security. Some of these programmes are: Integrated, Child Development Services (ICDS); Food-for-Work (FFW); Mid-Day Meals; Antyodaya, Anna Yojana (AAY) etc. In addition to the role of the government in ensuring food, security, there are various cooperatives and NGOs also working intensively towards, this direction., , Exercises, 1. How is food security ensured in India?, 2. Which are the people more prone to food insecurity?, 3. Which states are more food insecure in India?, 4. Do you believe that green revolution has made India self-sufficient in food, grains? How?, 5. A section of people in India are still without food. Explain?, 6. What happens to the supply of food when there is a disaster or a calamity?, 7. Differentiate between seasonal hunger and chronic hunger?, 8. What has our government done to provide food security to the poor? Discuss, any two schemes launched by the government?, 9. Why is a buffer stock created by the government?, 10. Write notes on:, (a) Minimum support price, (b) Buffer stock, (c) Issue price, (d) Fair price shops, 11. What are the problems of the functioning of ration shops?, 12. Write a note on the role of cooperatives in providing food and related items., , Food Security in India, , 53
Page 56 :
References, , ❚♦ ✁✂❞✄ ✁ ☎♦♦❞, ❙✆✝✞✂✆ ✟✠❞✡✁☛ ✟✄✄✞✆✄ ✁✠❞ ☞♦✌✡✝✡✆✄, ,V, . 2004. “☎♦♦❞ ❙✆✝✞✂✡❋✍ ✡✠ ✟✠❞✡✁”, Paper presented in ADRF-IFRI Final, , DEV, S. MAHENDRA, KANNAN, K.P. AND RAMCHANDRAN, NEERA (EdS.). 2003., ; Institute for Human Development, New Delhi., SAGAR IDYA, Meeting on Food Security in India, September 10–11, New Delhi., , ❙✍✠✆✂✎✡✄✡✠✎✏♦✑✆✂✠✒✆✠❋✓✔✔♦✂❋✄ ✔♦✂ ☎♦♦❞❙✆✝✞✂✡❋✍, , SAXENA, N.C. 2004. “, ” in Swaminathan,, M.S. and Medrano, Pedro (Eds.), Towards Hunger Free India, East-West Books,, Chennai., , ❘✆♦✂✎✁✠✡✄✡✠✎ ☞♦✌✡✝✡✆✄ ✁✠❞ ✕✆✌✡✑✆✂✍ ✔♦✂ ✖✌✌✆✑✡✁❋✡✠✎ ✗✞✠✎✆✂ ✁✠❞, , SAXENA, N.C. 2004. “, ” Paper presented at National Food Security Summit, New Delhi., , ▼✁✌✠✞❋✂✡❋✡♦✠, , SEN, A.K. 1983. “Poverty and Famines: An Essay on Entitlement and Deprivation”., Oxford University Press., , ▼✡✝✂♦✠✞❋✂✡✆✠❋ ✕✆✔✡✝✡✆✠✝✡✆✄ ✡✠ ❘✞✂✁✌ ✕✡✆❋✄, , SHARMA, REKHA AND MEENAKSHI, J.V. 2004. “, ”., Towards Hunger Free India: From Vision to Action. Proceedings of Consultation, on “Towards Hunger-free India: Count Down from 2007”. New Delhi., FAO 1996. World Food Summit 1995. Food and Agricultural Organisation, Rome., Government of India. Economic Survey. 2002–03, 2003–04, 2004–05. Ministry of, Finance. New Delhi., IIPS 2000. National Health and Family Survey – 2. International Institute of, Population Sciences. Mumbai., UN 1975. Report of the World Food Conference 1975. (Rome), United Nations, New, York., , 54, , Economics
 Learn better on this topic