Notes of Plus One Humanities 2021, Economics Unit 4 Statistics - Study Material
Page 1 :
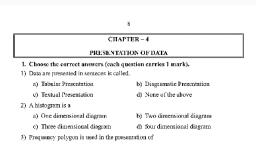
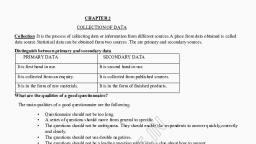
CHAPTER 4, PRESENTATION OF DATA, PRESENTATION: It is the process of presenting voluminous data collected through different Statistical tools., There are generally three forms of presentation of data. They are, 1. Textual presentation, 2. Tabular presentation, 3. Diagrammatic or Graphical presentation., TEXTUAL PRESENTATION OF DATA: In textual presentation,data are described within the text.When the, quantity of data is not too large this form of presentation is most suitable., TABULAR PRESENTATION: In tabular presentation , data are presented in rows and columns. The most, important advantage of tabular presentation is that is used for further Statistical calculations and decision, making., PARTS OF A TABLE: There are eight functional parts of a Statistical table. They are the following., 1., 2., 3., 4., 5., 6., 7., 8., , Table Number: It is assigned on the top of a table. It assigned for easy identification., Title: It narrates about the content of the table., Captions OR Column headings: At the top of each column in a table a designation is given.it is caption., Stubs OR Row headings: The designation of a row is called stubs., Body of the table: It is the main part of a table. It contains the actual data., Unit of measurement:It shows the unit which is used to measure the figures in the table., Source: It contains the source of the data presented in the table., Note: It gives additional information about the table., , DIAGRAMMATIC PRESENTATION OF DATA. This is the third way of presentation. It provides the, quickest understanding of actual situation. Diagrams maybe less accurate but are much more effective than, tables in presenting the data. There are various kinds of diagrams.Amongst them the important ones are the, following ., 1. Geometric diagrams, 2. Frequency diagrams 3. Arithmetic line graph., GEOMETRIC DIAGRAMS: Simple bar diagrams ,Multiple bar diagrams,Component bar diagrams,, percentage bar diagrams,pie diagrams are come under this category., 1. SIMPLE BAR DIAGRAM: It comprises a group of equispaced and equiwidth rectangular bars for, each class of data. Height of the bar reads the magnitude of data., 2. MULTIPLE BAR DIAGRAM: Multiple bar diagrams are used for comparing two or more sets of, variable., 3. COMPONENT BAT DIAGRAM: It is also called sub- divided bar diagram.It is very useful in, comparing the sizes of different parts of data., 4. PIE DIAGRAM: It is a circle whose area is proportionally divided among the components it, represents.It is also called pie chart., FREQUENCY DIAGRAMS: Data in the form of grouped frequency distributions are generally represented by, frequency diagrams. The following are the most commonly used frequency diagrams.
Page 2 :
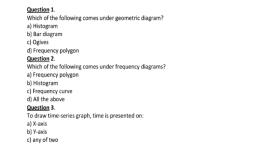
•, •, , •, •, , HISTOGRAM: If is a two dimensional diagram. It represents a continuous frequency distribution. It, can helpful in locating mode, OGIVES OR CUMULATIVE FREQUENCY CURVE: Ass there are two types of cumulative, frequencies .They are less than and more than cumulative frequencies. An interesting feature of the two, ogives together is that their intersection point gives the median., FREQUENCY POLYGON: It is a plane bounded straight lines ,usually four or more lines.lt can be, construct with or without constructing of a histogram., FREQUENCY CURVE The frequency curve is obtained by drawing a smooth free hand curve passing, through the points of the frequency polygon as close as possible., , ARITHMETIC LINE GRAPH OR TIME SERIES GRAPH: It helps in understanding the, trend,periodicity, etc. in a long time series data., PREVIOUS QUESTIONS:, , •, •, •, , 1. Data represented through a histogram can help in finding graphically the ................, Mode, 2. Ogives can be helpful in locating graphically the………….., Median, 3. What kind of diagrams are more effective in representing the following?, Monthly rainfall in a year. --------- simple bar diagram., Composition of population of Delhi by religion--------Component bar diagram, Components of cost in a factory --------------- Pie diagram., 4. Distinguish between bar diagram and histogram, BAR DIAGRAMS, HISTOGRAM, Width are same, Width may be differ, Space is left between adjacent bars, No space is left, Drawn for discrete and continuous variables, Drawn for continuous variables only, Not help to determine any average, Help to determine mode, 5. Write another name for component bar diagram ---Sub divided bar diagram., 6. While explaining the parts of a table, your teacher says ,” It narrates the content of the table.It has to, be very clear and brief.” Identify the part of table mentioned here.---------Body of the tab, , PREPARED BY, RAJESH.S, K.T.C.T.E.M.H.S.S KADUVAYIL, THIRUVANANTHAPURAM
Page 3 :
7. Some particulars from a class time table are given below.By using them, fill the columns in the table, correctly., CLASS TIME TABLE, Days, PERIODS, 1, Wednesday ECONOMICS, , 1, 2, 3, 4, 5, , Title, Caption, Stub, Body, Note, , 2, 3, 4, 5, MALAYALAM HISTORY ENGLISH MATH, , 6, HISTORY, , Class time table, Periods, Days, Subjects, Nil, , PREPARED BY, RAJESH.S, K.T.C.T.E.M.H.S.S KADUVAYIL, THIRUVANANTHAPURAM
 Learn better on this topic