Notes of Combined 2nd PU, Stats II PU Statistics MQP-2022 - Study Material
Page 1 :
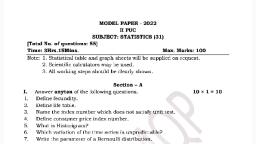
Karnataka State Statistics Forum, II PUC Statistics Model Question Paper-5, 2021-22, Time - 3 Hrs. 15 Minutes Max. Marks -100, Note:, , 1, Statistical tables and graphs sheets will be supplied on request., , 2. Scientific calculator may be used., , 3. All working steps should be clearly shown., , Section - A, , , Answer any TEN of the following questions: 10x1=10, , Define Fecundity., , What is Longevity?, , Why index numbers are known as ‘economic barometer’?, , Define consumer price index number., , What is historigram?, , What is the duration of seasonal variation?, , What are the values of p and q of Bernoulli distribution, if an unbiased coin is tossed, once?, , 8. IfZisaSNV, then name the distribution of Z2, , 9. Inanormal distribution, given P (- 0.8 < Z < 0.8) = 0.5762. Find P (0 < Z< 0.8)., 10. Define sample space?, , 11. Define statistical hypothesis?, , 12. When is the pooling of frequency done in chi-square test for goodness of fit?, 13. What is a control chart?, , 14, In LPP define solution., , 15. Define ‘strategy’ in a game., , Nauhonr, , Section -B, , I. Answer any TEN of the following questions: 10x2=20, , 16. Write any two differences between CDR and STDR., 17. In a locality 10,000 live births occurred. The number of neo-natal deaths was 450. Find, neo-natal mortality rate., 18. State two norms (conditions) for the selection of base year., 19. If price relative is 140 and the price of a commodity in the base year is Rs. 60, then find, the price in the current year., 20. Write any two uses of time series., 21.Given, Po = 110 and PPB, = 106.96, find PXo1., 22. Given a second-degree trend equation Y=25-0.75X+2X?, Estimate the value of Y,, when X = 3., 23. Write two assumptions of interpolation and Extrapolation., 24. Ifn = 4 for student’s t-distribution, find S.D., 25. The two parameters of a normal distribution are y=10 and o=5. Find the points of, inflexion of the curve., 26. If P= 0.1 and n= 100, then find S.E(p)., 27. Define type I and type II errors., 28. If ¥ = 40, R=2.5 and A= 0.577, find lower control limit of X - chart., , Karnataka State Statistics Forum 1, , Scanned with CamScanner
Page 2 :
29. What are degenerate and non-degenerate solutions in T.P?, 30. Mention two needs for replacement of equipment., Section - C, , Il. Answer any EIGHT of the following questions: 8x5=40, , 31. Calculate CBR and GFR for the following data, , , , , , , , , , , , , , , , , , , , , , Age-group Male Female Births, , (Years) Population | Population, 0-14 4500 4000 0, , 15-19 3500 3000 50, 20-24 2000 2500 400, 25-29 2100 2200 300, 30-34 1800 2000 100, 35-39 2000 1800 60, 40-44 1200 1500 30, 45-49 1000 1200 10, , 50 & above 1500 1800 0, , , , , , , , , , , , 32. For the following data calculate NRR. Comment on the result., , , , , , , , , , , , , , , , , , Age-group Female Female Survival, , (in years) Population births ratio, 15-19 8,000 240 0.90, 20-24 9,000 450 0.88, 25-29 10,000 600 0.85, 30-34 9,000 360 0.84, 35-39 8,000 160 0.82, 40-44 7,000 70 0.80, 45-49 6,000 30 0.80, , , , , , , , , , , , , , 33. What are the steps involved in the construction of index number? Explain any two, of them., , 34. Calculate Poi by simple average of price relative method using AM from the, following data., Items A |B Cc D E, Price in 2014 | 120 | 40 | 100 | 100 | 300, Price in 2016 | 220 | 80 | 300 | 200 | 500, , 35. Compute three yearly moving averages for the following data., , Year 1990 | 1991 | 1992 | 1993 | 1994 | 1995 | 1996 | 1997 | 1998 | 1999, Sales (‘000) | 112 | 123 | 106 | 134 | 138 | 145 | 116 | 113 | 140 | 118, , , , , , , , , , , , , , , , , , , , , , , , , , , , , , , , , , , , , , , , , , , , , , , , , , , , , , 36. For the following time series fit a linear trend line by the method of least squares., , Year 2005 | 2006 | 2007 | 2008 | 2009 | 2010, No. vehicles (000) |_10 30 32 36 52 60, , , , , , , , , , , , , , , , , , , , , , , , Karnataka State Statistics Forum 2, , Scanned with CamScanner
Page 3 :
37., , 38., , 39., , 40., , 41., , 42., , 43., , 44,, , Interpolate the business in 2014 and extrapolate for the year 2016 from the, following data., , , , Years 2010 | 2011 | 2012 | 2013 | 2014 | 2015 | 2016, , , , , , , , , , , , , , , , , , , , , , Business (in lakhs) | 80 | 150 | 235 | 365 - 780 fs, , , , The probability of a thermometer manufactured by a firm found to be defective is, 0.02. Find the probability that a box containing 50 thermometers contain no, defective ones. Among 100 such boxes, how many contains exactly 2 defective, thermometers?, , A box contains 8 red and 4 white balls. From this box 5 balls are drawn at, random. What is the probability that the sample contains 3 red balls? Also find, the mean number of red balls., , A machine is designed to fill 1 liter milk to polythene bags. A randomly selected, 100 milk bags filled by this machine are inspected. The mean milk is found to be, 998 ml and SD is 10 ml. Is machine functioning properly at 1% level of, significance?, , , , , , , , , , , , , , , , , , , , , , , , , , , , , , , , , , , , , , , , , , , , , , , , , , , , , , , , Intelligence test given to groups of boys and girls gave the following information:, Mean $.D Size, Boys 70 12 12, Girls 74 10 7, Is the difference in the means scores of boys and girls are statistically significant?, (Use a = 0.05)., To test the effect of inoculation against Cholera the following table was obtained:, Attacked | Not attacked, Inoculated 16 32, Not inoculated 08 24, Test at 5% LOS whether inoculation and attack of Cholera are independent., Calculate the control limits for R-chart for the following data given n=5., Sample number | 1/2|/3/4/5]/6, Range 3/4/8/5|3]7, Graphically solve the following LPP., Min Z =4X+38Y, S.ts 3X+5Y < 30, 2X-4Y > 8; And xX, Y20, Solve the following game by principle of dominance. Is the game fair?, Player B, B, B, B, B,, A, |-l -2 0 -3, PlayrA A, |4 2 0 5, A,|[-3 1 3 0, Karnataka State Statistics Forum 3, , Scanned with CamScanner
Page 4 :
Section - D, , , , , , , , , , , , , , , , , , , , , , , , , , , , , , , , , , , , , , , , , , , , , , , , , , , , , , , , , , , , , , , , , , , , , , , , , , , , , , , , , , , , , , , , , , , , , , , , , , , , , , , , , , , , , , , , , , IV. Answer any TWO of the following questions: 2x10=20, 46. Compute standardized death rate for the town A and B and state which town is, healthier., Age group TOWN A TOWN B Standard, (in years) | Population | Death | Population | Death population, 0-10 4000 36 3000 30 5000, 10-25 12000 48 20000 100 15000, 25-60 6000 60 4000 48 7000, 60 and above 8000 152 3000 60 9000, 47. For the following data find Laspeyer's, Paasche's and Marshel Edgeworth's price, index numbers., item Base year Current year, Price | Quantity | Price | Quantity, A 10 5 12 4, B 15 8 18 Ge, Cc 6 3 4 5, D 3 4 3 5, 48. Compute Fisher’s price index and show that it satisfies TRT and FRT., 2004 2006, Items — - —— ;, Price (in Rs.) | Quantity | Price (in Rs.) | Quantity, A 8 15 9 15, B 7 12 8 13, Cc 10 10 10 10, D 12 14 15 16, 49. For the following time series fit a trend of the type y= a + bx + cx? by the method, of least squares. Estimate the production for the year 2007., Year 2002 2003 2004 2005 2006, Production 8 10 11 12 14, 50. Five coins are tossed 250 times and the following distribution is obtained, Number oftails [O |1 [2 [3 [4 [5, Number of tosses | 29 | 37 | 45 | 62 | 50 | 27, Fit a Binomial distribution to the data and test the goodness of fit at 1% level of, significance., Section - E, V; Answer any TWO of the following questions: 2x5=10, 51. Heights of PU students is normally distributed with mean 155 cm. and standard, , deviation Scm. Find the, i) Probability that a randomly selected PU student has height more than 155cm., , ii) Percentage of PU students having height between 150 cm and 160 cm., , Karnataka State Statistics Forum 4, , Scanned with CamScanner
Page 5 :
52., , 53., , 54., , 55., , Among 80 randomly selected persons from district A, 36 are interested in, viewing Hockey match. Among 40 randomly selected persons from district B, 12, are interested in viewing Hockey match. Test at 5% level of significance that, the, proportion of viewers in district A is more than district B., , The following are the blood pressure (B.P) of 8 persons before and after, performing Dhyana., , BP before Dhyana | 92 | 90 | 86 | 92 | 88] 94 |90] 90, BP after Dhyana | 86 | 88 | 80 | 86 | 86] 84 | 84] 90, , , , , , , , , , , , , , , , , , , , , , , , , , , , Can we conclude that Dhyana reduces BP? (Use a = 0.01), , The following are the maintenance and depreciation costs per year of a vehicle, whose purchase price is 50,000, , Years 1 2 3 4 5 6 7, Depreciation cost | 18000 | 33000 | 40500 | 44250 | 46000 | 46000 | 46000, , Maintenance cost | 4500 | 5500 | 6500 | 850 | 11000 | 15500 | 17500, Determine the optimal age for replacement of the vehicle., , , , , , , , , , , , , , , , , , , , , , , , , , , , A manufacturing company purchases 8000 parts of a machine as its annual, requirements. Each part costs Rs.15. The ordering cost is Rs.12 per order. The, cost of carrying inventory is 18% per year of the capital cost. Find (i) Economic, , order quantity (ii) Re-order time., sek, , Karnataka State Statistics Forum 5, , Scanned with CamScanner
 Learn better on this topic