Notes of B.Sc.-III(Statistics), Statistical Inference-I 100 Statistical Tests - Study Material
Page 2 :
100 STATISTICAL TESTS
Page 4 :
100, STATISTICAL, TESTS, 3rd Edition, Gopal K. Kanji
Page 5 :
© Gopal K. Kanji 2006, First edition published 1993, reprinted 1993, Reprinted with corrections 1994, Reprinted 1995, 1997, New edition published 1999, Reprinted 2000, 2001, 2003 and 2005, Third edition published 2006, All rights reserved. No part of this publication may be reproduced, stored in a, retrieval system, transmitted or utilized in any form or by any means,, electronic, mechanical, photocopying, recording or otherwise, without, permission in writing from the Publishers., SAGE Publications Ltd, 1 Oliver’s Yard, 55 City Road, London, ECIY ISP, SAGE Publications Inc, 2455 Teller Road, Thousand Oaks, California 91320, SAGE Publications India Pvt Ltd, B-42 Panchsheel Enclave, PO Box 4190, New Delhi 110 017, British Library Cataloguing in Publication Data, A catalogue record for this book is available from the British Library, ISBN-10 1 4129 2375 1, ISBN-10 1 4129 2376 X, , ISBN-13 978 1 4129 2375 0, ISBN-13 978 1 4129 2376 7 (Pbk), , Library of Congress catalog card number 98-61738: 2005910188, Typeset by Newgen Imaging Systems (P) Ltd, Chennai, India., Printed in Great Britain by The Cromwell Press Ltd, Trowbridge, Wiltshire
Page 6 :
CONTENTS, Acknowledgements, , vi, , Preface, , vii, , List of Common Symbols, , viii, , Introduction to the Book, , 1, , Introduction to Statistical Testing, , 2, , Examples of Test Procedures, , 5, , List of Tests, , 14, , Classification of Tests, , 19, , The Tests, , 21, , List of Tables, , 185, , Tables, , 186, , References, , 240, , Index, , 241
Page 7 :
ACKNOWLEDGEMENTS, The author and publishers wish to thank the following for permission to use copyright, material:, The American Statistical Association for Table 16 adapted from Massey. F.J. Jr (1951), ‘The Kolmogorov–Smirnov test for goodness of fit’, Journal of the American Statistical, Association, 4(6). Copyright © 1951 by the American Statistical Association; the, Biometrika Trustees for Table 33 from Durbin, J. and Watson, G.S. (1951) ‘Testing for, serial correlation in least squares regression II’, Biometrika. 38, pp. 173–5; for Table, 36 from Stephens, M.A. (1964) ‘The distribution of the goodness of fit statistic, Un2 II’,, Biometrika, 51, pp. 393–7; for Table 3 from Pearson, E.S. and Hartley, H.O. (1970), Biometrika Tables for Statisticians, Vol. I, Cambridge University Press; for Table 12, from Merrington, M. and Thompson, CM. (1946) ‘Tables for testing the homogeneity of, a set of estimated variances’, Biometrika, 33, pp. 296–304; and for Table 7 from Geary,, R.E. and Pearson, E.S. (n.d.) ‘Tests of normality’; Harcourt Brace Jovanovich Ltd for, Tables 38 and 39 from Mardia, K.V. (1972) Statistics of Directional Data, Academic, Press; and Tables 35, 36 and 37 from Batschelet, E. (1981) Circular Statistics in Biology,, Academic Press; the Institute of Mathematical Statistics for Table 28 from Hart, B.I., (1942) ‘Significance levels for the ratio of the mean square successive difference to, the variance’, Annals of Mathematical Statistics, 13, pp. 445–7; and for Table 29 from, Anderson, R.L. (1942) ‘Distribution of the serial correlation coefficient’, Annals of, Mathematical Statistics, 13, pp. 1–13; Longman Group UK Ltd on behalf of the Literary, Executor of the late Sir Ronald A. Fisher, FRS and Dr Frank Yates FRS for Table 2, from Statistical Tables for Biological, Agricultural and Medical Research (6th edition,, 1974) Table IV; McGraw-Hill, Inc. for Tables 8, 15, 18 and 31 from Dixon, W.J., and Massey, F.J. Jr (1957) Introduction to Statistical Analysis; Macmillan Publishing, Company for Table l(a) from Walpole, R.E. and Myers, R.H. (1989) Probability and, Statistics for Engineers and Scientists, 4th edition, Table A.3. Copyright © 1989 by, Macmillan Publishing Company; Routledge for Tables 4 and 22 from Neave, H.R., (1978) Statistical Tables, Allen & Unwin; Springer-Verlag GmbH & Co. KG for Tables, 9, 10, 14, 19, 23, 26 and 32 from Sachs, L. (1972) Statistiche Auswertungsmethoden,, 3rd edition; TNO Institute of Preventive Health Care, Leiden, for Tables 6, 11, 13, 25,, 27 and 30 from De Jonge, H. (1963–4) Inleiding tot de Medische Statistiek, 2 vols, 3rd, edition, TNO Health Research., Every effort has been made to trace all the copyright holders, but if any have, been inadvertently overlooked the publishers will be pleased to make the necessary, arrangement at the first opportunity.
Page 8 :
PREFACE, Some twenty years ago, it was only necessary to know about a dozen statistical tests, in order to be a practising statistician, and these were all available in the few statistical, textbooks that existed at that time. In recent years the number of tests has grown, tremendously and, while modern books carry the more common tests, it is often quite, difficult for a practising statistician quickly to turn up a reference to some of the less, used but none the less important tests which are now in the literature. Accordingly, we, have attempted to collect together information on most commonly used tests which are, currently available and present it, together with a guide to further reading, to make a, useful reference book for both the applied statistician and the everyday user of statistics., Naturally, any such compilation must omit some tests through oversight, and the author, would be very pleased to hear from any reader about tests which they feel ought to have, been included., The work is divided into several sections. In the first we define a number of terms, used in carrying out statistical tests, we define the thinking behind statistical testing and, indicate how some of the tests can be linked together in an investigation. In the second, section we give examples of test procedures and in the third we provide a list of all the, 100 statistical tests. The fourth section classifies the tests under a variety of headings., This became necessary when we tried to arrange the tests in some logical sequence., Many such logical sequences are available and, to meet the possible needs of the reader,, these cross-reference lists have been provided. The main part of the work describes, most commonly used tests currently available to the working statistician. No attempts, at proof are given, but an elementary knowledge of statistics should be sufficient to, allow the reader to carry out the test. In every case the appropriate formulae are given, and where possible we have used schematic diagrams to preclude any ambiguities, in notation. Where there has been a conflict of notation between existing textbooks,, we have endeavoured to use the most commonly accepted symbols. The next section, provides a list of the statistical tables required for the tests followed by the tables, themselves, and the last section provides references for further information., Because we have brought together material which is spread over a large number, of sources, we feel that this work will provide a handy reference source, not only for, practising statisticians but also for teachers and students of statistics. We feel that no one, can remember details of all the tests described here. We have tried to provide not only, a memory jogger but also a first reference point for anyone coming across a particular, test with which he or she is unfamiliar., Lucidity of style and simplicity of expression have been our twin objectives, and, every effort has been made to avoid errors. Constructive criticism and suggestions will, help us in improving the book.
Page 9 :
COMMON SYMBOLS, Each test or method may have its own terminology and symbols but the following are, commonly used by all statisticians., n, K, , number of observations (sample size), number of samples (each having n elements), , α, v, σ, s, , level of significance, degrees of freedom, standard deviation (population), standard deviation (sample), , µ, x̄, ρ, r, , population mean, sample mean, population correlation coefficient, sample correlation coefficient, , Z, , standard normal deviate
Page 10 :
INTRODUCTION TO THE BOOK, This book presents a collection of statistical tests which can help experimenters and, researchers draw conclusions from a series of observational data. The main part of the, book provides a one/two page summary of each of the most common statistical tests,, complete with details of each test objective, the limitations (or assumptions) involved,, a brief outline of the method, a worked example and the numerical calculation. At the, start of the book there are more, detailed, worked examples of the nine most common, tests. The information provides an ideal “memory jog” for statisticians, practitioners, and other regular users of statistics who are competent statisticians but who need a, sourcebook for precise details of some or all the various tests., 100 Statistical Tests lists 100 different inferential tests used to solve a variety of, statistical problems. Each test is presented in an accurate, succinct format with a, suitable formula. The reader can follow an example using the numerical calculation provided (without the arithmetic steps), refer to the needed table and review the statistical, conclusion., After a first introduction to statistical testing the second section of the book provides, examples of the test procedures which are laid out clearly while the graphical display, of critical regions are presented in a standard way., The third section lists the objective of each of the tests described in the text. The next, section gives a useful classification of the tests presented by the type of the tests:, (a) for linear data: parametric classical tests, parametric tests, distribution free tests,, sequential tests and (b) for circular data: parametric tests. This invaluable table also, gives a concise summary of common statistical problem types and a list of tests which, may be appropriate. The problem types are classified by the number of samples (1, 2, or k samples), whether parametric or non-parametric tests are required, and the area of, interest (e.g. central tendency, distribution function, association)., The pages of the next section are devoted to the description of the 100 tests. Under, each test, the object, limitation and the method of testing are presented followed by an, example and the numerical calculation. The listings of limitations add to the comprehensive picture of each test. The descriptions of the methods are explained clearly. The, examples cited in the tests help the reader grasp a clear understanding of the methods, of testing., The first of the following two sections gives the list of tables while second section, displays 39 statistical tables many of which have accompanying diagrams illustrated in, a standard way. This comprehensive list covers all the commonly used standard tables., The book is concluded with references and index.
Page 11 :
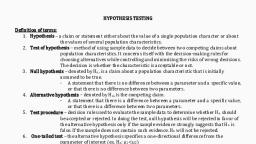
INTRODUCTION TO STATISTICAL TESTING, Having collected together a number of tests, it is necessary to consider what can be, tested, and we include here some very general remarks about the general problem of, hypothesis testing. Students regard this topic as one full of pitfalls for the unwary,, and even teachers and experienced statisticians have been known to misinterpret the, conclusions of their analysis., Broadly speaking there are two basic concepts to grasp before commencing. First, the, tests are designed neither to prove nor to disprove hypotheses. We never set out to prove, anything; our aim is to show that an idea is untenable as it leads to an unsatisfactorily, small probability. Second, the hypothesis we are trying to disprove is always chosen to, be the one in which there is no change; for example, there is no difference between the, two population means, between the two samples, etc. This is why it is usually referred, to as the null hypothesis, H0 . If these concepts were firmly held in mind, we believe, that the subject of hypothesis testing would lose a lot of its mystique. (However, it is, only fair to point out that some hypotheses are not concerned with such matters.), To describe the process of hypothesis testing we feel that we cannot do better than, follow the five-step method introduced by Neave (1976a):, Step 1 Formulate the practical problem in terms of hypotheses. This can be difficult, in some cases. We should first concentrate on what is called the alternative hypothesis,, H1 , since this is the more important from the practical point of view. This should, express the range of situations that we wish the test to be able to diagnose. In this sense,, a positive test can indicate that we should take action of some kind. In fact, a better, name for the alternative hypothesis would be the action hypothesis. Once this is fixed, it should be obvious whether we carry out a one- or two-tailed test., The null hypothesis needs to be very simple and represents the status quo, i.e. there, is no difference between the processes being tested. It is basically a standard or control, with which the evidence pointing to the alternative can be compared., Step 2 Calculate a statistic (T ), a function purely of the data. All good test statistics, should have two properties: (a) they should tend to behave differently when H0 is, true from when H1 is true; and (b) their probability distribution should be calculable, under the assumption that H0 is true. It is also desirable that tables of this probability, distribution should exist., Step 3 Choose a critical region. We must be able to decide on the kind of values, of T which will most strongly point to H1 being true rather than H0 being true. Critical, regions can be of three types: right-sided, so that we reject H0 if the test statistic is, greater than or equal to some (right) critical value; left-sided, so that we reject H0 if, the test statistic is less than or equal to some (left) critical value; both-sided, so that, we reject H0 if the test statistic is either greater than or equal to the right critical value, or less than or equal to the left critical value. A value of T lying in a suitably defined, critical region will lead us to reject H0 in favour of H1 ; if T lies outside the critical, region we do not reject H0 . We should never conclude by accepting H0 ., Step 4 Decide the size of the critical region. This involves specifying how great, a risk we are prepared to run of coming to an incorrect conclusion. We define the, significance level or size of the test, which we denote by α, as the risk we are prepared, to take in rejecting H0 when it is in fact true. We refer to this as an error of the first
Page 12 :
INTRODUCTION TO STATISTICAL TESTING, , 3, , type or a Type I error. We usually set α to between 1 and 10 per cent, depending on the, severity of the consequences of making such an error., We also have to contend with the possibility of not rejecting H0 when it is in fact false, and H1 is true. This is an error of the second type or Type II error, and the probability, of this occurring is denoted by β., Thus in testing any statistical hypothesis, there are four possible situations which, determine whether our decision is correct or in error. These situations are illustrated as, follows:, Situation, , Conclusion, , H0 is not rejected, H0 is rejected, , H0 is true, , H0 is false, , Correct decision, , Type II error, , Type I error, , Correct decision, , Step 5 Many textbooks stop after step 4, but it is instructive to consider just where, in the critical region the calculated value of T lies. If it lies close to the boundary of, the critical region we may say that there is some evidence that H0 should be rejected,, whereas if it is at the other end of the region we would conclude there was considerable evidence. In other words, the actual significance level of T can provide useful, information beyond the fact that T lies in the critical region., In general, the statistical test provides information from which we can judge the, significance of the increase (or decrease) in any result. If our conclusion shows that the, increase is not significant then it will be necessary to confirm that the experiment had, a fair chance of establishing an increase had there been one present to establish., In order to do this we generally turn to the power function of the test, which is usually, computed before the experiment is performed, so that if it is insufficiently powerful, then the design can be changed. The power function is the probability of detecting a, genuine increase underlying the observed increase in the result, plotted as a function of, the genuine increase, and therefore the experimental design must be chosen so that the, probability of detecting the increase is high. Also the choice among several possible, designs should be made in favour of the experiment with the highest power. For a given, experiment testing a specific hypothesis, the power of the test is given by 1 − β., Having discussed the importance of the power function in statistical tests we would, now like to introduce the concept of robustness. The term ‘robust’ was first introduced, in 1953 to denote a statistical procedure which is insensitive to departures from the, assumptions underlying the model on which it is based. Such procedures are in common, use, and several studies of robustness have been carried out in the field of ‘analysis, of variance’. The assumptions usually associated with analysis of variance are that the, errors in the measurements (a) are normally distributed, (b) are statistically independent, and (c) have equal variances., Most of the parametric tests considered in this book have made the assumption that, the populations involved have normal distributions. Therefore a test should only be, carried out when the normality assumption is not violated. It is also a necessary part of
Page 13 :
4, , 100 STATISTICAL TESTS, , the test to check the effect of applying these tests when the assumption of normality is, violated., In parametric tests the probability distribution of the test statistic under the null, hypothesis can only be calculated by an additional assumption on the frequency distribution of the population. If this assumption is not true then the test loses its validity., However, in some cases the deviation of the assumption has only a minor influence on, the statistical test, indicating a robust procedure. A parametric test also offers greater, discrimination than the corresponding distribution-free test., For the non-parametric test no assumption has to be made regarding the frequency, distribution and therefore one can use estimates for the probability that any observation, is greater than a predetermined value., Neave (1976b) points out that it was the second constraint in step 2, namely that the, probability distribution of the test statistic should be calculable, which led to the growth, of the number of non-parametric tests. An inappropriate assumption of normality had, often to be built into the tests. In fact, when comparing two samples, we need only, look at the relative ranking of the sample members. In this way under H0 all the rank, sequences are equally likely to occur, and so it became possible to generate any required, significance level comparatively easily., Two simple tests based on this procedure are the Wald–Wolfowitz number of runs, test and the median test proposed by Mood, but these are both low in power. The, Kolmogorov–Smirnov test has higher power but is more difficult to execute. A test, which is extremely powerful and yet still comparatively easy to use is the Wilcoxon–, Mann–Whitney test. Many others are described in later pages of this book.
Page 16 :
EXAMPLES OF TEST PROCEDURES, , Test 7, , 7, , t-test for a population mean (variance unknown), , Hypotheses and, alternatives, , H0 : µ = µ0, H1 : µ � = µ0, 2. H0 : µ = µ0, H1 : µ > µ0, 1., , t=, , Test statistics, , x̄ − µ0, √, s/ n, , where, �, (x − x̄)2, 2, ., s =, n−1, If σ 2 is not known and the estimate s2 of σ 2 is, based on a small sample (i.e. n < 20) and a, normal population., , When used, , Critical region and, degrees of freedom, , 1., DF = n –1, , 0.025, , 0.025, , –tn –1; 0.025, , tn –1; 0.025, , 2., , 0.05, , tn –1; 0.05, , H0 : µ0 = 4.0, n = 9, x̄ = 3.1, s = 1.0, ∴ t = −2.7, , Data, , Conclusion, , t8; 0.025 = ±2.306 [see Table 2]., Reject H0 ., 2. t8; 0.05 = −1.860 (left-hand side) [see Table 2]., Reject H0 ., , 1.
Page 18 :
EXAMPLES OF TEST PROCEDURES, , Test 10, , 9, , Method of paired comparisons, , Hypotheses and, alternatives, , 1., , H0 : µd, H1 : µd, 2. H0 : µd, H1 : µd, t=, , Test statistics, , =0, �= 0, =0, >0, , d − µd, √, s/ n, , where di = xi − yi , the difference in the n paired, observations., When an experiment is arranged so that each, observation in one sample can be ‘paired’, with a value from the second sample and the, populations are normally distributed., , When used, , Critical region and, degrees of freedom, , 1., DF = n – 1, , 0.025, , –tn – 1; 0.025, , 0.025, , tn – 1; 0.025, , 2., , 0.05, , tn – 1; 0.05, , n1 = 16, d = 1.0, s = 1.0, ∴ t = 4.0, , Data, , Conclusion, , t15; 0.025 = ±2.131 [see Table 2]., Reject H0 ., 2. t15; 0.05 = 1.753 [see Table 2]., Raject H0 ., , 1.
Page 21 :
12, , 100 STATISTICAL TESTS, , Test 37 χ 2 -test for goodness of fit, Hypotheses and, alternatives, , Goodness of fit for Poisson distribution with, known mean λ, , Test statistics, , χ2 =, , � (Oi − Ei )2, Ei, , Oi is the ith observed frequency, i = 1 to k;, Ei is expected frequency,, where Ei must be >5., When used, , To compare observed frequencies against those, obtained under assumptions about the parent, populations., , Critical region and, degrees of freedom, , Using α = 0.05 [see Table 5], DF: variable, normally one less than the, number of frequency comparisons (k) in the, summation in the test statistic., , 0.05, , Data, , H0 : Distribution., Poisson with λ = 2., xi, , Oi, , Ei, , 0, 1, 2, 3, 4, ≥5, , 10, 27, 30, 19, 8, 6, , 13.5, 27.0, 27.0, 18.0, 9.0, 5.5, , ∴ χ 2 = 1.45, Conclusion, , v = 5., χ5;2 0.05 = 11.07 [see Table 5]., Do not reject H0 .
Page 22 :
EXAMPLES OF TEST PROCEDURES, , 13, , Test 44 χ 2 -test for independence, Hypotheses and, alternatives, , Contingency table, , Test statistics, , χ2 =, , When used, , Given a bivariate frequency table for, attributes with m and n levels., , Critical region and, degrees of freedom, , Using α = 0.05 [see Table 5], , � (Oi − Ei )2, [see Table 5], Ei, , DF = (n – 1) (m – 1), , 0.05, , χ 2ν ; 0.05, , Data, , Machine, I, Grade, , Oi, , Ei, , Oi, , Ei, , Total, , 3, 9, 8, , 4, 8, 8, , 7, 11, 12, , 6, 12, 12, , 10, 20, 20, , 20, , 20, , 30, , 30, , 50, , A, B, C, Total, , II, , χ 2 = 0.625, Conclusion, , χ2;2 0.05 = 5.99 [see Table 5]., Do not reject H0 . The grades are independent, of the machine.
Page 23 :
LIST OF TESTS, Test 1 To investigate the significance of the difference between an assumed, population mean and sample mean when the population variance is known., Test 2 To investigate the significance of the difference between the means, of two samples when the variances are known and equal., Test 3 To investigate the significance of the difference between the means, of two samples when the variances are known and unequal., Test 4 To investigate the significance of the difference between an assumed, proportion and an observed proportion., Test 5 To investigate the assumption that the proportions of elements from, two populations are equal, based on two samples, one from each population., Test 6 To investigate the significance of the difference between two counts., Test 7 To investigate the significance of the difference between an assumed, population mean and a sample mean when the population variance is unknown., Test 8 To investigate the significance of the difference between the means, of two populations when the population variances are unknown but equal., Test 9 To investigate the significance of the difference between the means, of two populations when the population variances are unknown and unequal., Test 10 To investigate the significance of the difference between two, population means when no assumption is made about the population variances., Test 11 To investigate the significance of the regression coefficient., Test 12 To investigate whether the difference between the sample correlation, coefficient and zero is statistically significant., Test 13 To investigate the significance of the difference between a correlation, coefficient and a specified value., Test 14 To investigate the significance of the difference between the, correlation coefficients for a pair of variables occurring from two different, populations., Test 15 To investigate the difference between a sample variance and an, assumed population variance., Test 16 To investigate the significance of the difference between two, population variances., Test 17 To investigate the difference between two population variances when, there is correlation between the pairs of observations., Test 18 To compare the results of two experiments, each of which yields, a multivariate result. In other words, we wish to know if the mean pattern, obtained from the first experiment agrees with the mean pattern obtained for, the second., Test 19 To investigate the origin of one series of values for random variates,, when one of two markedly different populations may have produced that, particular series., , 21, 23, 25, 26, 27, 28, 29, 31, 33, 35, 37, 39, 40, , 42, 44, 45, 46, , 48, , 50
Page 24 :
LIST OF TESTS, , Test 20 To investigate the significance of the difference between a frequency, distribution based on a given sample and a normal frequency distribution with, the same mean and the same variance., Test 21 To investigate the significance of the difference between a suspicious, extreme value and other values in the sample., Test 22 To test the null hypothesis that the K samples came from K, populations with the same mean., Test 23 To investigate the significance of the difference between two, correlated proportions., Test 24 To investigate the significance of the difference between population, variance and an assumed value., Test 25 To investigate the significance of the difference between two counted, results., Test 26 To investigate the significance of the difference between the overall, mean of K subpopulations and an assumed value for the population mean., Test 27 To investigate which particular set of mean values or linear, combination of mean values shows differences with the other mean values., Test 28 To investigate the significance of all possible differences between, population means when the sample sizes are unequal., Test 29 To investigate the significance of all possible differences between, population means when the sample sizes are equal., Test 30 To investigate the significance of the differences when several, treatments are compared with a control., Test 31 To investigate the significance of the differences between the, variances of samples drawn from normally distributed populations., Test 32 To investigate the significance of the differences between the, variances of normally distributed populations when the sample sizes are equal., Test 33 To investigate the significance of the difference between a frequency, distribution based on a given sample and a normal frequency distribution., Test 34 To investigate the significance of the difference between one rather, large variance and other variances., Test 35 To investigate the significance of the difference between an observed, distribution and specified population distribution., Test 36 To investigate the significance of the difference between two, population distributions, based on two sample distributions., Test 37 To investigate the significance of the differences between observed, frequencies and theoretically expected frequencies., Test 38 To investigate the significance of the differences between, counts., Test 39 To investigate the significance of the differences between observed, frequencies for two dichotomous distributions., Test 40 To investigate the significance of the differences between observed, frequencies for two dichotomous distributions when the sample sizes are large., , 15, , 51, 54, 55, 57, 59, 60, 61, 63, 65, 67, 69, 71, 73, 74, 75, 76, 78, 79, 81, 83, 85
Page 25 :
16, , 100 STATISTICAL TESTS, , Test 41 To investigate the significance of the differences between observed, frequency distributions with a dichotomous classification., Test 42 To investigate the significance of the differences between, distributions of alternative data., Test 43 To investigate the significance of the differences between two, distributions based on two samples spread over some classes., Test 44 To investigate the difference in frequency when classified by one, attribute after classification by a second attribute., Test 45 To investigate the significance of the difference between the, population median and a specified value., Test 46 To investigate the significance of the difference between the medians, of two distributions when the observations are paired., Test 47 To investigate the significance of the difference between a population, mean and a specified value., Test 48 To investigate the significance of the difference between the means, of two similarly shaped distributions., Test 49 To test if two random samples could have come from two, populations with the same frequency distribution., Test 50 To test if two random samples could have come from two, populations with the same frequency distribution., Test 51 To test if K random samples could have come from K populations, with the same frequency distribution., Test 52 To test if two random samples could have come from two, populations with the same means., Test 53 To test if two random samples could have come from two, populations with the same variance., Test 54 To test if K random samples could have come from K populations, with the same mean., Test 55 To test if K random samples came from populations with the same, mean., Test 56 To investigate the difference between the largest mean and K − 1, other population means., Test 57 To test the null hypothesis that all treatments have the same effect, as the control treatment., Test 58 To investigate the significance of the correlation between two series, of observations obtained in pairs., Test 59 To investigate the significance of the correlation between two series, of observations obtained in pairs., Test 60 To test the null hypothesis that the mean µ of a population with, known variance has the value µ0 rather than the value µ1 ., Test 61 To test the null hypothesis that the standard deviation σ of a, population with a known mean has the value σ0 rather than the value σ1 ., , 86, 88, 89, 91, 93, 94, 95, 96, 97, 98, 99, 101, 102, 104, 106, 107, 108, 109, 110, 112, 114
Page 26 :
LIST OF TESTS, , Test 62 To test the null hypothesis that the parameter of a population has the, value p0 rather than p1 ., Test 63 To test the null hypothesis that the fluctuations in a series have a, random nature., Test 64 To test the null hypothesis that the fluctuations in a series have a, random nature. Series could be serially correlated., Test 65 To test the null hypothesis that the variations in a series are, independent of the order of the observations., Test 66 To test the null hypothesis that the fluctuations of a sample are, independent of the order in the sequence., Test 67 To test the null hypothesis that observations in a sample are, independent of the order in the sequence., Test 68 To test the null hypothesis that two samples have been randomly, selected from the same population., Test 69 To test the significance of the order of the observations in a sample., Test 70 To test the random occurrence of plus and minus signs in a sequence, of observations., Test 71 To test that the fluctuations in a sample have a random nature., Test 72 To compare the significance of the differences in response for K, treatments applied to n subjects., Test 73 To investigate the significance of the differences in response for K, treatments applied to n subjects., Test 74 To investigate the significance of the correlation between n series of, rank numbers, assigned by n numbers of a committee to K subjects., Test 75 To test a model for the distribution of a random variable of the, continuous type., Test 76 To test the equality of h independent multinomial distributions., Test 77 To test for non-additivity in a two-way classification., Test 78 To test the various effects for a two-way classification with an equal, number of observations per cell., Test 79 To test the main effects in the case of a two-way classification with, unequal numbers of observations per cell., Test 80 To test for nestedness in the case of a nested or hierarchical, classification., Test 81 To test the presence of regression of variable Y on the observed, value X., Test 82 To test the linearity of regression between the X variable and the Y, variable., Test 83 To test the significance of the reduction of uncertainty of past events., Test 84 To test the significance of the difference in sequential connections, across groups., , 17, , 116, 118, 120, 121, 122, 123, 124, 126, 128, 129, 130, 131, 133, 135, 137, 139, 142, 145, 148, 151, 153, 155, 156
Page 27 :
18, , 100 STATISTICAL TESTS, , Test 85 To test whether the population value of each regression coefficient, is zero in a multiple regression model., Test 86 To test the variances in a balanced random effects model of random, variables., Test 87 To test the interaction effects in a two-way classification random, effects model with equal number of observations per cell., Test 88 To test a parameter of a rectangular population using the likelihood, ratio method., Test 89 To test a parameter of an exponential population using the uniformly, most powerful test method., Test 90 To test the parameter of a Bernoulli population using the sequential, test method., Test 91 To test the ratio between the mean and the standard deviation of a, normal population where both are unknown, using the sequential method., Test 92 To test whether the error terms in a regression model are autocorrelated., Test 93 To test the medians of two populations., Test 94 To test whether a proposed distribution is a suitable probabilistic, model for the sample data., Test 95 To test whether the observed angles have a tendency to cluster around, a given angle, indicating a lack of randomness in the distribution., Test 96 To test whether the given distribution fits a random sample of angular, values., Test 97 To test whether two samples from circular observations differ, significantly from each other with respect to mean direction or angular, variance., Test 98 To test whether the mean angles of two independent circular, observations differ significantly from each other., Test 99 To test whether two independent random samples from circular, observations differ significantly from each other with respect to mean angle,, angular variance or both., Test 100 To test whether the treatment effects of independent samples from, von Mises populations differ significantly from each other., , 158, 160, 161, 164, 165, 166, 168, 169, 171, 172, 174, 176, , 177, 178, , 180, 182
Page 28 :
CLASSIFICATION OF TESTS, , Test numbers, For linear data, , 1 sample, , 2 samples, , K samples, , Parametric classical tests, for central tendency, , 1, 7, 19, , 2, 3, 8, 9, 10, 18, , for proportion, for variability, for distribution functions, for association, for probability, , 4, 15, 21, 24, 34, 20, 33, 75, 88, 89, 94, 11, 12, 13, 81, 82, 83, , 5, 6, 25, 16, 17, –, 14, 23, 84, 92, –, , 22, 26, 27, 28, 29, 30,, 77, 78, 79, 80, 87, –, 31, 32, 86, 76, 85, –, , Parametric tests, for distribution function, , 35, 37, , 36, 39, 40, , 38, 41, 42, 43, 44, , 45, 47, –, –, 58, 59, 63, 64, 65, 66, 67,, 69, 70, 71, , 46, 48, 50, 52, 93, 53, 49, –, 68, , 51, 54, 55, 56, 57, –, –, 72, 73, 74, –, , 60, 90, 61, 62, 91, , –, –, –, –, , –, –, –, –, , Distribution-free tests, for central tendency, for variability, for distribution functions, for association, for randomness, , Sequential tests, central tendency, variability, for proportion, for ratio, , Test numbers, For circular data, , 1 sample, , 2 samples, , K samples, , Parametric tests, for randomness, for distribution function, for central tendency, for variability, , 95, 96, –, –, , –, –, 97, 98, 99, , –, –, –, 100
Page 30 :
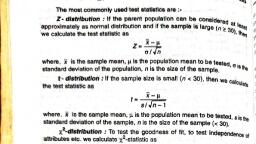
THE TESTS, Test 1 Z-test for a population mean (variance known), Object, To investigate the significance of the difference between an assumed population mean, µ0 and a sample mean x̄., Limitations, 1. It is necessary that the population variance σ 2 is known. (If σ 2 is not known, see the, t-test for a population mean (Test 7).), 2. The test is accurate if the population is normally distributed. If the population is not, normal, the test will still give an approximate guide., Method, From a population with assumed mean µ0 and known variance σ 2 , a random sample, of size n is taken and the sample mean x̄ calculated. The test statistic, Z=, , x̄ − µ0, √, σ/ n, , may be compared with the standard normal distribution using either a one- or two-tailed, test, with critical region of size α., Example, For a particular range of cosmetics a filling process is set to fill tubs of face powder, with 4 gm on average and standard deviation 1 gm. A quality inspector takes a random, sample of nine tubs and weighs the powder in each. The average weight of powder is, 4.6 gm. What can be said about the filling process?, A two-tailed test is used if we are concerned about over- and under-filling., In this Z = 1.8 and our acceptance range is −1.96 < Z < 1.96, so we do not reject, the null hypothesis. That is, there is no reason to suggest, for this sample, that the filling, process is not running on target., On the other hand if we are only concerned about over-filling of the cosmetic then, a one-tailed test is appropriate. The acceptance region is now Z < 1.645. Notice that, we have fixed our probability, which determines our acceptance or rejection of the null, hypothesis, at 0.05 (or 10 per cent) whether the test is one- or two-tailed. So now we, reject the null hypothesis and can reasonably suspect that we are over-filling the tubs, with cosmetic., Quality control inspectors would normally take regular small samples to detect the, departure of a process from its target, but the basis of this process is essentially that, suggested above.
Page 32 :
THE TESTS, , 23, , Test 2 Z-test for two population means (variances, known and equal), Object, To investigate the significance of the difference between the means of two populations., Limitations, 1. Both populations must have equal variances and this variance σ 2 must be known., (If σ 2 is not known, see the t-test for two population means (Test 8).), 2. The test is accurate if the populations are normally distributed. If not normal, the, test may be regarded as approximate., Method, Consider two populations with means µ1 and µ2 . Independent random samples of size, n1 and n2 are taken which give sample means x̄1 and x̄2 . The test statistic, Z=, , (x̄1 − x̄2 ) − (µ1 − µ2 ), �, �1, 1, 1 2, σ, +, n1, n2, , may be compared with the standard normal distribution using either a one- or two-tailed, test., Example, Two teams of financial sales persons are compared to see if it is likely that the, instruction each has received could have led to differing success rates. A sample of, nine transactions (which involves the whole team) yields an average success rate of, 1.2. Similarly a sample of 16 transactions for the second team yields a success rate, of 1.7. The variances for both teams are equal to 2.0750 (standard deviation 1.4405)., The success rate is calculated using a range of output measures for a transaction., If we are only interested to know of a difference between the two teams then a, two-tailed test is appropriate. In this case we accept the null hypothesis and can, assume that both teams are equally successful. This is because our acceptance region, is −1.96 < Z < 1.96 and we have computed a Z value, for this sample, of −0.833., On the other hand, if we suspect that the first team had received better training than, the second team we would use a one-tailed test., For our example, here, this is certainly not the case since our Z value is negative., Our acceptance region is Z < 1.645. Since the performance is in the wrong direction, we don’t even need to perform a calculation. Notice that we are not doing all possible, combination of tests so that we can find a significant result. Our test is based on our, design of the ‘experiment’ or survey planned before we collect any data. Our data do, not have a bearing on the form of the testing.
Page 34 :
THE TESTS, , 25, , Test 3 Z-test for two population means (variances, known and unequal), Object, To investigate the significance of the difference between the means of two populations., Limitations, 1. It is necessary that the two population variances be known. (If they are not known,, see the t-test for two population means (Test 9).), 2. The test is accurate if the populations are normally distributed. If not normal, the, test may be regarded as approximate., Method, Consider two populations with means µ1 and µ2 and variances σ12 and σ22 . Independent, random samples of size n1 and n2 are taken and sample means x̄1 and x̄2 are calculated., The test statistic, Z=, , (x̄1 − x̄2 ) − (µ1 − µ2 ), �, �1, σ22 2, σ12, +, n1, n2, , may be compared with the standard normal distribution using either a one- or two-tailed, test., Example, Brand A of a jumbo-sized pack of potato crisp is known to have a more variable weight, than brand B of potato crisp. Population variances are 0.000576 gm2 and 0.001089 gm2 ,, respectively. The respective means for samples of size 13 and 8 are 80.02 gm and, 79.98 gm., Is there a difference between the two brands in terms of the weights of the jumbo, packs? We do not have any pre-conceived notion of which brand might be ‘heavier’ so, we use a two-tailed test. Our acceptance region is −1.96 < Z < 1.96 and our calculated, Z value of 2.98. We therefore reject our null hypothesis and can conclude that there is, a difference with brand B yielding a heavier pack of crisps., Numerical calculation, n1 = 13, n2 = 8, x̄1 = 80.02, x̄2 = 79.98, σ12 = 0.000576, σ22 = 0.001089, Z = 2.98, Critical value Z0.05 = 1.96 [Table 1]., Reject the null hypothesis of no difference between means.
Page 35 :
26, , 100 STATISTICAL TESTS, , Test 4 Z-test for a proportion (binomial distribution), Object, To investigate the significance of the difference between an assumed proportion p0 and, an observed proportion p., Limitations, The test is approximate and assumes that the number of observations in the sample is, sufficiently large (i.e. n � 30) to justify the normal approximation to the binomial., Method, A random sample of n elements is taken from a population in which it is assumed that, a proportion p0 belongs to a specified class. The proportion p of elements in the sample, belonging to this class is calculated. The test statistic is, |p − p0 | − 1/2n, Z= �, �1 ., p0 (1 − p0 ) 2, n, This may be compared with a standard normal distribution using either a one- or twotailed test., Example, The pass rate for a national statistics test has been 0.5, or 50 per cent for some years. A, random sample of 100 papers from independent (or non-college based) students yields, a pass rate of 40 per cent. Does this show a significant difference? Our computed Z is, −2.0 and our acceptance region is −1.96 < Z < 1.96. So we reject the null hypothesis, and conclude that there is a difference in pass rates. In this case, the independent, students fare worse than those attending college. While we might have expected this,, there are other possible factors that could point to either an increase or decrease in, the pass rate. Our two-tailed test affirms our ignorance of the possible direction of a, difference, if one exists., Numerical calculation, n = 100, p = 0.4, p0 = 0.5, Z = −2.1, Critical value Z0.05 = ±1.96 [Table 1]., Reject the null hypothesis of no difference in proportions.
Page 36 :
THE TESTS, , 27, , Test 5 Z-test for the equality of two proportions, (binomial distribution), Object, To investigate the assumption that the proportions π1 and π2 of elements from two, populations are equal, based on two samples, one from each population., Limitations, The test is approximate and assumes that the number of observations in the two samples is sufficiently large (i.e. n1 , n2 � 30) to justify the normal approximation to the, binomial., Method, It is assumed that the populations have proportions π1 and π2 with the same characteristic. Random samples of size n1 and n2 are taken and respective proportions p1 and p2, calculated. The test statistic is, (p1 − p2 ), �, �� 1, 2, 1, 1, +, P(1 − P), n1, n2, , Z=�, , where, P=, , p1 n1 + p2 n2, ., n1 + n2, , Under the null hypothesis that π1 = π2 , Z is approximately distributed as a standard, normal deviate and the resulting test may be either one- or two-tailed., Example, Two random samples are taken from two populations, which are two makes of clock, mechanism produced in different factories. The first sample of size 952 yielded the, proportion of clock mechanisms, giving accuracy not within fixed acceptable limits, over a period of time, to be 0.325 per cent. The second sample of size 1168 yielded, 5.73 per cent. What can be said about the two populations of clock mechanisms, are, they significantly different? Again, we do not have any pre-conceived notion of whether, one mechanism is better than the other, so a two-tailed test is employed., With a Z value of −6.93 and an acceptance region of −1.96 < Z < 1.96, we, reject the null hypothesis and conclude that there is significant difference between the, mechanisms in terms of accuracy. The second mechanism is significantly less accurate, than the first., Numerical calculation, n1 = 952, n2 = 1168, p1 = 0.00325, p2 = 0.0573, Z = −6.93, Critical value Z0.05 = ±1.96 [Table 1]., Reject the null hypothesis.
Page 37 :
28, , 100 STATISTICAL TESTS, , Test 6 Z-test for comparing two counts (Poisson, distribution), Object, To investigate the significance of the difference between two counts., Limitations, The test is approximate and assumes that the counts are large enough for the normal, approximation to the Poisson to apply., Method, Let n1 and n2 be the two counts taken over times t1 and t2 , respectively. Then the two, average frequencies are R1 = n1 /t1 and R2 = n2 /t2 . To test the assumption of equal, average frequencies we use the test statistic, Z=�, , (R1 − R2 ), �1 ., R2 2, R1, +, t1, t2, , This may be compared with a standard normal distribution using either a one-tailed or, two-tailed test., Example, Two traffic roundabouts are compared for intensity of traffic at non-peak times with, steady conditions. Roundabout one has 952/2 arrivals over 11 minutes and roundabout, two has 1168/2 arrivals over 15 minutes. The arrival rates, per minute, are therefore, 476/11 (43.27) and 584/15 (38.93) respectively., What do these results say about the two arrival rates or frequency taken over the two, time intervals? We calculate a Z value of 2.4 and have an acceptance region of −1.96 <, Z < 1.96. So we reject the null hypothesis of no difference between the two rates., Roundabout one has an intensity of arrival significantly higher than roundabout two., Numerical calculation, n1 = 952, n2 = 1168, R1 =, , n1, n2, = 43.27, R2 =, = 38.93, t1, t2, , t1 = 22, t2 = 30, Z=�, , (R1 − R2 ), 4.34, 4.34, = 2.40, =, 1, �1 =, 1.81, (3.26) 2, R1, R2 2, +, t1, t2, , Critical value Z0.05 = 1.96 [Table 1]., Reject the null hypothesis of no difference between the counts.
Page 38 :
THE TESTS, , 29, , Test 7 t-test for a population mean (variance, unknown), Object, To investigate the significance of the difference between an assumed population mean, µ0 and a sample mean x̄., Limitations, 1. If the variance of the population σ 2 is known, a more powerful test is available: the, Z-test for a population mean (Test 1)., 2. The test is accurate if the population is normally distributed. If the population is not, normal, the test will give an approximate guide., Method, From a population with assumed mean µ0 and unknown variance, a random sample, of size n is taken and the sample mean x̄ calculated as well as the sample standard, deviation using the formula, , s=, , ⎫ 21, ⎧�, n, ⎪, ⎪, (x, −, x̄), ⎪, ⎪, i, ⎬, ⎨, i=1, , ⎪, ⎪, ⎩, , n−1, , ⎪, ⎪, ⎭, , ., , The test statistic is, t=, , x̄ − µ0, √, s/ n, , which may be compared with Student’s t-distribution with n − 1 degrees of freedom., The test may be either one-tailed or two-tailed., Example, A sample of nine plastic nuts yielded an average diameter of 3.1 cm with estimated, standard deviation of 1.0 cm. It is assumed from design and manufacturing requirements, that the population mean of nuts is 4.0 cm. What does this say about the mean diameter of, plastic nuts being produced? Since we are concerned about both under- and over-sized, nuts (for different reasons) a two-tailed test is appropriate., Our computed t value is −2.7 and acceptance region −2.3 < t < 2.3. We reject, the null hypothesis and accept the alternative hypothesis of a difference between the, sample and population means. There is a significant difference (a drop in fact) in the, mean diameters of plastic nuts (i.e. between the sample and population).
Page 40 :
THE TESTS, , 31, , Test 8 t-test for two population means (variances, unknown but equal), Object, To investigate the significance of the difference between the means of two populations., Limitations, 1. If the variance of the populations is known, a more powerful test is available: the, Z-test for two population means (Test 2)., 2. The test is accurate if the populations are normally distributed. If the populations, are not normal, the test will give an approximate guide., Method, Consider two populations with means µ1 and µ2 . Independent random samples of size, n1 and n2 are taken from which sample means x̄1 and x̄2 together with sums of squares, s12 =, , n1, �, (xi − x̄1 )2, i=1, , and, s22 =, , n2, �, (xi − x̄2 )2, i=1, , are calculated. The best estimate of the population variance is found as s2 =, [(n1 − 1)s12 + (n2 − 1)s22 ]/(n1 + n2 − 2). The test statistic is, t=, , (x̄1 − x̄2 ) − (µ1 − µ2 ), �, �1, 1, 1 2, s, +, n1, n2, , which may be compared with Student’s t-distribution with n1 + n2 − 2 degrees of, freedom. The test may be either one-tailed or two-tailed., Example, Two snack foods are made and sold in 30 gm packets. Random samples of size 12 are, taken from the production line of each snack food and means and variances obtained, viz.: mean1 31.75 gm, variance1 112.25 gm2 ; mean2 28.67 gm, variance2 66.64 gm2 ., What can be said about the two production processes in relation to the weight of packets?, We use a two-tailed test and find that t is 0.798. Our acceptance region is −2.07 <, t < 2.07 and so we accept our null hypothesis. So we can conclude that the mean, weight of packs from the two production lines is the same.
Page 42 :
THE TESTS, , 33, , Test 9 t-test for two population means (variances, unknown and unequal), Object, To investigate the significance of the difference between the means of two populations., Limitations, 1. If the variances of the populations are known, a more powerful test is available: the, Z-test for two population means (Test 3)., 2. The test is approximate if the populations are normally distributed or if the sample, sizes are sufficiently large., 3. The test should only be used to test the hypothesis µ1 = µ2 ., Method, Consider two populations with means µ1 and µ2 . Independent random samples of size, n1 and n2 are taken from which sample means x̄1 and x̄2 and variances, n1, �, (xi − x̄1 )2, , s12 =, , i=1, , n1 − 1, , n2, �, (xi − x̄2 )2, , and, , s22 =, , i=1, , n2 − 1, , are calculated. The test statistic is, t=, , (x̄1 − x̄2 ) − (µ1 − µ2 ), �, �1, s22 2, s12, +, n1, n2, , which may be compared with Student’s t-distribution with degrees of freedom given, by, ⎫, ⎧, �, �, 2, 2 2, ⎪, ⎪, s, s, ⎪, ⎪, 1, ⎪, ⎪, ⎪, ⎪, + 2, ⎪, ⎪, ⎬, ⎨, n1, n2, ., ν=, ⎪, ⎪, s14, s24, ⎪, ⎪, ⎪, ⎪, +, ⎪, ⎪ 2, ⎪, ⎭, ⎩ n (n1 − 1) n2 (n2 − 1) ⎪, 1, 2, Example, Two financial organizations are about to merge and, as part of the rationalization, process, some consideration is to be made of service duplication. Two sales teams, responsible for essentially identical products are compared by selecting samples, from each and reviewing their respective profit contribution levels per employee over, a period of two weeks. These are found to be 3166.00 and 2240.40 with estimated
Page 43 :
34, , 100 STATISTICAL TESTS, , variance of 6328.27 and 221 661.3 respectively. How do the two teams compare on, performance?, We compute a t value of 5.72. Our acceptance region is −2.26 < t < 2.26 so we, reject the null hypothesis and accept the alternative. There is a significant difference, between the two teams. Team 1 is more productive than team 2., Numerical calculation, n1 = 4, n2 = 9, x̄1 = 3166.0, x̄2 = 2240.4, s12 = 6328.67, s22 = 221 661.3, t = 5.72, ν = 9 (rounded), Critical value t9; 0.025 = 2.26 [Table 2]., Reject the null hypothesis.
Page 44 :
THE TESTS, , 35, , Test 10 t-test for two population means (method of, paired comparisons), Object, To investigate the significance of the difference between two population means, µ1 and, µ2 . No assumption is made about the population variances., Limitations, 1. The observations for the two samples must be obtained in pairs. Apart from population differences, the observations in each pair should be carried out under identical,, or almost identical, conditions., 2. The test is accurate if the populations are normally distributed. If not normal, the, test may be regarded as approximate., Method, The differences di are formed for each pair of observations. If there are n such pairs of, observations, we can calculate the variance of the differences by, s =, 2, , n, �, (di − d̄)2, i=1, , n−1, , Let the means of the samples from the two populations be denoted by x̄1 and x̄2 . Then, the test statistic becomes, t=, , (x̄1 − x̄2 ) − 0, 1, , s/n 2, , which follows Student’s t-distribution with n − 1 degrees of freedom. The test may be, either one-tailed or two-tailed., Example, To compare the efficacy of two treatments for a respiratory condition, ten patients, are selected at random and the treatments are administered using an oral spray. The, patients then perform a treadmill exercise until a maximum exercise rate is reached. The, times for these are compared. A suitable period of time is ensured between treatments, to prevent the effect of treatments to interact. Do the two treatments differ? In this, case we do not expect one particular treatment to be superior to the other so a twotailed test is used. We compute a t value of −0.11 and have an acceptance region of, −2.26 < t < 2.26. So we accept the null hypothesis of no difference between the two, treatments. However, in such situations it is often the case that an improvement over an, existing or original treatment is expected. Then a one-tailed test would be appropriate.
Page 45 :
36, , 100 STATISTICAL TESTS, , Numerical calculation, d̄ = x̄1 − x̄2 = −0.1, n = 10, ν = n − 1, s = 2.9, t = −0.11, ν = 9, Critical value t9; 0.025 = 2.26 [Table 2]., Do not reject the null hypothesis of no difference between means.
Page 46 :
THE TESTS, , 37, , Test 11 t-test of a regression coefficient, Object, To investigate the significance of the regression coefficient of y on x., Limitations, The usual assumptions for regression should apply, namely:, 1. the variable y follows a normal distribution for each value of x;, 2. the variance among the y values remains constant for any given values of x., Method, In order to estimate a linear regression of the form y = A + B(x − x̄), a sample of n, pairs of points (xi , yi ) is required. B is called the regression coefficient, and to test the, null hypothesis that this is equal to zero we first calculate the sample estimate, 1� �, xi, yi, xi yi −, n, ., �, �, �, 1 � 2, xi, xi2 −, n, , �, b=, , The variance of the xs and the variance of the ys about the regression line are calculated, as follows:, �, �, {yi − ȳ − b(xi − x̄)}2, (xi − x̄)2, 2, =, and sy·x, sx2 =, n−2, n−1, where x̄ and ȳ are the means of the xs and ys, respectively. The test statistic becomes, t=, , 1, bsx, (n − 1)− 2, sy·x, , which follows Student’s t-distribution with n − 2 degrees of freedom. The test must be, two-tailed since b may be positive or negative. However, the test may be one-tailed if, the alternative hypothesis is directional., Example, In an investigation of the relationship between a reaction test, on a vehicle simulator, and, a composite test a sample of 12 male subjects is selected. The composite test of reactions, is a much cheaper alternative to a vehicle simulator test. A regression relationship is, computed with regression coefficient 5.029 and t value 6.86. The acceptance region for, the null hypothesis is −2.23 < t < 2.23. Since the computed t value lies outside the, acceptance region we conclude that slope (b coefficient) is significantly greater than, zero and a significant regression exists., Notice that the test does not tell us how good a predictor x is of y, only that the, regression is significant.
Page 47 :
38, , 100 STATISTICAL TESTS, , Numerical calculation, �, �, �, xi = 766,, yi = 1700,, xi2 = 49 068,, �, �, yi2 = 246 100,, xi yi = 109 380, n = 12, x̄ = 68.83, ȳ = 141.67, ν = n − 2, sx2 = 15.61, sy2 = 478.8, b = 5.029, 2, sy·x, = 92.4, , t = 6.86, ν = 10, Critical value t10; 0.025 = ±2.23 [Table 2]., Reject the null hypothesis.
Page 48 :
THE TESTS, , 39, , Test 12 t-test of a correlation coefficient, Object, To investigate whether the difference between the sample correlation coefficient and, zero is statistically significant., Limitations, It is assumed that the x and y values originate from a bivariate normal distribution, and, that the relationship is linear. To test an assumed value of the population coefficient, other than zero, refer to the Z-test for a correlation coefficient (Test 13)., Method, Given a sample of n points (xi , yi ) the correlation coefficient r is calculated from the, formula, �, (xi − x̄)(yi − ȳ), r=�, �1 ., �, �, 2, 2 2, (yi − ȳ), (xi − x̄), To test the null hypothesis that the population value of r is zero, the test statistic, √, r, · n−2, t=√, 1 − r2, is calculated and this follows Student’s t-distribution with n − 2 degrees of freedom., The test will normally be two-tailed but in certain cases could be one-tailed., Example, In a study of the possible relationship between advertising on television and product, preferences a panel of television viewers is selected. For two brands of toothpaste, one, supermarket own brand and one popular brand, panel members were asked to score, (on a scale from 1 to 20) their preference for each product. The correlation coefficient, between brands was 0.32, which is modest but is it significantly greater than zero? The, calculated t value is 1.35. Our acceptance region is −1.35 < t < 1.35 so we accept the, null hypothesis. So there is no association between the brands compared, which would, suggest a clear preference for popular brand or own brand. Consumers are less likely to, substitute own brand for popular brand when preferences appear not to be associated., Numerical calculation, n = 18, r = 0.32, ν = n − 2, √, √, 0.32 16, r n−2, =�, = 1.35, t= √, 1 − r2, 1 − (0.32)2, Critical value t16; 0.05 = 1.75 [Table 2]., Do not reject the null hypothesis. NB: In this case the x and y variables are independent.
Page 49 :
40, , 100 STATISTICAL TESTS, , Test 13 Z-test of a correlation coefficient, Object, To investigate the significance of the difference between a correlation coefficient and a, specified value ρ0 ., Limitations, 1. The x and y values originate from normal distributions., 2. The variance in the y values is independent of the x values., 3. The relationship is linear., When these conditions cannot be met, the user should turn to the Kendall rank, correlation test (Test 59)., Method, With r as defined in the t-test of a correlation coefficient (Test 12), using the Fisher, Z-transformation we have, �, �, �, �, 1+r, 1+r, 1, Z1 = loge, ., = 1.1513 log10, 1−r, 1−r, 2, The distribution of Z1 is approximately normal with mean µZ1 and standard deviation, σZ1 where, �, �, �, �, 1 + ρ0, 1+r, 1, µZ1 = loge, = 1.1513 log10, 2, 1 − ρ0, 1−r, 1, σZ1 = √, ., n−3, The test statistic is now, Z=, , Z1 − µZ1, ., σZ1, , Example, A market research company has assumed from previous research that the correlation, between two brands in terms of consumer preference is 0.50. This value has a bearing on, stocking levels in supermarkets since one brand will often substitute for another when, the number on the shelves of one product runs out. A panel of 24 consumers produces a, correlation on preference scores (based on a scale of 1 to 20) for the two brands of 0.75., Can we say that the correlation coefficient is at least 0.50? The Fisher Z-transformation, value, calculated as 0.973, yields a test statistic of 1.94. The acceptance region is, Z < 1.64. Since the calculated value is greater than the critical value we reject the null, hypothesis. This means that the correlation coefficient is at least 0.50 and there is no, need to re-evaluate supermarket stocking policy for these two products.
Page 50 :
THE TESTS, , 41, , Numerical calculation, r = 0.75, ρ0 = 0.50, n = 24, , �, , µZ1 = 1.1513 log10 3 = 0.5493, Z1 = 1.1513 log10, = 0.9730 [Table 4], σZ1 = 0.2182, Z=, , Z1 − µZ1, = 1.94., σZ1, , The critical value at α = 0.10 is 1.64 [Table 1]., The calculated value is greater than the critical value., Reject the null hypothesis of no difference., , 1 + 0.75, 1 − 0.75, , �
Page 51 :
42, , 100 STATISTICAL TESTS, , Test 14 Z-test for two correlation coefficients, Object, To investigate the significance of the difference between the correlation coefficients for, a pair of variables occurring from two different samples and the difference between, two specified values ρ1 and ρ2 ., Limitations, 1. The x and y values originate from normal distributions., 2. The variance in the y values is independent of the x values., 3. The relationships are linear., Method, Using the notation of the Z-test of a correlation coefficient, we form for the first sample, �, �, �, �, 1, 1 + r1, 1 + r1, = 1.1513 log10, Z1 = loge, 2, 1 − r1, 1 − r1, √, which has mean µZ1 = 21 loge [(1 + ρ1 )/(1 − ρ1 )] and variance σZ1 = 1/ n1 − 3,, where n1 is the size of the first sample; Z2 is determined in a similar manner. The test, statistic is now, Z=, , (Z1 − Z2 ) − (µZ1 − µZ2 ), σ, , 1, , where σ = (σZ21 + σZ22 ) 2 . Z is normally distributed with mean 0 and with variance 1., Example, A market research company is keen to categorize a variety of brands of potato crisp based, on the correlation coefficients of consumer preferences. The market research company, has found that if consumers’ preferences for brands are similar then marketing programmes can be merged. Two brands of potato crisp are compared for two advertising, regions. Panels are selected of sizes 28 and 35 for the two regions and correlation coefficients for brand preferences are 0.50 and 0.30 respectively. Are the two associations, statistically different or can marketing programmes be merged? The calculated Z value, is 0.8985 and the acceptance region for the null hypothesis is −1.96 < Z < 1.96., So we accept the null hypothesis and conclude that we can go ahead and merge the, marketing programmes. This, of course, assumes that the correlation coefficient is a, good measure to use for grouping market research programmes., Numerical calculation, n1 = 28, n2 = 35, r1 = 0.50, r2 = 0.30, α = 0.05, �, �, 1 + r1, Z1 = 1.1513 log10, = 0.5493 [Table 4], 1 − r1
Page 52 :
THE TESTS, , �, 1 + r2, = 0.3095 [Table 4], 1 − r2, �1, �, 2, 1, 1, +, = 0.2669, σ =, n1 − 3 n2 − 3, 0.5493 − 0.3095, Z=, = 0.8985, 0.2669, The critical value at α = 0.05 is 1.96 [Table 1]., Do not reject the null hypothesis., �, , Z2 = 1.1513 log10, , 43
Page 53 :
44, , 100 STATISTICAL TESTS, , Test 15 χ 2 -test for a population variance, Object, To investigate the difference between a sample variance s2 and an assumed population, variance σ02 ., Limitations, It is assumed that the population from which the sample is drawn follows a normal, distribution., Method, Given a sample of n values x1 , x2 , . . . , xn , the values of, �, �, (xi − x̄)2, xi, 2, and s =, x̄ =, n, n−1, are calculated. To test the null hypothesis that the population variance is equal to σ02 the, test statistic (n − 1)s2 /σ02 will follow a χ 2 -distributkm with n − 1 degrees of freedom., The test may be either one-tailed or two-tailed., Example, A manufacturing process produces a fixed fluid injection into micro-hydraulic systems., The variability of the volume of injected fluid is critical and is set at 9 sq ml. A sample, of 25 hydraulic systems yields a sample variance of 12 sq ml. Has the variability of, the volume of fluid injected changed? The calculated chi-squared value is 32.0 and, the 5 per cent critical value is 36.42. So we do not reject the null hypothesis of no, difference. This means that we can still consider the variability to be set as required., Numerical calculation, x̄ = 70, σ02 = 9, n = 25, s2 = 12, ν = 24, 24 × 12, = 32.0, 9, = 36.42 [Table 5]., , χ 2 = (n − 1)s2 /σ02 =, 2, Critical value x24;, 0.05, , Do not reject the null hypothesis. The difference between the variances is not significant.
Page 54 :
THE TESTS, , 45, , Test 16 F -test for two population variances (variance, ratio test), Object, To investigate the significance of the difference between two population variances., Limitations, The two populations should both follow normal distributions. (It is not necessary that, they should have the same means.), Method, Given samples of size n1 with values x1 , x2 , . . . , xn1 and size n2 with values, y1 , y2 , . . . , yn2 from the two populations, the values of, �, �, xi, yi, x̄ =, , ȳ =, n1, n2, and, , �, s12 =, , (xi − x̄)2, , n1 − 1, , �, ,, , s22 =, , (yi − ȳ)2, , n2 − 1, , can be calculated. Under the null hypothesis that the variances of the two populations, are equal the test statistic F = s12 /s22 follows the F-distribution with (n1 − 1, n2 − 1), degrees of freedom. The test may be either one-tailed or two-tailed., Example, Two production lines for the manufacture of springs are compared. It is important that, the variances of the compression resistance (in standard units) for the two production, lines are the same. Two samples are taken, one from each production line and variances, are calculated. What can be said about the two population variances from which the, two samples have been taken? Is it likely that they differ? The variance ratio statistic F, is calculated as the ratio of the two variances and yields a value of 0.36/0.087 = 4.14., The 5 per cent critical value for F is 5.41. We do not reject our null hypothesis of, no difference between the two population variances. There is no significant difference, between population variances., Numerical calculation, �, �, x = 0.4,, x 2 = 0.30, s12 = 0.087, n1 = 4, n2 = 6,, �, �, y = 0.06,, y2 = 1.78, s22 = 0.36, 0.36, = 4.14, 0.087, Critical value F3.5; 0.05 = 5.41 [Table 3]., Do not reject the null hypothesis. The two population variances are not significantly, different from each other., F3; 5 =
Page 55 :
46, , 100 STATISTICAL TESTS, , Test 17 F -test for two population variances (with, correlated observations), Object, To investigate the difference between two population variances when there is correlation, between the pairs of observations., Limitations, It is assumed that the observations have been performed in pairs and that correlation, exists between the paired observations. The populations are normally distributed., Method, A random sample of size n yields the following pairs of observations, (x1 , y1 ), (x2 , y2 ), . . . , (xn , yn ). The variance ratio F is calculated as in Test 16. Also, the sample correlation r is found from, �, , (xi − x̄)(yi − ȳ), �1 ., �, 2 2, 2, (yi − ȳ), (xi − x̄), , r=�, �, , The quotient, γF =, , F−1, 1, , [(F + 1)2 − 4r 2 F] 2, , provides a test statistic with degrees of freedom ν = n − 2. The critical values for this, test can be found in Table 6. Here the null hypothesis is σ12 = σ22 , when the population, correlation is not zero. Here F is greater than 1., Example, A researcher tests a sample panel of television viewers on their support for a particular, issue prior to a focus group, during which the issue is discussed in some detail. The panel, members are then asked the same questions after the discussion. The pre-discussion, view is x and the post-discussion view is y. The question, here, is ‘has the focus group, altered the variability of responses?’, We find the test statistic, F, is 0.796. Table 6 gives us a 5 per cent critical value, of 0.811. For this test, since the calculated value is greater than the critical value, we, do not reject the null hypothesis of no difference between variances. Hence the focus, group has not altered the variability of responses.
Page 56 :
THE TESTS, , 47, , Numerical calculation, �, �, n1 = n2 = 6,, x = 0.4,, x 2 = 0.30, s12 = 0.087, �, , y = 0.06,, , γF =, =, , �, , y2 = 1.78, s22 = 0.36, F =, , F−1, [(F, , + 1)2, , 1, , − 4r 2 F] 2, , =, , s22, s12, , = 4.14, r = 0.811, , 4.14 − 1, 1, , [(5.14)2 − 4r 2 .4.14] 2, , 3.14, 1, , [26.42 − 16.56 × 0.658] 2, , = 0.796, , α = 0.05, ν = n − 2 = 4, r = 0.811 [Table 6]., Hence do not reject the hypothesis of no difference between variances., The null hypothesis σ12 = σ22 has to be reflected when the value of the test-statistic, equals or exceeds the critical value.
Page 57 :
48, , 100 STATISTICAL TESTS, , Test 18 Hotelling’s T 2 -test for two series of, population means, Object, To compare the results of two experiments, each of which yields a multivariate result., In other words, we wish to know if the mean pattern obtained from the first experiment, agrees with the mean pattern obtained for the second., Limitations, All the variables can be assumed to be independent of each other and all variables, follow a multivariate normal distribution. (The variables are usually correlated.), Method, Denote the results of the two experiments by subscripts A and B. For ease of description, we shall limit the number of variables to three and we shall call these x, y and z. The, number of observations is denoted by nA and nB for the two experiments. It is necessary, to solve the following three equations to find the statistics a, b and c:, a[(xx)A + (xx)B ] + b[(xy)A + (xy)B ] + c[(xz)A + (xz)B ], = (nA + nB − 2)(x̄A − x̄B ), a[(xy)A + (xy)B ] + b[(yy)A + (yy)B ] + c[(yz)A + (yz)B ], = (nA + nB − 2)(ȳA − ȳB ), a[(xz)A + (xz)B ] + b[(yz)A + (yz)B ] + c[(zz)A + (zz)B ], = (nA + nB − 2)(z̄A − z̄B ), �, �, (xA − x̄A )2 , (xy)A =, (xA − x̄A )(yA − ȳA ), and similar definitions, where (xx)A =, exist for other terms., Hotelling’s T 2 is defined as, T2 =, , n A nB, · {a(x̄A − x̄B ) + b(ȳA − ȳB ) + c(z̄A − z̄B )}, nA + n B, , and the test statistic is, F=, , nA + nB − p − 1 2, T, p(nA + nB − 2), , which follows an F-distribution with (p, nA + nB − p − 1) degrees of freedom. Here p, is the number of variables., Example, Two batteries of visual stimulus are applied in two experiments on young male and, female volunteer students. A researcher wishes to know if the multivariate pattern of
Page 58 :
THE TESTS, , 49, , responses is the same for males and females. The appropriate F statistic is computed, as 3.60 and compared with the tabulated value of 4.76 [Table 3]. Since the computed F, value is less than the critical F value the null hypothesis is of no difference between the, two multivariate patterns of stimulus. So the males and females do not differ in their, responses on the stimuli., Numerical calculation, nA = 6, nB = 4, DF = ν = 6 + 4 − 4 = 6, α = 0.05, (xx) = (xx)A + (xx)B = 19, (yy) = 30, (zz) = 18, (xy) = −6, ν1 = p = 3, (xz) = 1, (yz) = −7, x̄A = +7, x̄B = 4.5, ȳA = 8, ȳB = 6, z̄A = 6, z̄B = 5, The equations, 19a − 6b + c = 20, −6a + 30b − 7c = 16, a − 7b + 18c = 8, are satisfied by a = 1.320, b = 0.972, c = 0.749. Thus, 6×4, · (1.320 × 2.5 + 0.972 × 2 + 0.749 × 1) = 14.38, 10, 6, F=, × 14.38 = 3.60, 3×8, Critical value F3.6; 0.0 = 4.76 [Table 3]., Do not reject the null hypothesis., T2 =
Page 59 :
50, , 100 STATISTICAL TESTS, , Test 19 Discriminant test for the origin of a p-fold, sample, Object, To investigate the origin of one series of values for p random variates, when one of two, markedly different populations may have produced that particular series., Limitations, This test provides a decision rule which is closely related to Hotelling’s T 2 -test (Test, 18), hence is subject to the same limitations., Method, Using the notation of Hotelling’s T 2 -test, we may take samples from the two populations, and obtain two quantities, DA = ax̄A + bȳA + cz̄A, DB = ax̄B + bȳB + cz̄B, for the two populations. From the series for which the origin has to be traced we can, obtain a third quantity, DS = ax̄S + bȳS + cz̄S ., If DA −DS < DB −DS we say that the series belongs to population A, but if DA −DS >, DB − DS we conclude that population B produced the series under consideration., Example, A discriminant function is produced for a collection of pre-historic dog bones. A new, relic is found and the appropriate measurements are taken. There are two ancient populations of dog A or B to which the new bones could belong. To which population do, the new bones belong? This procedure is normally performed by statistical computer, software. The DA and DB values as well as the DS value are computed. The DS value, is closer to DA and so the new dog bone relic belongs to population A., Numerical calculation, a = 1.320, b = 0.972, c = 0.749, x̄A = 7, ȳA = 8, z̄A = 6, x̄B = 4.5, ȳB = 6, z̄B = 5, DA = 1.320 × 7 + 0.972 × 8 + 0.749 × 6 = 21.510, DB = 1.320 × 4.5 + 0.972 × 6 + 0.749 × 5 = 15.517, If x̄S = 6, ȳS = 6 and z̄S = 7, then, DS = 1.320 × 6 + 0.972 × 6 + 0.749 × 7 = 18.995, DA − DS = 21.510 − 18.995 = 2.515, DB − DS = 15.517 − 18.995 = −3.478, DS lies closer to DA . DS belongs to population A.
Page 60 :
THE TESTS, , 51, , Test 20 Fisher’s cumulant test for normality of a, population, Object, To investigate the significance of the difference between a frequency distribution based, on a given sample and a normal frequency distribution with the same mean and the, same variance., Limitations, The sample size should be large, say n > 50. If the two distributions do not have the, same mean and the same variance then the w/s-test (Test 33) can be used., Method, Sample moments can be calculated by, Mr =, , n, �, , xir, , or, , Mr =, , n, �, , xin fi, , i=1, , i=1, , where the xi are the interval midpoints in the case of grouped data and fi is the frequency., The first four sample cumulants (Fisher’s K-statistics) are, M1, n, nM2 − M12, K2 =, n(n − 1), , K1 =, , K3 =, , n2 M3 − 3nM2 M1 + 2M13, n(n − 1)(n − 2), , K4 =, , (n3 + n2 )M4 − 4(n2 + n)M3 M1 − 3(n2 − n)M22 + 12M2 M12 − 6M14, n(n − 1)(n − 2)(n − 3), , To test for skewness the test statistic is, u1 =, , K3, (K2 ), , 3, 2, , ×, , �n�1, 2, , 6, , which should follow a standard normal distribution., To test for kurtosis the test statistic is, u2 =, , � n �1, K4, 2, ×, 2, 24, (K2 ), , which should follow a standard normal distribution.
Page 61 :
52, , 100 STATISTICAL TESTS, , A combined test can be obtained using the test statistic, �, χ =, , K3, , 2, , 3, , (K2 ) 2, , ×, , �n�1, , �2, , 2, , 6, , �, , � n � 1 �2, K4, 2, +, ×, 24, (K2 )2, , which will approximately follow a χ 2 -distribution with two degrees of freedom., Example, Example A, , A large sample of 190 component measurements yields the following calculations (see, table). Do the sample data follow a normal distribution? The test for skewness is a u1, statistic of 0.473 and the critical value of the normal test statistic is 1.96. Since u1 is, less than this critical value we do not reject the null hypothesis of no difference. So for, skewness the data are similar to a normal distribution. For kurtosis we have u2 statistic, of 0.474 and, again, a critical value of 1.96. So, again, we accept the null hypothesis;, kurtosis is not significantly different from that of a normal distribution with the same, mean and variance. The combined test gives a calculated chi-squared value 0.449 which, is smaller than the 5 per cent critical value of 5.99. So we conclude that the data follow, a normal distribution., Example B, , We calculate the values of skewness and kurtosis together with their respective standard, deviations and produce:, u1 = skewness/s d = 0.477, u2 = kurtosis/s d = 0.480, Table 7 gives (for sample sizes 200 and 175) critical values for u1 of 0.282 to 0.301, and for u2 of 0.62 to 0.66. So, again, we accept the null hypothesis., Numerical calculation, Example A, , �, , �, �, f = n = 190,, fx = 151,, fx2 = 805,, �, �, fx 3 = 1837,, fx 4 = 10 753, i.e. M1 = 151, M2 = 805, M3 = 1837, M4 = 10 753, K2 =, , (190 × 805) − (151)2, = 3.624310, 190 × 189, , (190)2 × 1837 − 3 × 190 × 805 × 151 + 2(151)3, = 0.5799445, 190 × 189 × 188, 2 795 421 924, K4 =, = 2.214280, 190 × 189 × 188 × 187, K3 =
Page 62 :
THE TESTS, Test for skewness, , u1 =, , 0.579945, × 5.6273 = 0.08405 × 5.6273 = 0.473, √, 3.62431 3.624310, , The critical value at α = 0.05 is 1.96., Do not reject the null hypothesis [Table 1]., Test for kurtosis, , 2.214279, u2 =, ×, (3.62431)2, , �, , 190, 24, , �1, 2, , = 0.1686 × 2.813657 = 0.474, , The critical value at α = 0.05 is 1.96., Do not reject the null hypothesis [Table 1]., Combined test, , χ 2 = (0.473)2 + (0.474)2 = 0.2237 + 0.2250 = 0.449, which is smaller than the critical value 5.99 [Table 5]., Example B, , 0.579945, K3, √ =, √, K2 K2, 3.624310 3.624310, = 0.084052, , Let skewness = g1 =, , 2.214279, K4, =, = 0.168570, 2, 2, (3.624310), K2, �, 6n(n − 1), standard deviation σ (g1 ) =, (n − 2)(n + 1)(n + 3), �, √, 6 × 190 × 189, =, = 0.0310898 = 0.176323, 188 × 191 × 193, �, 24n(n − 1)2, standard deviation σ (g2 ) =, (n − 3)(n − 2)(n + 3)(n + 5), �, 24 × 190 × 1892, = 0.350872, =, 187 × 188 × 193 × 195, kurtosis = g2 =, , 0.084052, 0.168570, = 0.477, u2 =, = 0.480., 0.176323, 0.350872, Critical values for g1 lie between 0.282 (for 200) and 0.301 (for 175) [Table 7]., The right-side critical value for g2 lies between 0.62 and 0.66 [Table 7]., Hence the null hypothesis should not be rejected., , Here u1 =, , 53
Page 63 :
54, , Test 21, , 100 STATISTICAL TESTS, , Dixon’s test for outliers, , Object, To investigate the significance of the difference between a suspicious extreme value, and other values in the sample., Limitations, 1. The sample size should be greater than 3., 2. The population which is being sampled is assumed normal., Method, Consider a sample of size n, where the sample is arranged with the suspect value in, front, its nearest neighbour next and then the following values arranged in ascending (or, descending) order. The order is determined by whether the suspect value is the largest, or the smallest. Denoting the ordered series by x1 , x2 , . . . , xn , the test statistic r where, r, r, r, r, , = (x2 − x1 )/(xn − x1 ), = (x2 − x1 )/(xn−1 − x1 ), = (x3 − x1 )/(xn−1 − x1 ), = (x3 − x1 )/(xn−2 − x1 ), , if, if, if, if, , 3 < n � 7,, 8 � n � 10,, 11 � n � 13,, 14 � n � 25., , Critical values for r can be obtained from Table 8. The null hypothesis that the outlier, belongs to the sample is rejected if the observed value of r exceeds the critical value., Example, As part of a quality control programmed/implementation small samples are taken, at, regular intervals, for a number of processes. On several of these processes there is, the potential for inaccuracies occurring in the measurements that are taken due to the, complexity of the measuring process and the inexperience of the process workers. One, such sample of size 4 is tested for potential outliers and the following are produced:, x1 = 326, x2 = 177, x3 = 176, x4 = 157., Dixon’s ratio yields r = 0.882., The critical value at the 5 per cent level from Table 8 is 0.765, so the calculated value, exceeds the critical value. We thus reject the null hypothesis that the outlier belongs, to the sample. Thus we need to re-sample and measure again or only use three sample, values in this case., Numerical calculation, x1 , = 326, x2 = 177, x3 = 176, x4 = 157, n = 4, x2 − x1, 177 − 326, = 0.882, =, 157 − 326, xn − x 1, The critical value at α = 0.05 is 0.765 [Table 8]., The calculated value exceeds the critical value., Hence reject the null hypothesis that the value x1 comes from the same population., Here r =
Page 64 :
THE TESTS, , 55, , Test 22 F -test for K population means (analysis of, variance), Object, To test the null hypothesis that K samples are from K populations with the same mean., Limitations, It is assumed that the populations are normally distributed and have equal variances. It, is also assumed that the samples are independent of each other., Method, Let the jth sample contain nj elements ( j = 1, . . . , K). Then the total number of, elements is, K, �, , N=, , nj, , j=1, , The ith element of the jth sample can be denoted by xij (i = 1, . . . , nj ), and the mean, of the jth sample becomes, x· j =, , n, �, , xij /nj, , j=1, , The variance of the observations with respect to their own sample means becomes, ��, (xij − x· j )2, s12 =, , i, , j, , N −K, , or equivalently, denoting the total sum of squares of all the observations as sT2 ,, (sT2 − s22 )/(N − K), with N − K degrees of freedom. Similarly, the variance of the sample means with, respect to the grand mean becomes, �, nj (x· j − x· · )2, s22 =, , j, , K −1, , where, x· · =, , 1 ��, xij, K, i, , and s22 has K − 1 degrees of freedom., , j
Page 65 :
56, , 100 STATISTICAL TESTS, , The test statistic is F = s22 /s12 , which follows the F-distribution with (K − 1, N − K), degrees of freedom. A one-tailed test is carried out as it is necessary to ascertain whether, s22 is larger than s12 ., Example, A petroleum company tests three additives on its premium unleaded petrol to assess their, effect on petrol consumption. The company uses a basic car of a particular make and, model with cars randomly allocated to treatments (additives). An analysis of variance, compares the effect of the additives on petrol consumption. Since the calculated F, statistic at 37 is greater than the tabulated value of 4.26 the variance between additives, is greater than the variance within additives. The additives have an effect on petrol, consumption., Numerical calculation, K = 3, N = 12, n1 = 3, n2 = 5, n3 = 4, α = 0.05, n1, �, , xi1 = 53.5,, , i=1, , n2, �, , xi2 = 102.5,, , i=1, , n3, �, , xi3 = 64.4, , i=1, , T = 53.5 + 102.5 + 64.4 = 220.4, x1 = 17.83, x2 = 20.50, x3 = 16.10, x. . = T /N = 18.37, T 2 /N = 4048.01, sT2, , =, , �� n, 1, �, i=1, , 2, xi1, , +, , n2, �, , 2, xi2, , i=1, , +, , n3, �, , �, 2, xi3, , i=1, , T2, −, N, , �, , = [(954.43 + 2105.13 + 1037.98) − 4048.01], = 4097.54 − 4048.01, = 49.53, s22 = 44.17, F2,9 =, =, , s22 /(K − 1), s12 /(N − K), , =, , s22 /(K − 1), (sT2 − s22 )/(N − K), , 44.17/2, � 37, (49.53 − 44.17)/9, , Critical value F2,9; 0.05 = 4.26 [Table 3]., The calculated value is greater than the critical value., The variance between the samples is significantly larger than the variance within the, samples.
Page 66 :
THE TESTS, , 57, , Test 23 The Z-test for correlated proportions, Object, To investigate the significance of the difference between two correlated proportions in, opinion surveys. It can also be used for more general applications., Limitations, 1. The same people are questioned both times on a yes–no basis., 2. The sample size must be quite large., Method, N people respond to a yes–no question both before and after a certain stimulus. The, following two-way table can then be built up:, First poll, Yes, , No, , Second, , Yes, , a, , b, , poll, , No, , c, , d, N, , To decide whether the stimulus has produced a significant change in the proportion, answering ‘yes’, we calculate the test statistic, Z=, where, , �, σ =, , b−c, Nσ, , (b + c) − (b − c)2 /N, ., N(N − 1), , Example, Sampled panels of potential buyers of a financial product are asked if they might buy, the product. They are then shown a product advertisement of 30 seconds duration and, asked again if they would buy the product. Has the advertising stimulus produced a, significant change in the proportion of the panel responding ‘yes’?, We have, First poll, Second, poll, , Yes, , No, , Yes, , 30, , 15, , No, , 9, , 51
Page 67 :
58, , 100 STATISTICAL TESTS, , which yields the test statistic Z = 1.23. The 5 per cent critical value from the normal, distribution is 1.96. Since 1.23 is less than 1.96 we do not reject the null hypothesis of, no difference. The advertisement does not increase the proportion saying ‘yes’. Notice, that we have used a one-tailed test, here, because we are only interested in an increase,, i.e. a positive effect of advertising., Numerical calculation, a = 30, b = 15, c = 9, d = 51, N = 105, The null hypothesis is that there is no apparent change due to the stimulus., The difference in proportion is, 15, 9, 6, b−c, =, −, =, = 0.0571, N, 105 105, 105, �, (15 + 9) − (15 − 9)2 /105, = 0.0465, σ =, 105 × 104, Z=, , 0.0571, = 1.23, 0.0465, , The critical value at α = 0.05 is 1.96 [Table 1]., The calculated value is less than the critical value., Do not reject the null hypothesis.
Page 68 :
THE TESTS, , 59, , Test 24 χ 2 -test for an assumed population variance, Object, To investigate the significance of the difference between a population variance σ 2 and, an assumed value σ02 ., Limitations, It is assumed that the sample is taken from a normal population., Method, The sample variance, n, �, (xi − x̄)2, , s2 =, , i=1, , n−1, , is calculated. The test statistic is then, χ2 =, , s2, (n − 1), σ02, , which follows a χ 2 -distribution with n − 1 degrees of freedom., Example, An engineering process has specified variance for a machined component of 9 square, cm. A sample of 25 components is selected at random from the production and the, mean value for a critical dimension on the component is measured at 71 cm with, sample variance of 12 square cm. Is there a difference between variances? A calculated, chi-squared value of 32 is less than the tabulated value of 36.4 suggesting no difference, between variances., Numerical calculation, n = 25, x̄ = 71, s2 = 12, σ02 = 9, H0 : σ 2 = σ02 , H1 : σ 2 � = σ02, χ 2 = 24 ×, , 12, = 32, 9, , 2, Critical value χ24;, 0.05 = 36.4 [Table 5]., Do not reject the null hypothesis. The difference between the variances is not significant.
Page 69 :
60, , 100 STATISTICAL TESTS, , Test 25 F -test for two counts (Poisson distribution), Object, To investigate the significance of the difference between two counted results (based on, a Poisson distribution)., Limitations, It is assumed that the counts satisfy a Poisson distribution and that the two samples, were obtained under similar conditions., Method, Let µ1 and µ2 denote the means of the two populations and N1 and N2 the two counts., To test the hypothesis µ1 = µ2 we calculate the test statistic, F=, , N1, N2 + 1, , which follows the F-distribution with (2(N2 + 1), 2N1 ) degrees of freedom. When the, counts are obtained over different periods of time t1 and t2 , it is necessary to compare, the counting rates N1 /t1 and N2 /t2 . Hence the appropriate test statistic is, 1, (N1 + 0.5), t, F= 1, 1, (N1 + 0.5), t2, which follows the F-distribution with (2N1 + 1, 2N2 + 1) degrees of freedom., Example, Two automated kiln processes (producing baked plant pots) are compared over their, standard cycle times, i.e. 4 hours. Kiln 1 produced 13 triggered process corrections and, kiln 2 produced 3 corrections. What can we say about the two kiln mean correction, rates, are they the same? The calculated F statistic is 3.25 and the critical value from, Table 3 is 2.32. Since the calculated value exceeds the critical value we conclude that, there is a statistical difference between the two counts. Kiln 1 has a higher error rate, than kiln 2., Numerical calculation, N1 = 13, N2 = 3, t1 = t2, f1 = 2(N2 + 1) = 2(3 + 1) = 8, f2 = 2N1 = 2 × 13 = 26, F=, , 13, N1, =, = 3.25, N2 + 1, 3+1, , Critical value F8,26; 0.05 = 2.32 [Table 3]., The calculated value exceeds the table value., Hence reject the null hypothesis.
Page 70 :
THE TESTS, , 61, , Test 26 F -test for the overall mean of K, subpopulations (analysis of variance), Object, To investigate the significance of the difference between the overall mean of K subpopulations and an assumed value µ0 for the population mean. Two different null, hypotheses are tested; the first being that the K subpopulations have the same mean, (µ1 = µ2 = · · · = µK ) and the second that the overall mean is equal to the assumed, value (µ = µ0 )., Limitations, The K samples from the subpopulations are independent of each other. The subpopulations should also be normally distributed and have the same variance., Methods, Method A, , To test H0 : µ1 = µ2 = · · · = µK , we calculate the test statistic, F=, , s12 /(K − 1), s22 /(N − K), , where N is the total number of observations in the K samples, nj is the number of, observations in the jth sample,, �, ⎫, nj (x· j − x· · )2 ⎪, s12 =, ⎪, ⎬, j, ��, i = 1, . . . , nj , j = 1, . . . , K,, s22 =, (xij − x· j )2 ⎪, ⎪, ⎭, i, , j, , and xij is the ith observation in the jth sample, x· j =, , 1 �, xij, nj, i, , 1 ��, x· · =, xij, N, i, , j, , The value of F should follow the F-distribution with (K −1, N −K) degrees of freedom., Method B, , To test H0 : µ = µ0 , we calculate the test statistic, F=, , N(x· · − µ0 )2, s12 /(K − 1), , which should follow the F-distribution with (1, K − 1) degrees of freedom.
Page 71 :
62, , 100 STATISTICAL TESTS, , Example, A nutritional researcher wishes to test the palatability of six different formulations, of vitamin/mineral supplement which are added to children’s food. They differ only, in their taste. Are they equally palatable? Do they, overall, produce a given average, consumption of food? In a trial, six groups each of five children are given the different, formulations. The first calculated F value of 4.60 tests for equality of palatability. Since, this exceeds the tabulated value of 2.62 the null hypothesis of no difference is rejected., The formulations do affect the palatability of the food eaten since different quantities, are eaten. The second F value of 2.01, since it is less than the tabulated value of 6.61,, suggests that the formulations, if used together over a period of time, will not affect, consumption., Numerical calculation, n1 = n2 = n3 = n4 = n5 = n6 = 5, K = 6, N = 30, µ0 = 1500, x·1 = 1505, x·2 = 1528, x·3 = 1564, x·4 = 1498, x·5 = 1600, x·6 = 1470, x̄· · = 9165/6 = 1527.5, s12 /5 = 11 272, s22 /24 = 2451, sT2 = 3972, N(x· · − µ0 )2 = 22 687.5, (a) F = 11 272/2451 = 4.60., Critical value F5, 24; 0.05 = 2.62 [Table 3]., Reject the null hypothesis., (b) F = 22 687.5/11 272 = 2.01., Critical value F1,5; 0.05 = 6.61 [Table 3]., Do not reject the null hypothesis.
Page 72 :
THE TESTS, , 63, , Test 27 F -test for multiple comparison of contrasts, between K population means, Object, This test is an extension of the preceding one, to investigate which particular set of, mean values or linear combination of mean values shows differences with the other, mean values., Limitations, As for the preceding test, with the addition that the comparisons to be examined should, be decided on at or before the start of the analysis., Method, With the notation as before, we must define a contrast as a linear function of the means, λ=, , K, �, , aj µj, , j=1, , �, under the condition that K, j=1 aj = 0., The test statistic becomes, ⎛, ⎞2, K, �, ⎝, aj x · j ⎠, F=, , 1, s2, , j=1, K, �, , aj2 /nj, , j=1, , (see Test 26) which should follow the F-distribution with (1, N −K) degrees of freedom., Here,, nj, K �, K, �, �, (xij )2 −, nj x̄j2, , s2 =, , j=1 i=1, , j=1, , N −K, , ., , For simple differences of the type x̄· i − x̄· j the test statistic becomes, !�, (x̄· i − x̄· j ), F=, , s2, , 1, 1, +, ni, nj, , �
Page 73 :
64, , 100 STATISTICAL TESTS, , Example, Three different filters are used on an artificial lighting system for plant production. An, agricultural researcher wishes to test whether any filter is better than the others in terms, of the yield of a crop. He designs and conducts his experiment and performs the F test., He compares each plant yield with the others., For comparing filter 1 with filter 2 his calculated F value is 0.646; for comparing, filter 1 with filter 3 his F value is 36.78 and for comparing filter 2 with filter 3 his, F value is 39.90. So it appears that filter 1 and filter 2 are similar in relation to plant, growth but there is a difference between filter 1 and filter 3 and filter 2 and filter 3., Numerical calculation, n1 = 6, n2 = 4, n3 = 2, N = 12, K = 3, ν1 = 1, ν2 = 9, x̄·1 = 2.070, x̄·2 = 2.015, x̄·3 = 2.595, x̄ = 2.139, ��, �, xij2 = 55.5195,, nj x̄j2 = 55.41835, i, , j, , λ1 = µ1 − µ2 , λ2 = µ1 − µ3 , λ3 = µ2 − µ3 (contrasts), x̄·1 − x̄·2 = 0.055, x̄·1 − x̄·3 = −0.525, x̄·2 − x̄·3 = −0.580, (x·1 − x·2 )2, (0.055)2, � = 0.00726, �, �=�, 1, 1, 1 1, +, +, n1, n2, 6 4, (−0.525)2, (x·1 − x·3 )2, � = 0.4134, �, �= �, 1, 1, 1 1, +, +, n1, n3, 6 2, (−0.580)2, (x·2 − x·3 )2, � = 0.4485, �, �= �, 1, 1, 1 1, +, +, n2, n3, 4 2, 0.10115, 55.5195 − 55.41835, s2 =, =, = 0.01124, 9, 9, 0.00726, 0.4134, 0.4485, F1 =, = 0.646, F2 =, = 36.78, F3 =, = 39.90, 0.01124, 0.01124, 0.01124, Critical value F1,9;0.05 = 5.12 [Table 3]. Both F2 and F3 are larger than 5.12. There, is no significant difference between the means for group 1 and group 2, but there is a, significant difference between group 3 and groups 1 and 2.
Page 74 :
THE TESTS, , 65, , Test 28 Tukey test for multiple comparison of K, population means (unequal sample sizes), Object, To investigate the significance of all possible differences between K population means., Limitations, The K populations are normally distributed with equal variances., Method, Consider samples of size n1 , n2 , . . . , nK from the K populations. From Table 9 the, critical values of q can be found using degrees of freedom, ⎞, ⎛, K, �, nj ⎠ − K., ν=⎝, j=1, , The total variance of the samples is now calculated from, K, �, (nj − 1) · sj2, , s2 =, , j=1, , N −K, , where sj2 is the variance of the jth sample and N is the total sample size. Finally, a limit, W is calculated, qs, W= 1, n2, where q (= w/s) is the Studentized range and, n= �, , K, �., 1, 1, 1, +, + ··· +, n1, n2, nK, , If this limit W is exceeded by the absolute difference between any two sample means,, then the corresponding population means differ significantly., Example, Five different grades of grit used for agricultural purposes are produced. A filling, machine fills small sacks with a nominal 500 gm weight, although more is usually dispensed. An agricultural merchant is concerned that the weight does not differ between, grades. He uses Tukey’s test to compare all five grades and produces a critical limit of, W at 55.3. Since the largest difference grades is 35.8 and is less than 55.17 he concludes, that the grades do not differ with respect to weight.
Page 75 :
66, , 100 STATISTICAL TESTS, , Numerical calculation, n1 = n2 = n3 = n4 = n5 = 5, K = 5, N = 25, s12 = 406.0, s22 = 574.8, s32 = 636.8, s42 = 159.3, s52 = 943.2, x̄1 = 534.0, x̄2 = 536.4, x̄3 = 562.6, x̄4 = 549.4, x̄5 = 526.8, s2 =, , 2720.1, = 544.02, s = 23.32, ν = 25 − 5 = 20, 5, , Critical value for q for K = 5, and ν = 20 at α = 0.05 is 5.29 [Table 9]., W=, , 5.29 × 23.32, = 55.17, √, 5, , The largest difference between the sample means is 562.6 − 526.8 = 35.8 which is less, than 55.17. Hence the population means do not differ significantly.
Page 76 :
THE TESTS, , 67, , Test 29 The Link–Wallace test for multiple, comparison of K population means, (equal sample sizes), Object, To investigate the significance of all possible differences between K population means., Limitations, 1. The K populations are normally distributed with equal variances., 2. The K samples each contain n observations., Method, The test statistic is, KL =, , nw(x̄), k, �, , wi (x), , i=1, , where wi (x) is the range of the x values for the ith sample, w(x̄) is the range of the sample means, n is the sample size., The null hypothesis µ1 = µ2 = · · · = µK is rejected if the observed value of KL is, larger than the critical value obtained from Table 10., Example, Three advertising theme tunes are compared using three panels to assess their pleasure,, using a set of scales. The test statistic D is computed as 2.51, and then the three, differences between the ranges of means are also calculated. Tunes 3 and 2 differ as do, tunes 3 and 1, but tunes 1 and 2 do not., Numerical calculation, n = 8, w1 (x) = 7, w2 (x) = 6, w3 (x) = 4, K = 3, w1 (x̄) = 4.750, w2 (x̄) = 4.625, w3 (x̄) = 7.750, KL =, , nw(x̄), k, �, , =, , 8(7.750 − 4.625), = 1.47, 7+6+4, , wi (x), , i=1, , Critical value K8,3;0.05 = 1.18 [Table 10]., Reject the null hypothesis of equal means.
Page 78 :
THE TESTS, , 69, , Test 30 Dunnett’s test for comparing K treatments, with a control, Object, To investigate the significance of the differences, when several treatments are compared, with a control., Limitations, 1. The K + 1 samples, consisting of K treatments and one control, all have the same, size n., 2. The samples are drawn independently from normally distributed populations with, equal variances., Method, The variance within the K + 1 groups is calculated from, 2, SW, =, , S02 + S12 + · · · + SK2, (K − 1)(n − 1), , where S02 is the sum of squares of deviations from the group mean for the control group, and Sj2 is a similar expression for the jth treatment group. The standard deviation of the, differences between treatment means and control means is then, S(d̄) =, , ", 2 /n, 2SW, , The quotients, Dj =, , x̄j − x̄0, S(d̄), , ( j = 1, 2, . . . , K), , are found and compared with the critical values of |Dj | found from Table 11. If, an observed value is larger than the tabulated value, one may conclude that the, corresponding difference in means between treatment j and the control is significant., Example, Four new topical treatments for athlete’s foot are compared with a control, which is, the current accepted treatment. Patients are randomly allocated to each treatment and, the number of days to clear up of the condition is the treatment outcome. Do the new, treatments differ from the control? The critical value, D, from Table 11 is 2.23 and all, standardized differences are compared. Treatment 1 shows a difference from control, which is significant. This treatment results in a longer time to clear up.
Page 79 :
70, , 100 STATISTICAL TESTS, , Numerical calculation, K = 4, n = 10, x̄0 = 14.5, x̄1 = 25.0, x̄2 = 15.7, x̄3 = 18.1, x̄4 = 21.9, S02 = 261.0, S12 = 586.0, S22 = 292.6, S32 = 320.4, S42 = 556.4, 261 + 586 + 292.6 + 320.4 + 556.4, = 74.681, (4 − 1)(10 − 1), �1, �, ", 2 × 74.681 2, 2, = 3.865, S(d̄) = 2SW /n =, 10, 2, SW, =, , Critical value D4,45;0.05 = 2.23 [Table 11]., D1 = 2.72, D2 = 0.31, D3 = 0.93, D4 = 1.91, The value of D1 is larger than the critical value. Hence D1 is significantly different, from the control value.
Page 80 :
THE TESTS, , Test 31, , 71, , Bartlett’s test for equality of K variances, , Object, To investigate the significance of the differences between the variances of K normally, distributed populations., Limitations, It is assumed that all the populations follow a normal distribution., Method, Samples are drawn from each of the populations. Let sj2 denote the variance of a sample, of nj items from the jth population ( j = 1, . . . , K). The overall variance is defined by, K, �, (nj − 1) · sj2, , s2 =, , j=1, K, �, (nj − 1), , ., , j=1, , The test statistic is, B=, where, , $, �, 2.30259 #�, (nj − 1) log sj2, (nj − 1) log s2 −, C, , ��, �, 1, 1, 1, C =1+, −�, (nj − 1), 3(K + 1), (nj − 1), , and loge 10 = 2.30259., Case A (nj > 6), , B will approximate to a χ 2 -distribution with K − 1 degrees of freedom. The null, hypothesis of equal variances is rejected if B is larger than the critical value., Case B (nj � 6), , The test statistic becomes BC = M and this should be referred to Table 12. When the, value of M exceeds the tabulated value, the null hypothesis can be rejected., Example, A bank of four machining heads is compared in relation to the variability of the end, machined components. A quality engineer has collected a randomized sequence of, components and measured the relevant component dimensions. In his first test he has, large samples and computes the test statistic B, which is 7.31. This is less than the, critical value of 7.81 from Table 5. He so concludes that the variabilities for the four, machine heads are the same.
Page 81 :
72, , 100 STATISTICAL TESTS, , In a subsequent test of equality of variances the engineer takes smaller samples which, necessitate his use of tables for comparison. In this case his sample values produce an, M value which is less than the tabulated value of 9.21 from Table 12. So again he, concludes that the variances are the same., Numerical calculation, Example A, , n1 = 31, n2 = 15, n3 = 20, n4 = 42, K = 4, s12 = 5.47, s22 = 4.64, s32 = 11.47, s42 = 11.29, 910, s2 =, = 8.75, log s2 = 0.94201, C = 1.01, 104, �, �, (nj − 1) log s2 = 97.9690,, (nj − 1) log sj2 = 94.7630, B=, , 1, 7.38, [2.30259(97.9690 − 94.7630)] =, = 7.31, 1.01, 1.01, , 2, = 7.81 [Table 5]., Critical value χ3;0.05, Hence the null hypothesis is not rejected., , Example B, , n1 = 3, n2 = 3, n3 = 3, n4 = 4, s12 = 6.33, s22 = 1.33, s32 = 4.33, s42 = 4.33, Pooled variance s2 =, , (12.66 + 2.66 + 8.66 + 12.99), = 4.11, 2+2+2+3, , Further, M = 2.30259{9 log 4.11 − 2 log 6.33 − 2 log 1.33 − 2 log 4.33 − 3 log 4.33}, = 2.30259{9 × 0.6138 − 2 × 0.8014 − 2 × 0.1239 − 2 × 0.6365, − 3 × 0.6365} = 1.131, #, $, C = 21 + 21 + 21 + 13 − 19 = 1.7222, The critical value of M for α = 0.05, K = 4 is 9.21 [Table 12]; even for C = 2.0. Do, not reject the null hypothesis.
Page 82 :
THE TESTS, , Test 32, , 73, , Hartley’s test for equality of K variances, , Object, To investigate the significance of the differences between the variances of K normally, distributed populations., Limitations, 1. The populations should be normally distributed., 2. The sizes of the K samples should be (approximately) equal., Method, 2 /s2, Samples are drawn from each of the populations. The test statistic is Fmax = smax, min, 2, 2, where smax, is the largest of the K sample variances and smin, is the smallest of the K, sample variances., Critical values of Fmax can be obtained from Table 13. If the observed ratio exceeds, this critical value, the null hypothesis of equal variances should be rejected., , Example, Four types of spring are tested for their response to a fixed weight since they are used, to calibrate a safety shut-off device. It is important that the variability of responses, is equal. Samples of responses to a weight on each spring are taken. The Hartley F, statistic is calculated to be 2.59 and is compared with the critical tabulated value of, 2.61 [Table 13]. Since the calculated statistic is less than the tabulated value the null, hypothesis of equal variances is accepted., Numerical calculation, n1 = n2 = n3 = n4 = 30, K = 4, s12 = 16.72, s22 = 36.27, s32 = 14.0, s42 = 15.91, F=, , 36.27, = 2.59, 14.0, , The critical value of Fmax , at a 5 per cent level of significance, for n = 30, K = 4 is, 2.61 [Table 13]., Hence do not reject the null hypothesis.
Page 83 :
74, , 100 STATISTICAL TESTS, , Test 33 The w/s-test for normality of a population, Object, To investigate the significance of the difference between a frequency distribution based, on a given sample and a normal frequency distribution., Limitations, This test is applicable if the sample is taken from a population with continuous, distribution., Method, This is a much simpler test than Fisher’s cumulant test (Test 20). The sample standard, deviation (s) and the range (w) are first determined. Then the Studentized range q = w/s, is found., The test statistic is q and critical values are available for q from Table 14. If the, observed value of q lies outside the two critical values, the sample distribution cannot, be considered as a normal distribution., Example, For this test of normality we produce the ratio of sample range divided by sample, standard deviation and compare with critical values from Table 14., We have two samples for consideration. They are taken from two fluid injection, processes. The two test statistics, q1 and q2 , are both within their critical values. Hence, we accept the null hypothesis that both samples could have been taken from normal, distributions. Such tests are particularly relevant to quality control situations., Numerical calculation, n1 = 4, n2 = 9, x̄1 = 3166, x̄2 = 2240.4, α = 0.025, s12 = 6328.67, s22 = 221 661.3, s1 = 79.6, s2 = 471, w1 = 171, w2 = 1333, w1, w2, q1 =, = 2.15, q2 =, = 2.83, s1, s2, Critical values for this test are:, for n1 = 4, 1.93 and 2.44 [Table 14];, for n2 = 9, 2.51 and 3.63 [Table 14]., Hence the null hypothesis cannot be rejected.
Page 84 :
THE TESTS, , Test 34, , 75, , Cochran’s test for variance outliers, , Object, To investigate the significance of the difference between one rather large variance and, K − 1 other variances., Limitations, 1. It is assumed that the K samples are taken from normally distributed populations., 2. Each sample is of equal size., Method, The test statistic is, C=, , largest of the si2, sum of all si2, , where si2 denotes the variance of the ith sample. Critical values of C are available from, Table 15. The null hypothesis that the large variance does not differ significantly from, the others is rejected if the observed value of C exceeds the critical value., Example, In a test for the equality of k means (analysis of variance) it is assumed that the k, populations have equal variances. In this situation a quality control inspector suspects, that errors in data recording have led to one variance being larger than expected. She, performs this test to see if her suspicions are well founded and, therefore, if she needs, to repeat sampling for this population (a machine process line). Her test statistic, C =, 0.302 and the 5 per cent critical value from Table 15 is 0.4241. Since the test statistic, is less than the critical value she has no need to suspect data collection error since the, largest variance is not statistically different from the others., Numerical calculation, s12 = 26, s22 = 51, s32 = 40, s42 = 24, s52 = 28, n1 = n2 = n3 = n4 = n5 = 10, K = 5, ν = n − 1 = 9, C=, , 51, = 0.302, 26 + 51 + 40 + 24 + 28, , Critical value C9;0.05 = 0.4241 [Table 15]., The calculated value is less than the critical value., Do not reject the null hypothesis.
Page 85 :
76, , 100 STATISTICAL TESTS, , Test 35 The Kolmogorov–Smirnov test for goodness, of fit, Object, To investigate the significance of the difference between an observed distribution and, a specified population distribution., Limitations, This test is applicable when the population distribution function is continuous., Method, From the sample, the cumulative distribution Sn (x) is determined and plotted as a step, function. The cumulative distribution F(x) of the assumed population is also plotted, on the same diagram., The maximum difference between these two distributions, D = |F − Sn |, provides the test statistic and this is compared with the value D(α) obtained from, Table 16., If D > Dα the null hypothesis that the sample came from the assumed population is, rejected., Example, As part of the calibration of a traffic flow model, a traffic engineer has collected a large, amount of data. In one part of his model he wishes to test an assumption that traffic, arrival at a particular road intersection follows a Poisson model, with mean 7.6 arrivals, per unit time interval. Can he reasonably assume that this assumption is true?, His test statistic, maximum D is 0.332 and the 5 per cent critical value from, Table 16 is 0.028. So he cannot assume such an arrival distribution and must seek, another to use in his traffic model. Without a good distributional fit his traffic model, would not produce robust predictions of flow., Numerical calculation, To test the hypothesis that the data constitute a random sample from a Poisson population, with mean 7.6., e−λ λx, , λ = 7.6, n = 3366, x!, cu(xi ), e−7.6 7.66, Sn (xi ) =, , F(xi ) =, = 0.3646 etc., 3366, 6!, , F(x) =
Page 86 :
THE TESTS, No., , 1, , 2, , 3, , 4, , 5, , 6, , 7, , 8, , 77, 9, , 10, , 11, , 12, , 13 14, , xi, 5, 14, 24, 57, 111, 197, 278, 378, 418, 461, 433, 413, 358, 219, 5, 19, 43, 100, 211, 408, 686 1064 1482 1943 2376 2789 3147 3366, cu(xi ), Sn (xi ) 0.001 0.005 0.012 0.029 0.062 0.121 0.204 0.316 0.440 0.577 0.705 0.828 0.935 1.0, F(xi ) 0.004 0.009 0.055 0.125 0.231 0.365 0.510 0.648 0.765 0.854 0.915 0.954 0.976 0.989, D, 0.003 0.014 0.043 0.096 0.169 0.244 0.306 0.332 0.325 0.277 0.210 0.126 0.041 0.011, , 1.63, 1.63, = 0.028 where D > Dα [Table 16]., max D = 0.332, D14;0.01 = √, =, 58.01, 3366, The hypothesis may be rejected.
Page 87 :
78, , 100 STATISTICAL TESTS, , Test 36 The Kolmogorov–Smirnov test for comparing, two populations, Object, To investigate the significance of the difference between two population distributions,, based on two sample distributions., Limitations, The best results are obtained when the samples are sufficiently large – say, 15 or over., Method, Given samples of size n1 and n2 from the two populations, the cumulative distribution functions Sn1 (x) and Sn2 (y) can be determined and plotted. Hence the maximum, value of the difference between the plots can be found and compared with a critical, value obtained from Table 16. If the observed value exceeds the critical value the null, hypothesis that the two population distributions are identical is rejected., Example, A quality control engineer uses an empirical distribution as a calibration for a particular, machining process. He finds that he has better results using this than any other theoretical, model. He compares his sample via the Kolmogorov–Smirnov test statistic d = 0.053., Since this is less than the 5 per cent critical value of Table 16 he can assume that both, samples came from the same population., Numerical calculation, n1 − n2 = n = 10, Sample x, cu(x), , 0.6, 0.6, , 1.2, 1.8, , 1.6, 3.4, , 1.7, 5.1, , 1.7, 6.8, , 2.1, 8.9, , 2.8, 11.7, , 2.9, 14.6, , 3.0, 17.6, , 3.2, 20.8, , Sample y, cu(y), , 2.1, 2.1, , 2.3, 4.4, , 3.0, 7.4, , 3.1, 10.5, , 3.2, 13.7, , 3.2, 16.9, , 3.5, 20.4, , 3.8, 24.2, , 4.6, 28.8, , 7.2, 36.0, , Sn1 (x), Sn2 (y), , 0.029 0.086 0.163, 0.058 0.122 0.205, , 0.245, 0.291, , 0.327, 0.380, , 0.428, 0.469, , 0.562, 0.566, , 0.702, 0.672, , 0.846, 0.800, , 1.0, 1.00, , Difference D 0.029 0.036 0.042, , 0.046, , 0.053, , 0.041, , 0.004, , 0.03, , 0.046, , 0, , max D = 0.053, Critical value D20;0.01 = 0.356 [Table 16]., Do not reject the hypothesis. Both samples come from the same population.
Page 88 :
THE TESTS, , 79, , Test 37 The χ 2 -test for goodness of fit, Object, To investigate the significance of the differences between observed data arranged in K, classes, and the theoretically expected frequencies in the K classes., Limitations, 1. The observed and theoretical distributions should contain the same number of, elements., 2. The division into classes must be the same for both distributions., 3. The expected frequency in each class should be at least 5., 4. The observed frequencies are assumed to be obtained by random sampling., Method, The test statistic is, χ2 =, , K, �, (Oi − Ei )2, i=1, , Ei, , where Oi and Ei represent the observed and theoretical frequencies respectively for each, of the K classes. This statistic is compared with a value obtained from χ 2 tables with, ν degrees of freedom. In general, ν = K − 1. However, if the theoretical distribution, contains m parameters to be estimated from the observed data, then ν becomes K −1−m., For example, to fit data to a normal distribution may require the estimation of the mean, and variance from the observed data. In this case ν would become K − 1 − 2., If χ 2 is greater than the critical value we reject the null hypothesis that the observed, and theoretical distributions agree., Example, The experiment of throwing a die can be regarded as a general application and numerous, specific situations can be postulated. In this case we have six classes or outcomes, each, of which is equally likely to occur. The outcomes could be time (10 minute intervals), of the hour for an event to occur, e.g. failure of a component, choice of supermarket, checkout by customers, consumer preferences for one of six types of beer, etc. Since, the calculated value is less than the critical value from the table it can be reasonably, assumed that the die is not biased towards any side or number. That is, it is a fair die., The outcomes are equally likely., Numerical calculation, A die is thrown 120 times. Denote the observed number of occurrences of i by Oi ,, i = 1, . . . , 6. Can we consider the die to be fair at the 5 per cent level of significance?, K = 6, ν = 6 − 1, O1 = 25, O2 = 17, O3 = 15, O4 = 23, O5 = 24, O6 = 16
Page 89 :
80, , 100 STATISTICAL TESTS, , E1 = 20, E2 = 20, E3 = 20, E4 = 20, E5 = 20, E6 = 20, χ2 =, , 9, 25, 9, 16 16, 25, +, +, +, +, +, = 5.0, 20 20 20 20 20 20, , 2, = 11.1 [Table 5]., Critical value χ5;0.05, The calculated value is less than the critical value., Hence there are no indications that the die is not fair.
Page 90 :
THE TESTS, , 81, , Test 38 The χ 2 -test for compatibility of K counts, Object, To investigate the significance of the differences between K counts., Limitations, The counts must be obtained under comparable conditions., Method, Method (a) Times for counts are all equal, , Let the ith count be denoted by Ni . Then the null hypothesis is that Ni = constant, for, i = 1, . . . , K. The test statistic is, χ2 =, , K, �, (Ni − N̄)2, i=1, , N̄, , �, where N̄ is the mean of the K counts K, i=1 Ni /K. This is compared with a value, obtained from χ 2 tables with K − 1 degrees of freedom. If χ 2 exceeds this value the, null hypothesis is rejected., Method (b) Times for counts are not all equal, , Let the time to obtain the ith count be ti . The test statistic becomes, χ2 =, , K, �, (Ni − ti R̄)2, i=1, , where R̄ =, , �, , Ni /, , �, , ti R̄, , ti . This is compared with Table 5 as above., , Example, A lime producing rotary kiln is operated on a shift-based regime with four shift workers., A training system is to be adopted and it is desired to have some idea about how the, workers operate in terms of out-of-control warning alerts. Do all the four shift workers, operate the kiln in a similar way? The number of alerts over a full shift is recorded and, the test statistic is calculated. Do the four workers operate the kiln in a similar way? The, answer to this question has bearing on the sort of training that could be implemented, for the workers., The chi-squared test statistic is 13.6 and the 5 per cent critical value of the chi-squared, distribution from Table 5 is 7.81. Since the calculated chi-squared value exceeds the, 5 per cent critical value we reject the null hypothesis that the counts are effectively, the same and conclude that the four counts are not consistent with each other. The, four workers operate the kiln differently. Hence different training schemes may be, appropriate.
Page 91 :
82, , 100 STATISTICAL TESTS, , Numerical calculation, N1 = 5, N2 = 12, N3 = 18, N4 = 19, N̄ = 11, ν = K − 1 = 4 − 1 = 3, Using method (a), χ 2 = 13.6., 2, = 7.81 [Table 5]., The critical value χ3;0.05, Hence reject the null hypothesis. The four counts are not consistent with each other.
Page 92 :
THE TESTS, , 83, , Fisher’s exact test for consistency in a 2 × 2, , Test 39, table, Object, , To investigate the significance of the differences between observed frequencies for two, dichotomous distributions., Limitations, This test is applicable if the classification is dichotomous and the elements originate, from two sources. It is usually applied when the number of elements is small or the, expected frequencies are less than 5., Method, A 2 × 2 contingency table is built up as follows:, , Sample 1, Sample 2, Total, , Class 1, , Class 2, , Total, , a, c, , b, d, , a+b, c+d, , a+c, , b+d, , n=a+b+c+d, , The test statistic is, �, , p=, , (a + b)!(c + d)!(a + c)!(b + d)! �, 1, n!, ai !bi !ci !di !, i, , where the summation is over all possible 2 × 2 schemes with a cell frequency equal, to or smaller than the smallest experimental frequency (keeping the row and column, totals�fixed as above)., If p is less than the significance level chosen, we may reject the null hypothesis of, independence between samples and classes, i.e. that the two samples have been drawn, from one common population., Example, A medical officer has data from two groups of potential airline pilot recruits. Two, different reaction tests have been used in selection of the potential recruits. He uses a, more sophisticated test and finds the results given for the two samples. Class 1 represents quick reactions and class 2 represents less speedy reactions. Is there a difference, between the two selection tests?, Since some cell frequencies are less than 5 the medical officer uses Fisher’s exact, test, which produces a probability of 0.156. This is greater than 0.05 (our usual level), so the medical officer does not reject the null hypothesis of no difference between the, selection tests.
Page 93 :
84, , 100 STATISTICAL TESTS, , Numerical calculation, class 1 = accepted, class 2 = rejected, significance level α = 0.05, a = 9, b = 2, c = 7, d = 6, a + b = 11, c + d = 13, a + c = 16, b + d = 8, Two possible sets of data which deviate more from the null hypothesis are a = 10,, b = 1, c = 6, d = 7 and a = 11, b = 0, c = 5, d = 8., We add the three probabilities of the three schemes according to hyper-geometric, distributions. This gives, �, �, �, 1, 1, 1, 11! 13! 16! 8!, +, +, = 0.156., p=, 24!, 2! 6! 7! 9! 1! 6! 7! 10! 0! 5! 8! 11!, This is greater than 0.05. Do not reject the null hypothesis.
Page 94 :
THE TESTS, , 85, , Test 40 The χ 2 -test for consistency in a 2 × 2 table, Object, To investigate the significance of the differences between observed frequencies for two, dichotomous distributions., Limitations, It is necessary that the two sample sizes are large enough. This condition is assumed, to be satisfied if the total frequency is n > 20 and if all the cell frequencies are greater, than 3. When continuous distributions are applied to discrete values one has to apply, Yates’ correction for small sample sizes., Method, When two samples are each divided into two classes the following 2 × 2 table can be, built up:, Class 1, , Class 2, , Total, , a, c, , b, d, , a+b, c+d, , a+c, , b+d, , n=a+b+c+d, , Sample 1, Sample 2, Total, The test statistic is, χ2 =, , (n − 1)(ad − bc)2, ., (a + b)(a + c)(b + d)(c + d), , This is compared with a value obtained from χ 2 tables with 1 degree of freedom. If, χ 2 exceeds the critical value the null hypothesis of independence between samples and, classes is rejected. In other words, the two samples were not drawn from one common, population., Example, In this case the medical officer (in Test 39) has a larger sample and can use the chisquared test., He obtains a chi-squared value of 4.79 which is greater than the tabulated value of, 2.7 from Table 5. Hence he rejects the null hypothesis and now concludes that the two, selection methods do produce when compared with the sophisticated reaction test., Numerical calculation, a = 15, b = 85, c = 4, d = 77, a + b = 100, c + d = 81, a + c = 19, b + d = 162, 2, = 2.7, n = 181 [Table 5], α = 0.10, ν = 1, χ1;0.10, 180(15 × 77 − 4 × 85)2, = 4.79, 100 × 81 × 19 × 162, Hence reject the null hypothesis, H0 ., χ2 =
Page 95 :
86, , 100 STATISTICAL TESTS, , Test 41 The χ 2 -test for consistency in a K × 2 table, Object, To investigate the significance of the differences between K observed frequency, distributions with a dichotomous classification., Limitations, It is necessary that the K sample sizes are large enough. This is usually assumed to be, satisfied if the cell frequencies are equal to 5., Method, When the observations in K samples are divided into two classes the following K × 2, table can be built up:, Class 1, , Class 2, , Total, , Sample 1, .., ., , x1, .., ., , n1 − x1, .., ., , n1, .., ., , Sample i, .., ., , xi, .., ., , Sample K, , xK, , Total, , x=, , K, �, , ni − x i, .., ., , ni, .., ., , nK − xK, , nK, , n−x, , xi, , n=, , i=1, , K, �, , ni, , i=1, , The test statistic is, n2, χ2 =, x(n − x), , ��, , K, �, x2, i, , i=1, , ni, , �, , �, −, , x2, n, , ��, ., , This is compared with a value obtained from χ 2 tables with K − 1 degrees of freedom. The null hypothesis of independence between samples and classes is rejected if, χ 2 exceeds the critical value., Example, Our medical officer (as in Test 39) now has four different colour-blindness selection, tests and wishes to see if they produce differences when compared with the recruitment, standards. Her data produce a chi-squared value of 5.495 compared with the tabulated, value of 5.99. She does not rejects the null hypothesis and concludes that the colour, blindness tests do not differ in their outcome.
Page 97 :
88, , 100 STATISTICAL TESTS, , Test 42 The Cochran test for consistency in an n × K, table of dichotomous data, Object, To investigate the significance of the differences between K treatments on the same n, elements with a binomial distribution., Limitations, 1. It is assumed that there are K series of observations on the same n elements., 2. The observations are dichotomous and the observations in the two classes are, represented by 0 or 1., 3. The number of elements must be sufficiently large – say, greater than 10., Method, From the n × K table, let Ri denote the row totals (i = 1, . . . , n) and, � the, �Cj denote, column totals ( j = 1, . . . , K). Let S denote the total score, i.e. S = i Ri = j Cj ., The test statistic is, �, �, K(K − 1), (Cj − C̄)2, Cj, Q=, , j, , KS −, , �, , where C̄ =, , Ri2, , j, , K, , ., , i, , This approximately follows a χ 2 -distribution with K − 1 degrees of freedom., The null hypothesis that the K samples come from one common dichotomous, distribution is rejected if Q is larger than the tabulated value., Example, A panel of expert judges assess whether each of four book cover formats is acceptable, or not. Each book cover format, therefore, receives an acceptability score. The Cochran, Q statistic is calculated as 12.51, which is larger than the tabulated chi-squared value of, 7.81 [Table 5]. It seems that the book covers are not equally acceptable to the judges., Numerical calculation, K = 4, C1 = 12, C2 = 8, C3 = 6, C4 = 3,, �, �, Ri = 29, C̄ = 7.25, Ri2 = 75, 2, α = 0.05, ν = 3, χ3;0.05, = 7.81 [Table 5], Q=, , 513, 4(3 × 253 − 292 ), =, = 12.51, 4 × 29 − 75, 41, , Hence reject the null hypothesis., , �, , Ci2 = 253
Page 98 :
THE TESTS, , 89, , Test 43 The χ 2 -test for consistency in a 2 × K table, Object, To investigate the significance of the differences between two distributions based on, two samples spread over K classes., Limitations, 1. The two samples are sufficiently large., 2. The K classes when put together form a complete series., Method, The 2 × K table can be described symbolically by the following table:, 1, , 2, , ..., , Sample 1, Sample 2, , n11, n21, , n12, n22, , ..., ..., , Total, , n·1, , n·2, , ..., , Class, j, , ..., , K, , Total, , n1j, n2j, , ..., ..., , n1K, n2K, , N1, N2, , n·j, , ..., , n·K, , N1 + N2, , where nij represents the frequency of individuals in the ith sample in the jth class, (i = 1, 2 and j = 1, . . . , K). Another table of expected frequencies is now calculated, where the value in the ith row and jth column is, eij =, , Ni n·j, ., N1 + N 2, , The test statistic is, χ2 =, , K, �, (n1j − e1j )2, j=1, , e1j, , +, , K, �, (n2j − e2j )2, j=1, , e2j, , ., , This is compared with the value obtained from a χ 2 table with K −1 degrees of freedom., If χ 2 exceeds this critical value, the null hypothesis that the two samples originate from, two populations with the same distribution is rejected., Example, Our medical officer from Tests 39 and 40 now wishes to have a third (or middle), class which represents a reserve list of potential recruits who do not quite satisfy the, stringent class1 requirements. She can still use the chi-squared test to compare the, reaction selection tests. Her data produce a chi-squared value of 4.84, which is less, than the tabulated critical value of 5.99. She concludes that the reaction tests do not, differ when a third classification of an intermediate reaction is introduced.
Page 99 :
90, , 100 STATISTICAL TESTS, , Numerical calculation, n11 = 50, n12 = 47, n13 = 56, n21 = 5, n22 = 14, n23 = 8, n·1 = 55, n·2 = 61, n·3 = 64, N1 = 153, N2 = 27, N = 180, e11 = 46.75, e12 = 51.85, e13 = 54.40, e21 = 8.25, e22 = 9.15, e23 = 9.60, 2, = 5.99 [Table 5], α = 0.05, ν = (3 − 1)(2 − 1) = 2, χ2;0.05, χ2 =, , (−4.85)2, 1.62, (−3.25)2, 4.852, (−1.6)2, 3.252, = 4.84, +, +, +, +, +, 9.60, 46.75, 51.85, 54.40, 8.25, 9.15, , Do not reject the null hypothesis.
Page 100 :
THE TESTS, , 91, , Test 44 The χ 2 -test for independence in a p × q table, Object, To investigate the difference in frequency when classified by one attribute after, classification by a second attribute., Limitations, The sample should be sufficiently large. This condition will be satisfied if each cell, frequency is greater than 5., Method, The sample, of size N, can be categorized into p classes by the first attribute and into, q classes by the second. The frequencies of individuals in each classification can be, shown symbolically by the table:, , Second, attribute, , First attribute, ..., i, , 1, , 2, , ..., , p, , Total, , 1, 2, .., ., , n11, n12, .., ., , n21, n22, .., ., , ..., ..., , ni1, ni2, .., ., , ..., ..., , np1, np2, .., ., , n·1, n·2, .., ., , j, .., ., , n1j, .., ., , n2j, .., ., , ..., , nij, .., ., , ..., , npj, .., ., , n·j, .., ., , q, , n1q, , n2q, , ..., , niq, , ..., , npq, , n·q, , Total, , n1·, , n2·, , ..., , ni·, , ..., , np·, , N, , The test statistic is, χ2 =, , q, p �, �, (nij − ni· n·j /N)2, i=1 j=1, , ni· n·j /N, , which follows a χ 2 distribution with (p − 1)(q − 1) degrees of freedom. If χ 2 exceeds, the critical value then the null hypothesis that the two attributes are independent of each, other is rejected., Example, An educational researcher has collected data on parents’ preferences for their children’s, education. There are three categories of parents’ educational achievement level (1, low;, 2, medium; 3, high) and two levels for preferences (1, yes; 2, no). She calculates a, chi-squared value of 10.67 and compares this with a value of 5.99 from the table. She,, therefore, rejects the null hypothesis and concludes that parents’ preferences vary with, their own educational achievement.
Page 101 :
92, , 100 STATISTICAL TESTS, , Numerical calculation, n11 = 32, n21 = 12, n12 = 14, n22 = 22, n13 = 6, n23 = 9, n1· = 52, n2· = 43, n·1 = 44, n·2 = 36, n·3 = 15, N = 95, 2, = 5.99 [Table 5], α = 0.05, ν = (3 − 1)(2 − 1) = 2, χ2;0.05, χ2 =, , (−7.9)2, (−5.7)2, (5.7)2, (−2.2)2, 2.22, 7.92, +, +, +, +, +, = 10.67, 24.1, 19.9, 19.7, 16.3, 8.2, 6.8, , Hence reject the null hypothesis.
Page 102 :
THE TESTS, , 93, , Test 45 The sign test for a median, Object, To investigate the significance of the difference between a population median and a, specified value M0 ., Limitations, It is assumed that the observations in the sample are independent of each other. Any, sample values equal to M0 should be discarded from the sample., Method, A count is made of the number n1 of sample values exceeding M0 , and also of the, number n2 below M0 . The null hypothesis is that the population median equals M0 . If, the alternative hypothesis is that the population median does not equal M0 then the test, statistic, T , is the smaller of n1 and n2 with n taken as the sum of n1 and n2 ., If the alternative hypothesis is that the population median is greater than M0 , then, T = n1 . If the alternative hypothesis is that the population median is greater than M0 ,, then T = n2 . The null hypothesis is rejected if T is greater than the critical value, obtained from Table 17., Example, It is assumed that the median value of a financial ratio is 0.28; this being the recycled, material cost for new build domestic constructions. A random sample of ten new builds, is taken and the ratios computed. Can it be assumed that the sample has been taken, from a population of ratios with median 0.28? Since the calculated T value of 4 is less, than the critical value of 7 (from Table 17) this assumption is accepted., Numerical calculation, Sample values x1 = 0.28, x2 = 0.18, x3 = 0.24, x4 = 0.30, x5 = 0.40, x6 = 0.36, x7 = 0.15, x8 = 0.42, x9 = 0.23, x10 = 0.48, Null hypothesis: H0 = 0.28, n1 = 5, n2 = 4, T = 4, n = 5 + 4 = 9, The critical value at α = 0.05 is 7 [Table 17]., Hence do not reject the null hypothesis.
Page 103 :
94, , 100 STATISTICAL TESTS, , Test 46 The sign test for two medians (paired, observations), Object, To investigate the significance of the difference between the medians of two distributions., Limitations, The observations in the two samples should be taken in pairs, one from each distribution., Each one of a pair of observations should be taken under the same conditions, but it is, not necessary that different pairs should be taken under similar conditions., It is not necessary to take readings provided the sign of the difference between two, observations of a pair can be determined., Method, The signs of the differences between each pair of observations are recorded. The test, statistic, r, is the number of times that the least frequent sign occurs. If this is less than, the critical value obtained from Table 18 the null hypothesis that the two population, medians are equal is rejected., Example, A quality engineer takes two samples from a production line, one before a maintenance, modification and one after. Has the modification altered the median value of a critical, measurement (standard units) from the production items? For each pair of values the, production machine settings are the same. He obtains a value of r = 3 and compares, this with a value of 1 from Table 18. The maintenance has altered the median value, since the critical value is less than the calculated value., Numerical calculation, xi, yi, Sign, , 0.19, 0.21, −, , 0.22, 0.27, −, , 0.18, 0.15, +, , 0.17, 0.18, −, , 1.20, 0.40, +, , There are 3 plus signs. 7 minus signs, r = 3, n = 10, r10;0.10 = 1 [Table 18]., Do not reject the null hypothesis., , 0.14, 0.08, +, , 0.09, 0.14, −, , 0.13, 0.28, −, , 0.26, 0.30, −, , 0.66, 0.68, −
Page 104 :
THE TESTS, , 95, , Test 47 The signed rank test for a mean, Object, To investigate the significance of the difference between a population mean and a, specified value µ0 ., Limitations, This is a distribution-free test and requires a symmetrical population. The observations, must be obtained randomly and independently from a continuous distribution., Method, From the sample values xi determine the differences xi − µ0 and arrange them in, ascending order irrespective of sign. Sample values equal to xi − µ0 = 0 are not, included in the analysis., Rank numbers are now assigned to the differences. Where ties occur among differences, the ranks are averaged among them. Then each rank number is given the sign of, the corresponding difference xi − µ0 ., The sum of the ranks with a positive sign and the sum of the ranks with a negative, sign are calculated. The test statistic T is the smaller of these two sums. Critical values, of this statistic can be found from Table 17. When the value of T falls in the critical, region, i.e. less than the tabulated values the null hypothesis that the population mean, is equal to µ0 is rejected., Example, The mean deposit rate (GBP per savings level) for a sample of ten investors is examined, to see if mail advertising has altered this from a value of 0.28. The signed rank test, is used and produces a T value of 17. Since this calculated value is greater than the, tabulated value we do not reject the null hypotheses. It would appear that the advertising, has not altered the mean deposit level., Numerical calculation, µ0 = 0.28, n = 10, α = 0.05, T9;α = 7, Here n = 10 − 1 = 9 (one zero)., xi, xi − µ0, , 0.28 0.18, 0.24, 0.30, 0.40, 0.36, 0.15, 0.42, 0.23, 0.48, 0, −0.10 −0.04 +0.02 +0.12 +0.08 −0.13 +0.14 −0.05 +0.20, , Signed rank, , −, , −5, , −2, , +1, , +6, , +4, , −7, , Sum of plus ranks = 28, sum of minus ranks = 17, T = 17, T > T9;α [Table 17]., Hence do not reject the null hypothesis., , +8, , −3, , +9
Page 105 :
96, , 100 STATISTICAL TESTS, , Test 48 The signed rank test for two means (paired, observations), Object, To investigate the significance of the difference between the means of two similarly, shaped distributions., Limitations, The observations in the two samples should be taken in pairs, one from each distribution., Each one of a pair of observations should be taken under the same conditions, but it is, not necessary that different pairs should be taken under similar conditions. Any pair of, observations giving equal values will be ignored in the analysis., Method, The differences between pairs of observations are formed and these are ranked, irrespective of sign. Where ties occur, the average of the corresponding ranks is used. Then, each rank is allocated the sign from the corresponding difference., The sum of the ranks with a positive sign and the sum of the ranks with a negative, sign are calculated. The test statistic T is the smaller of these two sums. Critical values, of this statistic can be found from Table 19. When the value of T is less than the critical, value, the null hypothesis of equal population means is rejected., Example, A manually operated component punch produces two springs at each operation. It is, desired to test if the mean component specification differs between the two springs. The, sample of pairs of springs produces a signed rank test statistic, T , of 11, which is less, than the tabulated value of 17. Hence the null hypothesis of no difference is rejected., The punch needs re-setting., Numerical calculation, xi, yi, , 1.38, 9.69, 1.42 10.37, , xi − yi −0.04 −0.68, Rank −9.5 −13, , 0.39, 0.39, 0, 0, , 1.42, 1.46, , 0.54, 0.55, , 5.94, 6.15, , 0.59, 0.61, , 2.67, 2.69, , 2.44, 2.68, , 0.56, 0.53, , 0.69, 0.72, , 0.71, 0.72, , 0.95, 0.93, , 0.50, 0.53, , −0.04 −0.01 −0.21 −0.02 −0.02 −0.24 +0.03 −0.03 −0.01 +0.02 −0.03, −9.5 −1.5 −11, −4, −4 −12, +7, −7, −1.5 +4, −7, , Minus signs = 11, plus signs = 2, rank for plus sign = 4 + 7 = 11, T13;0.05 = 17 [Table l9], Reject the null hypothesis.
Page 106 :
THE TESTS, , 97, , Test 49 The Wilcoxon inversion test (U-test), Object, To test if two random samples could have come from two populations with the same, frequency distribution., Limitations, It is assumed that the two frequency distributions are continuous and that the two, samples are random and independent., Method, Samples of size n1 and n2 are taken from the two populations. When the two samples are, merged and arranged in ascending order, there will be a number of jumps (or inversions), from one series to the other. The smaller of the number of inversions and the number, of non-inversions forms the test statistic, U. The null hypothesis of the same frequency, distribution is rejected if U exceeds the critical value obtained from Table 20., Example, An educational researcher has two sets of adjusted reading scores for two sets of five, pupils who have been taught by different methods. It is possible that the two samples, could have come from the same population frequency distribution., The collected data produce a calculated U value of 4. Since the sample U value, equals the tabulated critical value the educational researcher rejects the null hypothesis of no difference. The data suggest that the two reading teaching methods produce, different results., Numerical calculation, n1 = 5, n2 = 5, α = 0.05, xi, yi, , 11.79, 10.34, , 11.21, 11.40, , 13.20, 10.19, , 12.66, 12.10, , 13.37, 11.46, , Rearrangement gives the following series, 11.21, 12.66 13.20 13.37, 11.79, 10.19, 10.34,, , 12.10,, ,, ,, , 11.40, 11.46,, (4), (5), (5), (5), (2), where underlined values come from the first row (xi ). Below these underlines, the, corresponding number of inversions, i.e. the number of times a y-value comes after an, x-value, is given in parentheses., The number of inversions is 2 + 4 + 5 + 5 + 5 = 21., The number of non-inversions is n1 n2 − 21 = 25 − 21 = 4., The critical value at α = 0.05 is 4 [Table 20]., The sample value of U is equal to the critical value., The null hypothesis may be rejected; alternatively, the experiment could be repeated, by collecting a second set of data.
Page 107 :
98, , 100 STATISTICAL TESTS, , Test 50 The median test of two populations, Object, To test if two random samples could have come from two populations with the same, frequency distribution., Limitations, The two samples are assumed to be reasonably large., Method, The median of the combined sample of n1 + n2 elements is found. Then, for each series, in turn, the number of elements above and below this median can be found and entered, in a 2 × 2 table of the form:, Sample 1, , Sample 2, , Total, , a, c, , b, d, , a+b, c+d, , n1 = a + c, , n2 = b + d, , N = n1 + n2, , Left of median, Right of median, Total, The test statistic is, χ2 =, , {|ad − bc| − 21 N}2 N, ., (a + b)(a + c)(b + d)(c + d), , If this value exceeds the critical value obtained from χ 2 tables with one degree of, freedom, the null hypothesis of the same frequency distribution is rejected., Example, A housing officer has data relating to residents’ assessment of their housing conditions, in a small, isolated estate. Half of the houses in the estate are maintained by one maintenance company and the other half by another company. Do the repair regimes of the two, companies produce similar results from the residents? Samples of 15 residents are taken, from each half. The calculated chi-squared value is 0.53, which is less than the tabulated, value of 3.84. The housing officer does not reject the null hypothesis and concludes, that the two maintenance companies produce similar results from their repair regimes., Numerical calculation, a = 9, b = 6, c = 6, d = 9, a + b = a + c = b + d = c + d = 15, n1 = 15, n2 = 15, N = 30, 8, {|92 − 62 | − 15}2 × 30, =, = 0.53, 15 × 15 × 15 × 15, 15, 2, = 3.84 [Table 5], χ1;0.05, Do not reject the null hypothesis., χ2 =
Page 108 :
THE TESTS, , 99, , Test 51 The median test of K populations, Object, To test if K random samples could have come from K populations with the same, frequency distribution., Limitations, The K samples are assumed to be reasonably large – say, greater than 5., Method, The K samples are first amalgamated and treated as a single grand sample, of which, the median is found. Then, for each of the K samples, the number of elements above, and below this median can be found. These can be arranged in the form of a 2 × K, table and then a χ 2 -test can be carried out., 1, , 2, , Sample, ..., , j, , ..., , K, , Total, , Above median, Below median, , a11, a21, , a12, a22, , ..., ..., , a1j, a2j, , ..., ..., , a1K, a2K, , A, B, , Total, , a1, , a2, , ..., , aj, , ..., , aK, , N, , In this table, a1j represents the number of elements above the median and a2j the number, of elements below the median in the jth sample ( j = 1, 2, . . . , K). Expected frequencies, are calculated from, e1j =, , Aaj, N, , e2j =, , and, , Baj, ., N, , The test statistic is, χ =, 2, , K, �, (a1j − e1j )2, j=1, , e1j, , +, , K, �, (a2j − e2j )2, j=1, , e2j, , ., , This is compared with a critical value from Table 5 with K − 1 degrees of freedom. The, null hypothesis that the K populations have the same frequency distribution is rejected, if χ 2 exceeds the critical value., Example, The housing officer in test 50 has a larger estate which is maintained by five maintenance, companies. He has sampled the residents receiving maintenance from each company in, proportion to the number of houses each company maintains. The officer now produces a, chi-squared value of 0.2041. Do the five maintenance companies differ in their effect on, resident’s assessment? The tabulated chi-squared value is 9.49, so the officer concludes, that the standards of maintenance are the same.
Page 109 :
100, , 100 STATISTICAL TESTS, , Numerical calculation, Sample, 3, 4, , 1, , 2, , Above median, Below median, , 20, 25, , 30, 35, , 25, 30, , Total, , 45, , 65, , 55, , e11 =, e12, e13, e14, e15, , 5, , Total, , 40, 45, , 30, 32, , 145, 167, , 85, , 62, , 312, , 145 × 45, 167 × 45, = 20.91 e21 =, = 24.08, 312, 312, , = 30.21, = 25.56, = 39.50, = 28.81, , e22, e23, e24, e25, , = 34.79, = 29.44, = 45.50, = 33.19, , χ 2 = 0.0396 + 0.0015 + 0.0123 + 0.0063 + 0.0491, + 0.0351 + 0.0013 + 0.0107 + 0.0055 + 0.0427, = 0.2041, χ4;2 0.05 = 9.49 [Table 5]., Hence do not reject the null hypothesis.
Page 110 :
THE TESTS, , 101, , Test 52 The Wilcoxon–Mann–Whitney rank sum test, of two populations, Object, To test if two random samples could have come from two populations with the same, mean., Limitations, It is assumed that the two populations have continuous frequency distributions with the, same shape and spread., Method, The results of the two samples x and y are combined and arranged in order of increasing, size and given a rank number. In cases where equal results occur the mean of the available rank numbers is assigned. The rank sum R of the smaller sample is now found. Let, N denote the size of the combined samples and n denote the size of the smaller sample., A second quantity, R1 = n(N + 1) − R, is now calculated. The values R and R1 are compared with critical values obtained from, Table 21. If either R or R1 is less than the critical value the null hypothesis of equal, means would be rejected., Note If the samples are of equal size, then the rank sum R is taken as the smaller of, the two rank sums which occur., Example, A tax inspector wishes to compare the means of two samples of expenses claims taken, from the same company but separated by a period of time (the values have been adjusted, to account for inflation). Are the mean expenses for the two periods the same? He, calculates a test statistic, R1 of 103 and compares this with the tabulated value of 69., Since the calculated value is greater than the tabulated critical value he concludes that, the mean expenses have not changed., Numerical calculation, Total, x, Rank, , 50.5, 9, , 37.5, 1, , 49.8, 7, , 56.0, 15.5, , 42.0, 2, , 56.0, 15.5, , 50.0, 8, , 54.0, 13, , 48.0, 6, , y, Rank, , 57.0, 17, , 52.0, 11, , 51.0, 10, , 44.2, 3, , 55.0, 14, , 62.0, 19, , 59.0, 18, , 45.2, 5, , 53.5, 12, , R = 77, n1 = 9, n2 = 10, N = 19, R1 = 9 × 20 − 77 = 103, The critical value at α = 0.05 is 69 [Table 21]., Hence there is no difference between the two means., , 77, 44.4, 4, , 113
Page 111 :
102, , 100 STATISTICAL TESTS, , Test 53 The Siegel–Tukey rank sum dispersion test, of two variances, Object, To test if two random samples could have come from two populations with the same, variance., Limitations, It is assumed that the two populations have continuous frequency distributions and that, the sample sizes are not too small, e.g. n1 + n2 > 20., Method, The results of the two samples are combined and arranged in order of increasing size., Ranks are allocated according to the following scheme:, , • The lowest value is ranked 1., • The highest two values are ranked 2 and 3 (the largest value is given the value 2)., • The lowest two unranked values are ranked 4 and 5 (the smallest value is given the, value 4)., • The highest two unranked values are ranked 6 and 7 (the largest value is given the, value 6)., This procedure continues, working from the ends towards the centre, until no more than, one unranked value remains. That is to say, if the number of values is odd, the middle, value has no rank assigned to it., Let n1 and n2 denote the sizes of the two samples and let n1 � n2 . Let R1 be the rank, sum of the series of size n1 . The test statistic is, Z=, , R1 − n1 (n1 + n2 + 1)/2 + 21, ., √, n1 n2 (n1 + n2 + 1)/12, , This will approximately follow a standard normal distribution. The null hypothesis of, equal variance is rejected if Z falls in the critical region., Example, A catering manager wants to know if two types of pre-prepared sauce give the same, spread or variability of values. This is because he has to set his dispensers to a fixed, value and an unusually large value will cause problems. He takes a sample of ten sauces, of each type and compares them using the Siegel–Tukey rank sum dispersion test. He, produces a Z value of −2.154 which is outside the acceptance region [Table 1] of ±1.96., He rejects the null hypothesis of no difference and concludes, in this case, that sauce, type y has greater dispersion than type x.
Page 112 :
THE TESTS, , 103, , Numerical calculation, Combined rank assignment of two sample data x, y:, Sample, Value, Rank, , x, 2.4, 1, , y, 2.9, 4, , y, 3.3, 5, , y, 3.6, 8, , y, 4.2, 9, , y, , x, , x, , y, , x, , 4.9, 12, , 6.1, 13, , 7.3, 16, , 7.3, 17, , 8.5, 20, , Sample, Value, Rank, , x, , x, , x, , 8.8, 19, , 9.4, 18, , 9.8, 15, , x, 10.1, 14, , x, 10.l, 11, , y, 11.7, 10, , x, 12.6, 7, , y, 13.1, 6, , y, 15.3, 3, , y, 16.5, 2, , n1 = n2 = 10, Rx = 1 + 13 + 16 + 20 + 19 + 18 + 15 + 14 + 11 + 7 = 134, Ry = 4 + 5 + 8 + 9 + 12 + 17 + 10 + 6 + 3 + 2 = 76, Hence R1 = 76, 76 − 10(10 + 10 + 1)/2 + 21, −28.5, −28.5, = √, = −2.154, Z= √, =, 13.23, 10 · 10(10 + 10 + 1)/12, 175, The critical values at α = 0.05 are −1.96 and +1.96 [Table 1]., Hence reject the null hypothesis.
Page 113 :
104, , 100 STATISTICAL TESTS, , Test 54 The Kruskall–Wallis rank sum test of, K populations (H-test), Object, To test if K random samples could have come from K populations with the same mean., Limitations, Each sample size should be at least 5 in order for χ 2 to be used, though sample sizes, need not be equal. The K frequency distributions should be continuous., Method, The K samples are combined and arranged in order of increasing size and given a rank, number. Where ties occur the mean of the available rank numbers is used. The rank, sum for each of the K samples is calculated., Let Rj be the rank sum of the jth sample, nj be the size of the jth sample, and N be, the size of the combined sample. The test statistic is, , H=, , ⎧, ⎨, , 12, ⎩ N(N + 1), , ⎫, K, 2, �, R ⎬, i, , j=1, , nj ⎭, , − 3(N + 1)., , This follows a χ 2 -distribution with K − 1 degrees of freedom. The null hypothesis, of equal means is rejected when H exceeds the critical value. Critical values of H for, small sample sizes and K = 3, 4, 5 are given in Table 22., Example, A cake preference score is a combination of four components, viz. tastes, appearance,, smell and texture. The minimum score is 0 and the maximum 100. Three cake formulations are compared using these scores by three panels of accredited tasters. The results, produce an H test statistic of 2.15. This is less than the tabulated value of 4.61 [Table 5]., The catering manager concludes the three cake formulations are equally preferred., Numerical calculation, Combined rank assignment of three sample data x1 , x2 , x3 :, Sample, Value, Rank, , x1, 1.7, 1, , x1, 1.9, 2, , x1, 6.1, 3, , x1, 12.5, 4, , x1, 16.5, 7, , x1, 25.1, 10.5, , x1, 30.5, 14, , x1, 42.1, 15, , x1, 82.5, 20, , x2, 13.6, 6
Page 114 :
THE TESTS, , Sample, Value, Rank, , x2, 19.8, 8, , x2, 25.2, 12, , x2, 46.2, 16.5, , x2, 46.2, 16.5, , x2, 61.1, 19, , x3, 13.4, 5, , 105, , x3, 20.9, 9, , R1 = 76.5, R2 = 78.0, R3 = 55.5, 12, (2280.30) − 63 = 2.15, χ2;2 0.10 = 4.61 [Table 5]., H=, 420, Do not reject the hypothesis., , x3, 25.1, 10.5, , x3, 29.7, 13, , x3, 46.9, 18
Page 115 :
106, , 100 STATISTICAL TESTS, , Test 55 The rank sum difference test for the multiple, comparison of K population means, Object, To test if K random samples came from populations with the same mean., Limitations, The K samples must have the same size, and the frequency distributions of the, population are assumed continuous., Method, The K samples are combined and arranged in order of increasing size and then given a, rank number. The highest raw value is assigned rank 1. For each sample the rank sum, is determined., To compare two population means the rank sums of the corresponding samples, Ri, and Rj , are taken and the test statistic is Ri − Rj . Critical values of this test statistic can, be obtained from Table 23. When Ri − Rj exceeds the critical value the null hypothesis, of equal means is rejected., Example, A perfume manufacturer has four floral fragrances and wishes to compare each one, against the others in a preference test. Selected perfume testers can give a perfume a, score between 1 and 100. For each of these four fragrances four testers are used and, the results are shown. The critical value from Table 23 is 34.6. Fragrances 1 and 2 and, 1 and 3 are viewed as different, with fragrance 1 generally preferred., Numerical calculation, Sample, 1, , 2, , 3, , 4, , 70 (16), 52 (14), 51 (13), 67 (15), , 12 (2), 18 (3), 35 (8), 36 (9), , 10 (1), 43 (11), 28 (5), 26 (4), , 29 (6), 31 (7), 41 (10), 44 (12), , R1 = 58, , R2 = 22, , R3 = 21, , R4 = 35, , n = 4, K = 4, The values in the brackets are the assigned rank numbers., Here R1 − R2 = 58 − 22 = 36 R2 − R3 = 22 − 21 = 1, R1 − R3 = 58 − 21 = 37 R2 − R4 = 22 − 35 = −13, R1 − R4 = 58 − 35 = 23 R3 − R4 = 21 − 35 = −14, The critical value at α = 0.05 is 34.6 [Table 23]., Hence samples 1 and 2 and samples 1 and 3 are significantly different.
Page 116 :
THE TESTS, , 107, , Test 56 The rank sum maximum test for the largest, K population means, Object, To investigate the difference between the largest mean and the K − 1 other population, means., Limitations, It is assumed that the populations have continuous frequency distributions and that the, K samples are of equal size n., Method, The K samples are merged together and rank numbers allocated to the Kn observations., The sum of the rank numbers of the observations belonging to a particular sample is, formed. This is repeated for each sample and the test statistic is the largest of these, rank sums. When the test statistic exceeds the critical value obtained from Table 24 the, mean of the population generating the maximum rank sum is said to be significantly, large., Example, As an alternative to Test 55 the perfume manufacturer uses the rank sum maximum test, for the largest 4 population means. The largest R value is R1 at 58 which is greater than, the tabulated value of 52. Hence fragrance 1 is significantly greater (in preference) than, the other fragrances. This is a similar result to that found with Test 55., Numerical calculation, Combined rank assignment of four samples, i.e. K = 4, n = 4., Sample, , x1, , x1, , x1, , x1, , x2, , x2, , x2, , x2, , x3, , x3, , x3, , x3, , x4, , x4, , x4, , x4, , Value, Rank, , 70, 16, , 52, 14, , 51, 13, , 67, 15, , 12, 2, , 18, 3, , 35, 8, , 36, 9, , 10, 1, , 43, 11, , 28, 5, , 26, 4, , 29, 6, , 31, 7, , 41, 10, , 44, 12, , R1 = 58, R2 = 22, R3 = 21, R4 = 35, The critical value at α = 0.05 is 52 [Table 24]., The calculated value of R1 is greater than the critical value., Hence the sample 1 is statistically significantly greater than the others.
Page 117 :
108, , 100 STATISTICAL TESTS, , Test 57 The Steel test for comparing K treatments, with a control, Object, To test the null hypothesis that all treatments have the same effect as the control, treatment., Limitations, The K samples, one from each treatment and one from the control, should all be of the, same size., Method, Each of the treatment samples is compared with the control sample in turn. To test, the jth sample, it is merged with the control sample and rank numbers are allocated, to the 2n observations. This provides two rank sums and the smallest of these is used, as the test statistic if a two-tailed test is desired. To test the alternative hypothesis that, treatment j has a smaller effect than the control treatment, the rank sum for the jth, control sample forms the test statistic. In both cases, the null hypothesis that there is, no difference between the jth treatment and the control is rejected if the test statistic is, less than the critical value obtained from Table 25., Example, Four different sprain relief creams are compared with controls. Treatments are allocated, at random and each is compared with its control. The results show that rank sums for, controls 1 and 4 are less than the critical tabulated value of 76 (Table 25). Hence, treatment creams 1 and 4 are significant and hence more effective than placebo in, relieving sprain effects., Numerical calculation, n = 10, K = 4, Rank assignment and rank sums are as follows:, Total, Control 1, Treatment1, Control 2, Treatment 2, Control 3, Treatment 3, Control 4, Treatment 4, , 1.5, 5, 2.5, 1, 1.5, 4, 1.5, 4, , 1.5, 9, 2.5, 4, 1.5, 6.5, 1.5, 8, , 3, 10, 5, 6, 3, 6.5, 3, 10, , 4, 12, 7, 10.5, 5, 10.5, 5, 12, , 6, 14.5, 8, 10.5, 8, 12, 6, 13, , 7, 16, 9, 13, 9, 13, 7, 14, , 8, 17, 12, 15, 10.5, 16.5, 9, 17, , 11, 18, 15, 15, 14, 16.5, 12, 18, , 13, 19, 18, 17, 15, 19, 15, 19, , 14.5, 20, 19, 20, 18, 20, 16, 20, , 69.5, 140.5, 98, 112, 85.5, 124.5, 76, 135, , The critical value at α = 0.05 is 76 [Table 25]., Since control 1 and control 4 are less than or equal to the critical value, treatments 1, and 4 are significant.
Page 118 :
THE TESTS, , 109, , Test 58 The Spearman rank correlation test, (paired observations), Object, To investigate the significance of the correlation between two series of observations, obtained in pairs., Limitations, It is assumed that the two population distributions are continuous and that the, observations xi and yi have been obtained in pairs., Method, The xi observations are assigned the rank numbers 1, 2, . . . , n in order of increasing, magnitude. A similar procedure is carried out for all the yi observations. For each, pair of, �observations, the difference in the ranks, di , can be determined. The quantity, R = ni=1 di2 is now calculated., For large samples (n > 10) the test statistic is, Z=, , 6R − n(n2 − 1), √, n(n + 1) (n − 1), , which may be compared with tables of the standard normal distribution. For small, samples, the test statistic, rS = 1 −, , 6R, − 1), , n(n2, , must be compared with critical values obtained from Table 26. In both cases, if the, experimental value lies in the critical region one has to reject the null hypothesis of no, correlation between the two series., Example, A panel of consumers is asked to rate two brands of vegetarian sausage. It is hoped that, advertising can be combined in a mail out to potential consumers. A small sample is, taken and panel members are asked to rate each brand. The results produce a Z value, of −2.82. The critical value for Z is 1.64 so the null hypothesis of zero correlation is, rejected. Consumers tend to report similar preferences for the two brands of sausage., Numerical calculation, di : 0, −1, −2, 0, +3, −1, −1, +2, 0, 0, 2, Hence R = 24, n = 11, Z=, , 6 × 24 − 11(112 − 1), −1176, 144 − 1320, =, = −2.82, =, √, 132 × 3.1623, 417.42, 11 × 12 10, , The critical value of Z at α = 0.05 is 1.64 [Table 1]., Hence reject the null hypothesis.
Page 119 :
110, , 100 STATISTICAL TESTS, , Test 59 The Kendall rank correlation test, (paired observations), Object, To investigate the significance of the correlation between two series of observations, obtained in pairs., Limitations, It is assumed that the two population distributions are continuous and that the, observations xi , and yi , have been obtained in pairs., Method, The xi observations are assigned the rank numbers 1, 2, . . . , n in order of increasing, magnitude. A similar procedure is carried out for all the yi observations. Each of the, possible pairs of rank numbers (there will be 21 n(n − 1) of these) is now examined., Each pair (xi , yi ) will be compared successively and systematically with each other pair, (xj , yj ). When xi − xj and yi − yj have the same sign a score of +1 is obtained. When, they have opposite signs a score of −1 is obtained. When there is a difference of zero,, no score is obtained. These scores are summed together and this sum is denoted S. In, this manner we can work with observational results without having determined the rank, numbers., For large n (n > 10), Z follows a normal distribution and hence the test statistic, Z=, , S, 1, , {n(n − 1)(2n + 5)/18} 2, , may be compared with tables of the standard normal distribution. For small samples,, critical values of S may be obtained from Table 27., In both cases, if the experimental value lies in the critical region one has to reject the, null hypothesis of no correlation between the two series., Example, A tax inspector wishes to investigate whether there is any correlation between total, investment incomes (£00’s), obs1 and total additional income (£00’s), obs 2. He has, collected a sample of 10 tax forms and calculates an S value of 33. He compares this, with the critical value of 21 obtained from Table 27. Since the calculated value is greater, than the tabulated value he concludes that there is a significant correlation., Numerical calculation, Observation 1, Observation 2, Plus scores, Minus scores, , 7.1, 62, 9, 0, , 8.3, 66, 8, 0, , 10.7, 74, 5, 0, , 9.4, 74, 3, 2, , 12.6, 82, 4, 1, , 11.1, 76, 3, 1, , 10.3, 72, 3, 1, , 13.1, 79, 2, 0, , 9.6, 68, 1, 0, , 12.4, 74, 0, 0
Page 120 :
THE TESTS, , Total plus scores = 38, total minus scores = 5, S = 38 − 5 = 33, n = 10, Critical value S10;005 = 21 [Table 27]., The calculated value is greater than the critical value., Reject the null hypothesis., , 111
Page 121 :
112, , 100 STATISTICAL TESTS, , Test 60 The sequential test for a population mean, (variance known), Object, To test the null hypothesis that the mean µ of a population with known variance has, the value µ0 rather than the value µ1 ., Limitations, 1. The observations can be obtained sequentially as necessary., 2. The observations are independent and follow a normal distribution with known, variance σ 2 ., Method, First the Type I and Type II errors for the test must be fixed, say, α and β. The test consists, of plotting a sequential, � analysis chart. In this case, as the observations are obtained, the cumulative value m, i=1 (xi − c) is plotted against the sample size to date, m. The, constant c is chosen as a convenient value close to 21 (µ0 + µ1 ), On the chart are two boundary lines:, m, �, (xi − c) =, i=1, m, �, i=1, , �, �, �, �, µ 0 + µ1, σ2, 1−β, +m, −c ,, log, µ1 − µ0, α, 2, , �, �, �, �, µ 0 + µ1, σ2, β, +m, −c ., (xi − c) =, log, µ1 − µ0, 1−α, 2, , If the plot crosses the upper boundary the null hypothesis is rejected, and it will not be, rejected if the plot crosses the lower boundary., Example, As part of a quality monitoring programme, measurements of a critical dimension of an, automotive component are taken at regular intervals. The quality engineer uses a cu-sum, and a sequential test for the process mean. His test is that the mean is constant at 8.30, units, i.e. the specified value rather than 8.33 units, when problems would occur. He, produces a cu-sum chart and plots the sequential values upon it. What does he conclude, about the process? He has three options, viz. reject the null hypothesis that the mean, is 8.30, do not reject the null hypothesis that the mean is 8.30 or continue testing., Since the lower boundary is crossed at observation 7 he accepts the null hypothesis, and stops testing., Numerical calculation, Successive observations: 8.34, 8.29, 8.30, 8.31, 8.30, 8.32, 8.30, µ0 = 8.30, µ1 = 8.33, α = 0.05, β = 0.05, µ1 − µ0 = 8.33 − 8.30 = 0.03, µ̄ = 8.315
Page 122 :
THE TESTS, , 113, , Let the standard deviation be 0.02., �, �, �, �, 0.022, 0.05, β, σ2, =, × log, = −0.039, log, 1−α, 0.03, 0.95, µ1 − µ0, �, �, 1−β, σ2, = +0.039, log, α, µ1 − µ0, Critical boundary lines are, �, xi = −0.039 − 8.315m, and, �, , xi = 0.039 − 8.315m, , �, , or, , �, , or, , xi� = −0.039 + 0.015m, , xi� = 0.039 + 0.015m, , m, , 1, , 2, , 3, , 4, , 5, , 6, , 7, , 8, , 9, , 10, , xi�, cu-sum, H0 boundary, H1 boundary, , 0.04, 0.04, −0.024, 0.054, , −0.01, 0.03, −0.009, 0.069, , 0.00, 0.03, 0.006, 0.084, , 0.01, 0.04, 0.021, 0.099, , 0.00, 0.04, 0.036, 0.114, , +0.02, 0.06, 0.051, 0.129, , 0.00, 0.06, 0.066, 0.144, , 0.081, 0.159, , 0.096, 0.174, , 0.111, 0.189
Page 123 :
114, , 100 STATISTICAL TESTS, , Test 61 The sequential test for a standard deviation, (mean known), Object, To test the null hypothesis that the standard deviation σ , of a population with known, mean, has the value σ0 rather than the value σ1 ., Limitations, 1. The observations can be obtained sequentially as necessary., 2. The observations are independent and come from a normal distribution with known, mean µ., Method, First the Type I and Type II errors for the test must be decided upon, say, α and β. The, test consists of plotting, � a sequential2 analysis chart. As the observations are obtained, the cumulative value m, i=1 (xi − µ) is plotted against the sample size to date, m., On the chart are two boundary lines:, � �, �, �, m, �, 2σ02 σ12, 2σ02 σ12, σ02, 1−β, 2, −, m, (xi − µ) = 2, log, log, ,, 2, 2 − σ2, 2, α, σ, −, σ, σ, σ, 1, 0, 1, 0, 1, i=1, � �, �, �, m, �, 2σ02 σ12, 2σ02 σ12, σ02, β, 2, −, m, log, log, (xi − µ) = 2, ., 1−α, σ1 − σ02, σ12 − σ02, σ12, i=1, If the plot crosses the upper boundary, the null hypothesis is rejected; if the plot crosses, the lower boundary, the null hypothesis is not rejected., Example, A quality engineer wants to set up a sequential test for a standard deviation. His process, has a mean specification of 2 units and variance 4 units (standard deviation 2 units). He, sets his Type I error at 0.15 and his Type II error at 0.25. He calculates his cumulative, sum of squared deviations from the specified standard deviation of 2 units. If this, cumulative sum lies within the range 8.37 to 37.90 he continues to sample. If the, sum is less than 8.37 or greater than 37.90 he respectively accepts or rejects the null, hypothesis., Numerical calculation, Consider a sample from N(2, σ 2 ) and, H0 : σ02 = 4 against H1 : σ12 = 6., Let α = 0.15, β = 0.25 and m = 10.
Page 124 :
THE TESTS, , 115, , Then continue sampling if, �, � ��, �, �, 4, 0.25, + 10 log, 24 2 log, 0.85, 6, 6−4, �, � ��, �, �, 4, 0.75, + 10 log, 24 2 log, m, �, 0.15, 6, <, (xi − 2)2 <, 6−4, i=1, , 24[−1.0628 + 1.76] �, 24[1.398 + 1.76], (xi − 2)2 <, <, 2, 2, m, , i=1, , or, m, �, (xi − 2)2 < 37.90, 8.37 <, i=1, , Hence do not reject H0 if, , �m, , 2, i=1 (xi −2), , � 8.37 and reject H0 if, , �m, , 2, i=1 (xi −2), , � 37.90.
Page 125 :
116, , 100 STATISTICAL TESTS, , Test 62 The sequential test for a dichotomous, classification, Object, To test the null hypothesis that the parameter p of a population has the value p0 rather, than the value p1 ., Limitations, 1. The observations can be obtained sequentially as necessary., 2. The observations are independent and follow a Bernoulli distribution., Method, This test is typically used in quality control when we wish to determine if the proportion, defective in a sample falls below p0 (accept batch) or exceeds p1 (reject batch). First, we need to decide on the Type I and Type II errors for the test, say α and β., The test consists of plotting a sequential analysis chart. As the observations are, obtained the number of defective items rm is plotted against the sample size to date, m., On the chart are two boundary lines:, �, � � �, �, ��, �, �, �, p1, 1 − p1, 1 − p1, β, rm log, − log, + m log, = log, p0, 1 − p0, 1 − p0, 1−α, �, �, ��, �, �, �, � � �, 1 − p1, 1 − p1, 1−β, p1, rm log, ., − log, + m log, = log, p0, 1 − p0, 1 − p0, α, If the plot crosses the upper boundary the null hypothesis is rejected; if the plot crosses, the lower boundary the null hypothesis is not rejected., Example, A quality control engineer sets up a sequential test for the proportion defective in a, sample from a large batch. If the proportion is below 0.10 he accepts the batch, but, if the proportion is above 0.20 he rejects the batch, otherwise he continues to sample., After the 21st observation the plot of the number of defective items versus the sample, number crosses the upper boundary line. This suggests that he should reject the null, hypothesis (p = 0.10) and accept the alternative hypothesis (p = 0.20). The whole, batch is therefore rejected., Numerical calculation, H0 : p = p0 = 0.10 and H1 : p = p1 = 0.20, Let α = 0.01 and β = 0.05, and results are:, a, a, a, r, a, r, a, a, r, a, a, a, r, r, a, r, r, a, r, (where a = not defective and r = defective).
Page 126 :
THE TESTS, , Then, , 117, , �, 0.20, = 0.693, 0.10, �, �, �, �, 1 − p1, 0.80, log, = −0.118, = log, 1 − p0, 0.90, �, �, �, �, β, 0.05, log, = −2.986, = log, 0.99, 1−α, �, �, �, �, 1−β, 0.95, log, = log, = 4.554, α, 0.01, �, , log, , p1, p0, , �, , �, , = log, , Boundary lines are:, 0.811rm − 0.118m = −2.986, 0.811rm − 0.118m = 4.554., If m = 0, the two boundary lines are rm1 = −3.68 and rm2 = 5.62., If m = 30, the two boundary lines are rm1 = 0.68 and rm2 = 9.98., The first line intersects the m-axis at m = 25.31. The sequential analysis chart is now, as follows:, , After the 21st observation we can conclude that the alternative hypothesis H1 may, not be rejected. This means that p � 0.20. The percentage of defective elements is too, large. The whole lot has to be rejected.
Page 127 :
118, , 100 STATISTICAL TESTS, , Test 63 The adjacency test for randomness of, fluctuations, Object, To test the null hypothesis that the fluctuations in a series are random in nature., Limitations, It is assumed that the observations are obtained independently of each other and under, similar conditions., Method, For a series of n terms, xi (i = 1, . . . , n), the test statistic is defined as, n−1, �, (xi+1 − xi )2, , L =1−, , i=1, n, �, (xi − x̄)2, 2, , ., , i=1, , For n > 25, this approximately follows a normal distribution with mean zero and, variance, �, (n − 2), ., (n − 1)(n + 1), For n < 25, critical values for, n−1, �, (xi+1 − xi )2, , D=, , i=1, n, �, , (xi − x̄)2, , i=1, , are available in Table 28., In both cases the null hypothesis is rejected if L exceeds the critical values., Example, An energy forecaster has produced a model of energy demand which she has fitted to, some data for an industry sector over a standard time period. To assess the goodness of, fit of the model she performs a test for randomness on the residuals from the model. If, these are random then the model is a good fit to the data. She calculates the D statistic, and compares it with the values from Table 28 of 1.37 and 2.63. Since D is less then, the lower critical value she rejects the null hypothesis of randomness and concludes, that the model is not a good fit to the data.
Page 128 :
THE TESTS, , 119, , Numerical calculation, �, �, xi = 2081.94,, xi2 = 166 736.9454, n, �, , (xi − x̄)2 = 26.4006,, , i=1, , n−1, �, (xi+1 − xi )2 = 31.7348, n = 25, i=1, , n−1, �, (xi+1 − xi )2, , D=, , i=1, n, �, , (xi − x̄)2, , =, , 31.7348, = 1.20, 26.4006, , i=1, , The critical values at α = 0.05 are 1.37 (lower limit) and 2.63 (upper limit) [Table 28]., The calculated value is less than the lower limit., Hence the null hypothesis is to be rejected.
Page 129 :
120, , 100 STATISTICAL TESTS, , Test 64 The serial correlation test for randomness of, fluctuations, Object, To test the null hypothesis that the fluctuations in a series have a random nature., Limitations, It is assumed that the observations are obtained independently of each other and under, similar conditions., Method, The first serial correlation coefficient for a series of n terms, xi (i = 1, . . . , n), is, defined as, ⎧, ⎫, n−1, �, ⎪, ⎪, ⎪, ⎪, ⎪, (xi − x̄)(xi+1 − x̄) ⎪, ⎪, ⎪, ⎪, ⎪, ⎨, ⎬, n, i=1, r1 =, n, ⎪, �, n−1⎪, ⎪, ⎪, ⎪, ⎪, ⎪, ⎪, (xi − x̄)2, ⎪, ⎪, ⎩, ⎭, i=1, , and this forms the test statistic., For n � 30, critical values for r1 can be found from Table 29. For n > 30, the normal, distribution provides a reasonable approximation. In both cases the null hypothesis is, rejected if the test statistic exceeds the critical values., Example, A production line is tested for a systematic trend in the values of a measured characteristic of the components produced. A serial correlation test for randomness is used., If there is a significant correlation then the quality engineer will look for an assignable, cause and so improve the resulting quality of components. He computes his first serial, correlation as 0.585. The critical value from Table 29 is 0.276. So the correlation, between successive components is significant., Numerical calculation, xi : 69.76, 67.88, 68.28, 68.48, 70.15, 71.25, 69.94, 71.82, 71.27, 68.79, 68.89, 69.70,, 69.86, 68.35, 67.61, 67.64, 68.06, 68.72, 69.37, 68.18, 69.35, 69.72, 70.46, 70.94,, 69.26, 70.20, �, �, n = 26, xi = 1804.38, x̄ = 69.40, (xi − x̄)2 = 34.169, %� &2, �, �, xi /n = 19.981, xi+1 xi = 125 242.565, xi+1 xi −, •, , r1 =, , •, , 19.981, = 0.585, 34.169, , The critical value at α = 0.05 is about 0.276 [Table 29]., Hence the null hypothesis is rejected; the correlation between successive observations, is significant.
Page 130 :
THE TESTS, , 121, , Test 65 The turning point test for randomness of, fluctuations, Object, To test the null hypothesis that the variations in a series are independent of the order of, the observations., Limitations, It is assumed that the number of observations, n, is greater than 15, and the observations, are made under similar conditions., Method, The number of turning points, i.e. peaks and troughs, in the series is determined and, this value forms the test statistic. For large n, it may be assumed to follow a normal, distribution with mean 23 (n − 2) and variance (16n − 29)/90. If the test statistic exceeds, the critical value, the null hypothesis is rejected., Example, An investment analyst wishes to examine a time series for a particular investment, portfolio. She is especially keen to know if there are any turning points or if the series, is effectively random in nature. She calculates her test statistic to be 1.31 which is less, than the tabulated value of 1.96 [Table 1]. She concludes that the series is effectively, random and no turning points can be detected., Numerical calculation, p = peak, t = trough, n = 19, α = 0.05, 0.68;, 0.32(t);, 0.49;, 0.41(t);, , 0.34(t);, 0.58( p);, 0.17(t);, 0.46;, , 0.62;, 0.34(t);, 0.30;, 0.50;, , 0.73(p);, 0.59( p);, 0.39;, 0.45, , 0.57;, 0.56;, 0.42( p);, , 16 × 19 − 29, 2, × 17 = 11.3, variance =, = 3.05,, 3, 90, standard deviation = 1.75, ', ', ' 9 − 11.3 ', ' = 1.33, ', Test statistic = ', 1.75 ', , Mean =, , The critical value at α = 0.05 is 1.96 [Table 1]., Hence the departure from randomness is not significant.
Page 131 :
122, , 100 STATISTICAL TESTS, , Test 66 The difference sign test for randomness in, a sample, Object, To test the null hypothesis that the fluctuations of a sample are independent of the order, in the sequence., Limitations, It is assumed that the number of observations is large and that they have been obtained, under similar conditions., Method, From the sequence of observations a sequence of successive differences is formed. The, number of + signs, p, in this derived sequence forms the test statistic., Let n be the initial sample size. For large n, p may be assumed to follow a normal, distribution with mean (n − 1)/2 and variance (n + 1)/12. When the test statistic lies, in the critical region the null hypothesis is rejected., Example, A quality engineer suspects that there is some systematic departure from randomness in, machined component production lines. He uses the difference sign test for randomness, to assess this. His test statistic of 4.54 is for his first sample of size 20 from production, line 1. Since this value is greater than the tabulated value of 1.64 from Table 1 he, concludes that there is a positive trend in this case. In the other samples from the other, production lines he cannot reject the null hypothesis of randomness., Numerical calculation, n = 20, α = 0.05, List, p, , S1, 16, , S2, 11, , S3, 10, , S4, 9, , S5, 10, , 19, 20 + 1, n−1, =, = 9.5, variance =, = 1.75,, 2, 2, 12, standard deviation = 1.32, , Mean =, , p(S1 ) =, , 16 − 9.5 − 0.5, = 4.54, 1.32, , The critical value at α = 0.05 is 1.64 [Table 1]., Reject the null hypothesis in this case., However, p(S2 ) = 0.76, p(S3 ) = 0.0, p(S4 ) = −0.76, p(S5 ) = 0., Do not reject the null hypothesis in these cases, where a positive trend is not indicated.
Page 132 :
THE TESTS, , 123, , Test 67 The run test on successive differences for, randomness in a sample, Object, To test the null hypothesis that observations in a sample are independent of the order, in the sequence., Limitations, It is necessary that the observations in the sample be obtained under similar conditions., Method, From the sequence of observations, a sequence of successive differences is formed, i.e., each observation has the preceding one subtracted from it. The number of runs of +, and − signs in this sequence of differences, K, provides the test statistic., Let n be the initial sample size. For 5 � n � 40, critical values of K can be obtained, from Table 30. For n > 40, K may be assumed to follow a normal distribution with, mean (2n − 1)/3 and variance (16n − 29)/90. In both cases. when the test statistic lies, in the critical region, the null hypothesis is rejected., Example, A quality engineer tests five production lines for systematic effects. He uses the run, test on successive differences. He calculates the number of successive plus or minus, signs for each line. He then compares these with the tabulated values of 9 and 17, from, Table 30. For line A his number of runs is 7 which is less than the critical value, 9, so, he rejects the null hypothesis of randomness. The values of 6 and 19 for lines C and, D result in a similar conclusion. The test statistics for lines B and E do not lie in the, critical region so he accepts the null hypothesis for these., Numerical calculation, Lists, Number (K) of runs (plus and minus), , A, 7, , B, 12, , C, 6, , D, 19, , E, 12, , n = 20, α = 0.05, The critical values are (left) 9 and (right) 17 [Table 30]., For cases A, C and D, , K(A) = 7 and K(C) = 6, which are less than 9, and K(D) = 19 which is greater, than 17., Hence reject the null hypothesis., For cases B and E, , Test statistics do not lie in the critical region [Table 30]., Do not reject the null hypothesis.
Page 133 :
124, , 100 STATISTICAL TESTS, , Test 68 The run test for randomness of two related, samples, Object, To test the null hypothesis that the two samples have been randomly selected from the, same population., Limitations, It is assumed that the two samples have been taken under similar conditions and that, the observations are independent of each other., Method, The first sample of n1 elements are all given a + sign and the second sample of n2, elements are all given a − sign. The two samples are then merged and arranged in, increasing order of magnitude (the allocated signs are to differentiate between the two, samples and do not affect their magnitudes). A succession of values with the same sign,, i.e. from the same sample, is called a run. The number of runs (K) of the combined, samples is found and is used to calculate the test statistic, Z. For n1 and n2 � 10,, Z=, , K − µK +, σK, , 1, 2, , can be compared with the standard normal distribution: here, µK =, , 2n1 n2, + 1 and, n1 + n2, , σK2 =, , 2n1 n2 (2n1 n2 − n1 − n2 ), ., (n1 + n2 )2 · (n1 + n2 − 1), , When the test statistic lies in the critical region, reject the null hypothesis., Example, A maintenance programme has been conducted on a plastic forming component production line. The supervisor responsible for the line wants to ensure that the maintenance, has not altered the machine settings and so she performs the run test for randomness, of two related samples. She collects two samples from the line, one before the maintenance and one after. The test statistic value is 0.23 which is outside the critical value, of ±1.96. She concludes that the production line is running as usual., Numerical calculation, n1 = 10, n2 = 10, K = 11, α = 0.05, Sample S1 : 26.3, 28.6, 25.4, 29.2, 27.6, 25.6, 26.4, 27.7, 28.2, 29.0, Sample S2 : 28.5, 30.0, 28.8. 25.3, 28.4, 26.5, 27.2, 29.3, 26.2, 27.5
Page 134 :
THE TESTS, , 125, , S1 and S2 are merged and arranged in increasing order of magnitude, and signs are, allocated to obtain the number of runs K:, − + + − + + − − − + + + − − + − + + − −, 2 × 10 × 10, 200, +1=, + 1 = 11, µK =, 10 + 10, 20, 2 × 10 × 10(2 × 10 × 10 − 10 − 10), σK2 =, = 4.74, σK = 2.18, (10 + 10)2 (10 + 10 − 1), 11 − 11 + 21, = 0.23. Critical value at α = 0.05 is 1.96 [Table 1]., 2.18, Hence do not reject the hypothesis., , Z=
Page 135 :
126, , 100 STATISTICAL TESTS, , Test 69 The run test for randomness in a sample, Object, To test the significance of the order of the observations in a sample., Limitations, It is necessary that the observations in the sample be obtained under similar conditions., Method, All the observations in the sample larger than the median value are given a + sign and, those below the median are given a − sign. If there is an odd number of observations, then the median observation is ignored. This ensures that the number of + signs (n) is, equal to the number of − signs. A succession of values with the same sign is called a, run and the number of runs, K, of the sample in the order of selection is found. This, forms the test statistic., For n > 30, this test statistic can be compared with a normal distribution with mean, n + 1 and variance 21 n(2n − 2)/(2n − 1). The test may be one- or two-tailed depending, on whether we wish to test if K is too high, too low or possibly both., For n < 30, critical values for K are provided in Table 31. In both cases the null, hypothesis that the observations in the sample occurred in a random order is rejected, if the test statistic lies in the critical region., Example, A quality control engineer has two similar processes, which produce dual threaded, nuts. He suspects that there is some intermittent fault on atleast one process and so, decides to test for randomness using the run test for randomness. In his first sample,, from process A, he calculates the number of runs of the same sign to be 6. For his, second process, B, he calculates the number of runs to be 11. The critical values are 9, and 19, from Table 31. Since for the process A, 6 is in the critical region, his suspicions, for this process are well founded. Process B shows no departure from randomness., Numerical calculation, n1 = n2 = 13, Sample A, 81.02, 80.08, 80.05, 79.70, 79.13, 77.09, 80.09,, (+) (−) (−) (−) (−) (−) (−), 79.40, 80.56, 80.97, 80.17, 81.35, 79.64, 80.82, 81.26,, (−) (+) (+) (+) (+) (−) (+) (+), 80.75, 80.74, 81.59, 80.14, 80.75, 81.01, 79.09,, (+) (+) (+) (+) (+) (+) (−), 78.73, 78.45, 79.56, 79.80, (−) (−) (−) (−), Median value = 80.12 and number of runs = 6.
Page 136 :
THE TESTS, , 127, , Sample B, 69.76, 67.88, 68.28, 68.48, 70.15, 71.25, 69.94,, (+) (−) (−) (−) (+) (+) (+), 71.82, 71.27, 69.70, 68.89, 69.24, 69.86, 68.35,, (+) (+) (+) (−) (−) (+) (−), 67.61, 67.64, 68.06, 68.72, 69.37, 68.18, 69.35,, (−) (−) (−) (−) (+) (−) (−), 69.72, 70.46, 70.94, 69.26, 70.20, (+) (+) (+) (−) (+), Median value = 69.36 and number of runs = 11., The critical values at α = 0.10 are (lower) 9 and (upper) 19 [Table 31]., For Sample A number of runs K = 6 lies in the critical region. Hence reject the null, hypothesis (i.e. the fluctuation is not random)., For Sample B number of runs K = 11 does not lie in the critical region., Do not reject the null hypothesis (i.e. the fluctuation may be considered to be random).
Page 137 :
128, , 100 STATISTICAL TESTS, , Test 70 The Wilcoxon–Mann–Whitney rank sum test, for the randomness of signs, Object, To test that the occurrence of + and − signs in a sequence is random., Limitations, This is a distribution-free test, applicable if the observations are random and, independent and the two frequency distributions are continuous., Method, Let n1 be the number of + or − signs, whichever is the larger, n2 be the number of, opposite signs and N = n1 + n2 . From the integers describing the natural order of, the signs, the rank sum R of the smallest number of signs is determined. The value, R� = n2 (N + 1) − R is calculated. The smaller of R and R� is used as the test statistic., If it is less than the critical value obtained from Table 21 the null hypothesis of random, + and − signs is rejected., Example, A simple fuel monitoring system has a target fuel usage level and fuel use is determined, at regular intervals. If the fuel use is higher or lower than the target value then a plus or, minus sign is recorded. Departures from target on either side would signal a potential, problem. An energy monitoring officer has recorded some data and uses the Wilcoxon–, Mann–Witney rank sum test for randomness. He obtains a minimum rank sum of 29, and, since this lies in the critical region (Table 21), he concludes that he has a fuel usage, problem., Numerical calculation, Successive observations in a sequence are coded with a plus or minus sign:, 1, +, , 2, +, , 3, +, , 4, −, , 5, +, , 6, +, , 7, +, , 8, +, , 9, −, , 10 11, − −, , 12, +, , 13, −, , 14, −, , n1 = 8, n2 = 6 (minus signs), N = 14, Rank sum of minus signs = 4 + 9 + 10 + 11 + 13 + 14 = 61, R� = 6(14 + 1) − 61 = 29, The critical value at α = 0.025 is 29 [Table 21]., Reject the null hypothesis; alternatively, the experiment could be repeated.
Page 138 :
THE TESTS, , 129, , Test 71 The rank correlation test for randomness of, a sample, Object, To test that the fluctuations in a sample have a random nature. This test may be used to, test the elements of a time series for the presence of a trend., Limitations, This is a distribution-free test, applicable if the observations occur in a natural sequence, and have been obtained under similar or comparable conditions. It is sensitive to the, occurrence of a positive or negative trend, and relatively insensitive to the occurrence, of sudden jumps., Method, The observations are ranked in increasing order of magnitude Ri . The correlation, between these rank and the integers representing the natural order of the observations, is then calculated. This can be tested using the Spearman rank correlation test (Test 58), or the Kendall rank correlation test (Test 59). If the sample is larger than the T statistic, T can be compared with the critical value of the normal distribution., Example, A merchandising manager observes the sales of a particular item of clothing across all, her stores. She is looking for a discernable trend so that she can be pre-emptive of stock, challenges. She produces a Spearman rank correlation between the natural order and, the sorted data order of 0.771. Her T statistic is 3.36 which is in the critical region. She, thus rejects the null hypothesis of randomness and is able to adjust production levels, to account for this trend., Numerical calculation, Order (xi ), Obs., Rank (yi ), , 1, 98, 1, , 2, 101, 4, , 3, 110, 10, , 4, 105, 7, , 5, 99, 2, , 6, 106, 8, , 7, 104, 6, , 8, 109, 9, , 9, 100, 3, , 10, 102, 5, , Order (xi ), Obs., Rank (yi ), , 11, 119, 15, , 12, 123, 17, , 13, 118, 14, , 14, 116, 13, , 15, 122, 16, , 16, 130, 20, , 17, 115, 12, , 18, 124, 18, , 19, 127, 19, , 20, 114, 11, , �, , (xi − yi )2 = 304 = R, 6R, rR = 1 −, = 0.771, n(n2 − 1), 6R − n(n2 − 1), = −3.36, T=, √, n(n + 1) n − 1, The critical value at α = 0.05 is 1.96 [Table 1]., The calculated value is greater than the critical value., Reject the null hypothesis.
Page 139 :
130, , 100 STATISTICAL TESTS, , Test 72 The Wilcoxon–Wilcox test for comparison of, multiple treatments of a series of subjects, Object, To compare the significance of the difference in response for K treatments applied to n, subjects., Limitations, It is assumed that a subject’s response to one treatment is not affected by the same, subject’s response to another treatment; and that the response distribution for each, subject is continuous., Method, The data are represented by a table of n rows and K columns. The rank numbers, 1, 2, . . . , K are assigned to each row and then the sum of the rank numbers for each, column, Rj ( j = 1, 2, . . . , K) is determined. A pair of treatments, say p and q, can, now be compared by using as test statistic |Rp − Rq |. If this exceeds the critical value, obtained from Table 32 the null hypothesis of equal effects of the p and q treatments is, rejected., Example, Six different ice cream flavours are compared by six tasters who assign a score (1 to 25), to each flavour. The food technologist wishes to compare each flavour with the others, and uses the Wilcoxon–Wilcox test of multiple treatments. She finds that the rank sum, difference for the flavours comparisons A–E, A–F and D–F are significant., Numerical calculation, Rank sums, Serial no. A, , B, , Rank sum differences |Rp − Rq|, , Sample, C D, , 1, 2, 3, 4, 5, 6, , 1, 1, 2, 1, 2, 1, , 5, 3, 3, 4, 5, 3, , 3, 6, 4, 3, 3, 6, , 2, 2, 1, 2, 1, 2, , Rank sum, , 8, , 23, , 25, , 10, , E, 4, 4, 5, 6, 4, 4, , F A 8, 6 D 10, 5 B 23, 6 C 25, 5 E 27, , D, , B, , C, , E, , F, , 2, , 15, 13, , 17, 15, 2, , 19*, 17, 4, 2, , 25*, 23*, 10, 8, 6, , 6, 5 * Exceeds critical value., , 27 33, , K = 6, n = 6, α = 0.05, critical value = 18.5 [Table 32].
Page 140 :
THE TESTS, , 131, , Test 73 Friedman’s test for multiple treatment of, a series of subjects, Object, To investigate the significance of the differences in response for K treatments applied, to n subjects., Limitations, It is assumed that a subject’s response to one treatment is not affected by the same, subject’s response to another treatment; and that the response distribution for each, subject is continuous., Method, The data can be represented by a table of n rows and K columns. In each row the, rank numbers 1, 2, . . . , K are assigned in order of increasing value. For each of the K, columns the rank sum Rj ( j = 1, 2, . . . , K) is determined., The test statistic is, �, 12, Rj2 − 3n(K + 1)., nK(K + 1), K, , G=, , j=1, , If this exceeds the critical χ 2 value obtained from Table 5 with K −1 degrees of freedom,, the null hypothesis that the effects of the K treatments are all the same is rejected., If ties occur in the ranking procedure one has to assign the average rank member for, each series of equal results. In this case the test statistic becomes, 12(K − 1)S, nK 3 − D, �, � 3, 2, where S = K, fi ti ., j=1 (Rj − R̄) and D =, , G=, , Example, Four different newspaper advertisement styles are compared to see if they produce, the same effect on a panel of viewers/consumers. The different styles relate to size, and position. There are 15 panel members and they rank each advertisement. The test, statistic produced by this procedure is 12.51. The critical value from Table 5 is 7.81., So we conclude that the advertisement styles are not equally effective., Numerical calculation, ti is the size of the ith group of equal observations., n(K + 1), n = 15, K = 4, R̄ =, 2
Page 141 :
132, , 100 STATISTICAL TESTS, , Rank numbers (showing many ties), , Rows (n), , c1, , Columns (K), c2, c3, , 1, 2, 3, 4, 5, 6, 7, 8, 9, 10, 11, 12, 13, 14, 15, , 3.5, 4.0, 1.5, 3.5, 3.0, 3.0, 3.5, 2.5, 3.0, 2.5, 3.5, 4.0, 2.5, 3.0, 4.0, , 3.5, 2.0, 3.5, 3.5, 3.0, 3.0, 1.5, 2.5, 3.0, 2.5, 1.5, 2.0, 2.5, 3.0, 2.0, , 1.5, 2.0, 2.5, 1.5, 3.0, 1.0, 3.5, 2.5, 1.0, 2.5, 3.5, 2.0, 2.5, 3.0, 3.0, , 1.5, 2.0, 2.5, 1.5, 1.0, 3.0, 1.5, 2.5, 3.0, 2.5, 1.5, 2.0, 2.5, 1.0, 1.0, , 47, 37.5, +9.5, , 39, 37.5, +1.5, , 35, 37.5, −2.5, , 29, 37.5, −8.5, , Rj, R̄, Rj − R̄, S=, , c4, , �, , (Rj − R̄)2 = 171, , Here 1, 2, 3 and 4 are the size of the groups of equal observations and D =, ti, , fi, , fi ti, , fi ti3, , 1, 2, 3, 4, , 7, 10, 7, 3, , 7, 20, 21, 12, , 7, 80, 189, 192, , 60, , 468, , Total, Hence D = 468, G=, , 12 × (4 − 1) × 171, = 12.51, 15 × 43 − 468, , 2, = 7.81 [Table 5]., The critical value is χ3;005, Since G > 7.81, reject the null hypothesis., , �, , fi ti3 .
Page 142 :
THE TESTS, , 133, , Test 74 The rank correlation test for agreement in, multiple judgements, Object, To investigate the significance of the correlation between n series of rank numbers,, assigned by n members of a committee to K subjects., Limitations, This test can be applied if the judges decide independently and if the subjects show, obvious differences in the quality being judged., Method, Let n judges give rank numbers to K subjects., Compute S = nK(K 2 − 1)/12 and SD = the sum of squares of the differences, between subjects’ mean ranks and the overall mean rank. Let, D1 =, , SD, D1, D2, , S22 =, ., , D2 = S − D1 , S12 =, n1, K −1, K(n − 1), , The test statistic is F = S12 /S22 which follows the F-distribution with (K − 1, K(n − 1)), degrees of freedom. If this exceeds the critical value obtained from Table 3, the null, hypothesis of agreement between the judgements is rejected., Example, A wine tasting panel is selected by asking a number of questions and also by tasting, assessment. In one assessment three judges are compared for agreement. One of the, judges is an expert taster. Ten wines are taken and the judges are asked to rank them, on a particular taste criterion. Are the three judges consistent? The test statistic, F is, 0.60,which is less than the tabulated value of 2.39. So the new panel members can be, recruited., Numerical calculation, n = 3, K = 10, ν1 = K − 1 = 9, ν2 = K(n − 1) = 20, , Judge 1, Judge 2, Judge 3, Total score, Mean, Difference, , Rank number, E, F, , A, , B, , C, , D, , 1, 7, 9, , 2, 10, 6, , 3, 4, 10, , 4, 1, 3, , 18, 16.5, 1.5, , 17, 8, 16, 18, 23, 21, 13, 14, 165, 16.5 16.5 16.5 16.5 16.5 16.5 16.5 16.5 165, 0.5 −8.5 −0.5, 1.5, 6.5 4.5 −3.5 −2.5, , 17, 16.5, 0.5, , 5, 6, 5, , 6, 8, 4, , G, , H, , I, , J, , 7, 9, 7, , 8, 5, 8, , 9, 2, 2, , 10, 3, 1, , Total, 55, 55, 55
Page 143 :
134, , 100 STATISTICAL TESTS, , 3 × 10(100 − 1), = 247.5, SD = 158.50,, 12, 158.50, D1 =, = 52.83, D2 = S − D1 = 247.50 − 52.83 = 194.67,, 3, 194.67, 52.83, 194.67, S12 =, =, = 9.73, = 5.87, S22 =, 10 × 2, 20, 9, 5.87, F = S12 /S22 =, = 0.60, 9.73, S=, , Critical value F9; 20; 0.05 = 2.39 [Table 3]., Do not reject the null hypothesis.
Page 144 :
THE TESTS, , 135, , Test 75 A test for the continuous distribution of, a random variable, Object, To test a model for the distribution of a random variable of the continuous type., Limitations, This test is applicable if some known continuous distribution function is being tested., A partition of the random values into different sets must be available using the closed, interval [0.1]., Method, Let F(W ) be the distribution function of W which we want to test. The null hypothesis, is, H0 : F(W ) = F0 (W ), where F0 (W ) is some known continuous distribution function., The test is based on the χ 2 statistic. In order to use this, we must partition the set, of possible values of W into k (not necessarily equal) sets. Partition the interval [0, 1], into k sets such that 0 = b0 < · · · < bk = 1. Let ai = F0−1 (bi ), i = 1, 2, . . . , k − 1,, A1 = [−α, a1 ], Ai = [−ai−1 , ai ], for i = 2, 3, . . . , k − 1 and Ak = (ak−1 , α); pi =, P(W ∈ Ai ), i = 1, 2, . . . , k. Let Yi denote the number of times the observed value of, W belongs to Ai , i = 1, 2, . . . , k in n independent repetitions of the experiment. Then, Y1 , Y2 , . . . , Yk have a multinomial distribution with parameters n, p1 , p2 , . . . , pk . Let, πi = P(W ∈ Ai ) when the distribution function of W is F0 (W )., Then we test the hypothesis:, H0∗ : pi = πi ,, , i = 1, 2, . . . , k., , H0∗ is rejected if the observed value of the χ 2 statistic, Qk−1 =, , k−1, �, (Yi − nπi )2, i=1, , nπi, , is at least as great as C, where C is selected to yield the desired significance level., Example, A continuous distribution is tested by calculating Q9 which follows approximately a, chi-squared distribution. The value of 4.0 is compared with 16.92 from Table 5. Since, the calculated value is not in the critical region, the null hypothesis that the data follows, the given continuous distribution is accepted.
Page 145 :
136, , 100 STATISTICAL TESTS, , Numerical calculation, Let W denote the outcome of a random experiment. Let F(W ) denote the distribution, function of W and let, ⎧, ⎪, W < −1, ⎨0,, F0 (W ) = 21 (W 3 + 1), −1 � W < 1, ⎪, ⎩1,, W � 1., The interval [−1, 1] can be partitioned into 10 sets of equal probability with the point, bi = i/10, i = 0, 1, . . . , 10., 1, , If ai = F −1 (bi ) = (2bi − 1) 3 , i = 1, 2, . . . , 9 then the sets A1 = [−1, a1 ], A2 =, [a1 , a2 ], . . . , A10 = [A9 , 1] will each have probability 0.1. If the random sample of size, n = 50 is observed then nπi = 50 × 0.1 = 5.0. Let the summary of the 50 observed, values be, A1 = 6, A2 = 4, A3 = 5, A4 = 6, A5 = 4, A6 = 4, A7 = 6, A8 = 8, A9 = 3, A10 = 4., Then the calculated value of Q9 is, Q9 =, , (4 − 5)2, (4 − 5)2, (6 − 5)2, +, + ··· +, = 4.0., 5, 5, 5, , 2, = 16.92 [Table 5]., Critical value χ9;0.05, Hence do not reject the null hypothesis.
Page 146 :
THE TESTS, , 137, , Test 76 A test for the equality of multinomial, distributions, Object, To test the equality of h independent multinomial distributions., Limitations, If pi is the probability of an item being assigned to the ith class, then this test is applicable, if yij is the number of items occurring in the class associated with pi ., Method, Let pij = P(Ai ), i = 1, 2, . . . , k; j = 1, 2, . . . , h. It is required to test, H0 : pi1 = pi2 = · · · = pih = pi ,, , i = 1, 2, . . . , k., , Carry out the jth experiment nj times, making sure that the nj instances are independent,, and let Y1j , Y2j , . . . , Ykj denote the frequencies of the respective events A1 , A2 , . . . , Ak ., Then, Q=, , k, h �, �, (Yij − nj pij )2, j=1 i=1, , nj pij, , has an approximate χ 2 -distribution with h(k − 1) degrees of freedom. Under H0 we, estimate k − 1 probabilities from, h, �, , p̂i =, , Yij, , j=1, h, �, , ,, , i = 1, 2, . . . , k − 1;, , nj, , j=1, , the estimate of pk then follows from p̂k = 1 −, Q=, , �k−1, i=1, , p̂i . Then, , k, h �, �, (Yij − nj p̂i )2, j=1 i=1, , nj p̂i, , has an approximate χ 2 -distribution with, h(k − 1) − (k − 1) = (h − 1)(k − 1), degrees of freedom.
Page 147 :
138, , 100 STATISTICAL TESTS, , Example, An electronic allocation of visual stimuli to one of five categories, or grades ensures, that the allocations are equally likely and not subject to any bias effects. An experiment, to allocate 50 stimuli to 5 grades is repeated once. Are the allocations equally likely?, The computed Q statistic of 5.18 is less than the tabulated value of 9.488 (Table 5) so, there is no justification to suspect unequal allocation probabilities., Numerical calculation, , Group, , A1, , A2, , Grade, A3, , A4, , A5, , Total, , 1, 2, , 8, 4, , 13, 9, , 16, 14, , 10, 16, , 3, 7, , 50, 50, , n = 50, 8+4, = 0.12, P(A2 ) = 0.22, P(A3 ) = 0.30, 100, P(A4 ) = 0.26, P(A5 ) = 0.10, P(A1 ) =, , Thus we have estimates of n1 Pi1 = 6, n2 Pi2 = 11, n3 Pi3 = 15, n4 Pi4 = 13 and, n5 Pi5 = 5, respectively., Hence the computed value of Q is:, (16 − 15)2, (10 − 13)2, (3 − 5)2, (13 − 11)2, (8 − 6)2, +, +, +, +, 5, 11, 15, 13, 6, 2, 2, 2, 2, (9 − 11), (14 − 15), (16 − 13), (7 − 5)2, (4 − 6), +, +, +, +, +, 6, 11, 15, 13, 5, = 5.18, , Q=, , The critical value is χ4;2 005 = 9.488 [Table 5]., The calculated value is less than the critical value. Do not reject the null hypothesis.
Page 149 :
140, , 100 STATISTICAL TESTS, , Then the sum of squares due to interaction, i.e. due to λ∗ , is given by, ⎡, ⎣, , ⎤2, , ��, i, , sλ2∗ =, , �, , αi βj Yij ⎦, , j, , αi2, , �, , i, , βj2, , j, , with l degrees of freedom. The sum of squares due to non-additivity is given by, ⎡, , ��, , ⎣, , i, , 2, sN, =, , �, , ⎤2, αi∗ βj∗ Yij ⎦, , j, , αi∗2, , i, , �, , βj∗2, , ., , j, , 2 /σ 2 and (s2 − s2 )/σ 2 = s2 are, For all given αi∗ , βj∗ , for all i, j, we have that sN, E, N, R, independent and have χ 2 -distribution with 1 and ( p−1)(q −1)−1 degrees of freedom,, respectively., We reject H0 : λ = 0 at level α if the variance ratio for non-additivity is too large,, i.e. if, , [( p − 1)(q − 1) − 1], , 2, sN, 2, sR, , > F1,(p−1)(q−1)−1; α, , and fail to reject otherwise., Example, A thermal bond is tested to assess whether the resultant strength of the bond is the result, of the combination of the main effects of temperature and pressure only. That is, no, temperature/pressure interaction exists. There are four levels of temperature and three, levels of pressure. The F test statistic for non-additivity is 0.2236 which is compared, with the critical tabulated value of 6.61 [Table 3]. Since the calculated F is less than, the critical value the assumption of no interaction is upheld., Numerical calculation, i, 1, 2, 3, Y0j, Ȳ0j, , j, , 1, , 2, , 3, , 4, , Yi0, , Ȳi0, , 14, 2, 2, 18, 6, , 2, 0, 1, 3, 1, , 1, 2, 5, 8, 2.7, , 2, 2, 0, 4, 1.33, , 19, 6, 8, 33, , 4.75, 1.5, 2
Page 151 :
142, , 100 STATISTICAL TESTS, , Test 78 F -test for testing main effects and interaction, effects in a two-way classification, Object, To test the main effects and interaction effects for the case of a two-way classification, with an equal number of observations per cell., Limitations, This test is applicable if the error in different measurements is normally distributed; if, the relative size of these errors is unrelated to any factor of the experiment; and if the, different measurements themselves are independent., Method, Suppose we have n observations per cell of the two-way table, the observations being, Yijk , i = 1, 2, . . . , p (level of A); j = 1, 2, . . . , q (level of B) and k = 1, 2, . . . , r. We use, the model:, Yijk = µ + αi + βj + (αβ)ij + eijk, subject to the conditions that, �, i, , αi =, , �, , �, �, (αβ)ij =, (αβ)ij = 0, , βj =, , j, , j, all j, , i, all i, , and that the eij are independently N(0, σ 2 ). Here (αβ)ij is the interaction effect due to, simultaneous occurrence of the ith level of A and the jth level of B. We are interested, in testing:, HAB : all (αβ)ij = 0,, HA : all αi = 0,, HB : all βj = 0., Under the present set-up, the sum of squares due to the residual is given by, sE2 =, , ���, (Yijk − Yij0 )2 ,, i, , j, , k, , with rpq − pjq degrees of freedom, and the interaction sum of squares due to HAB is, r, , ��, , 2ij ,, (αβ), i, , j
Page 152 :
THE TESTS, , 143, , with (p − 1)(q − 1) degrees of freedom, where, , ij = Yij0 − Yi00 − Y0j 0 + Y000, (αβ), and this is also called the sum of squares due to the interaction effects., 2 and s̄2 respectively. The null, Denoting the interaction and error mean squares by s̄AB, E, hypothesis HAB is tested at the α level of significance by rejecting HAB if, 2, s̄AB, , s̄E2, , > F(p−1)(q−1), pq(r−1); α, , and failing to reject it otherwise., For testing HA : ai = σ for all i, the restricted residual sum of squares is, s12 =, , ���, (Yijk − Yij0 + Yi00 − Y000 )2, i, , j, , k, , �, = sE2 + rq, (Yi00 − Y000 )2 ,, i, , with rpq − pq + p − 1 degrees of freedom, and, sA2 = rq, , �, (Yi00 − Y000 )2 ,, i, , with p − 1 degrees of freedom. With notation analogous to that for the test for HAB , the, test for HA is then performed at level α by rejecting HA if, s̄A2, s̄E2, , > F(p−1), pq(r−1); α, , and failing to reject it otherwise. The test for HB is similar., Example, An experiment is conducted in which a crop yield is compared for three different levels, of pesticide spray and three different levels of anti-fungal seed treatment. There are, four replications of the experiment at each level combination. Do the different levels, of pesticide spray and anti-fungal treatment effect crop yield and is there a significant, interaction? The ANOVA table yields F ratios that are all below the appropriate F value, from Table 3 so the experiment has yielded no significant effects and the experimenter, needs to find more successful treatments.
Page 153 :
144, , 100 STATISTICAL TESTS, , Numerical calculation, , A, , I, , B, II, , III, , 1, , 95, 85, 74, 74, 90, 80, 92, 82, 70, 80, 85, 85, , 60, 90, 80, 70, 89, 90, 91, 86, 68, 73, 78, 93, , 86, 77, 75, 70, 83, 70, 75, 72, 74, 86, 91, 89, , 2, , 3, , sA2 = 3 × 4 ×, , �, , Table of means, Ȳi· ·, , Ȳij, 1, 2, 3, , 82, 86, 80, , 75, 89, 78, , 77, 75, 85, , 78.0, 83.3, 81.0, , Ȳ.j., , 82.7, , 80.7, , 79.0, , Ȳ···, 80.8, , (Ȳi·· − Ȳ··· )2 = 3 × 4 × 14.13 = 169.56, , i, , sB2 = 3 × 4 ×, , �, , (Ȳ·j· − Ȳ··· )2 = 12 × 6.86 = 82.32, , j, , 2, sAB, , ��, =4, (Ȳij· − Ȳi· · − Ȳ·j· + Ȳ··· )2 = 4 × 140.45 = 561.80, i, , j, , ���, sE2 =, (Yijk − Ȳij· )2 = 1830.0, i, , j, , k, , ANOVA table, Source, A, B, AB, Error, , SS, , DF, , MS, , F ratio, , 169.56, 82.32, 561.80, 1830.00, , 2, 2, 4, 27, , 84.78, 41.16, 140.45, 67.78, , 1.25, 0.61, 2.07, , Critical values F2, 27 (0.05) = 3.35 [Table 3],, F4, 27 (0.05) = 2.73 [Table 3]., Hence we do not reject any of the three hypotheses.
Page 154 :
THE TESTS, , 145, , Test 79 F -test for testing main effects in a two-way, classification, Object, To test the main effects in the case of a two-way classification with unequal numbers, of observations per cell., Limitations, This test is applicable if the error in different measurements is normally distributed; if, the relative size of these errors is unrelated to any factor of the experiment; and if the, different measurements themselves are independent., Method, We consider the case of testing the null hypothesis, HA : αi = 0, , for all i, , and, , HB : βj = 0, , for all j, , under additivity. Under HA , the model is:, Yijk = µ + βj + eijk ,, with the eijk independently N(0, σ 2 ). The residual sum of squares (SS) under HA is, ���, �, 2, Yijk, −, Cj2 /n·j·, s22 =, i, , j, , j, , k, , �, with n − q degrees of freedom, where n·j·, αi = Cj and nij is the number, �(µ + βj ) + i nij�, of observations in the (i, j)th cell and j nij = ni· and i nij = n·j· the adjusted SS, due to A is, ⎛, ⎞, �, �, ⎝Ri −, pij Cj ⎠ α̂i, SSA∗ = s22 − s12 =, i, , with p − 1 degrees of freedom, where ni· (µ + αi ) +, Under additivity, the test statistic for HA is, , j, , �, , j nij βj, , = Ri , pij = nij /n.j ., , SSA∗ n − p − q + 1, ,, p−1, s12, which, under HA , has the F-distribution with (p − 1, n − p − q + 1) degrees of freedom., Similarly, the test statistic for HB is, SSB∗ n − p − q + 1, ,, q−1, s12
Page 155 :
146, , 100 STATISTICAL TESTS, , which, under HB , has the F-distribution with (q − 1, n − p − q + 1) degrees of freedom;, �, �, where SSB∗ = j (Cj − i qij Ri )β̂j is the adjusted SS due to B, with q − 1 degrees of, freedom., Example, Three different chelating methods (A) are used on three grades of vitamin supplement, (B). The availability of vitamin is tested by a standard timed-release method. Since some, of the tests failed there are unequal cell numbers. An appropriate analysis of variance is, conducted, so that the sums of squares are adjusted accordingly. Here chelating method, produce significantly different results but no interaction is indicated. However, Grade, of vitamin has indicated no differences., Numerical calculation, , B, , 1, , A, 2, 22, , 88, (172), 84, [0.2500], , 26, (71), 23, [0.4286], , 2, , 108, 98, (308), 102, [0.3750], , 10, (34), 24, [0.2857], , 3, , 108, 80, (276), 88, [0.3750], , 20, (36), 16, [0.2857], , Total, , 756, , 1, , 141, , Total, , 3, 60, (126), 66, [0.2857], , 369, , 82, 54, (196), 60, [0.4286], , 538, , 50, (82), 32, [0.2857], 404, , 394, , 1301, , Note, 1. Values in parentheses are the totals., 2. Values in brackets are the ratio of the number of observations divided by the column, total number of observations, e.g. the first column has 2/8 = 0.25., T = 1301, and T2 = observation sum of squares = 100 021, T2, CF (correction factor) =, = 76 936.41, N, T2, = 23 084.59, Total SS = T2 −, N
Page 156 :
THE TESTS, , 147, , SS between cells = 21 (172)2 + 13 (71)2 + · · · + 21 (82)2 − CF = 21 880.59, SS within cells (error) = total SS − SS between cells = 1204.00, SSA unadjusted = 18 (756)2 + 17 (141)2 + 17 (404)2 − CF = 20 662.30, SSB unadjusted = 17 (369)2 + 18 (538)2 + 17 (394)2 − CF = 872.23, C11 = 7 − 2(0.2500) − 3(0.4286) − 2(0.2857) = 4.6428, C12 = −5.0178, Q1 = 369 − 756(0.2500) − 141(0.4286), − 404(0.2857) = 4.145, Q2 = 41.062, Q3 = −45.2065, α̂1 = 0.8341, α̂2 = 5.4146, α̂3 = −6.2487, SSB adjusted = Q1 α̂1 + Q2 α̂2 + Q3 α̂3 = 508.27, SSA adjusted = SSB adjusted + SSA unadjusted, − SSB unadjusted = 20 298.34, SS interaction = SS between cells − SSB adjusted, − SSA unadjusted = 710.02, ANOVA table, Source, , DF, , SS, , MS, , F ratio, , SSA adjusted, SSB adjusted, Interaction AB, Error, , 2, 2, 4, 13, , 20 298.34, 508.27, 710.02, 1 204.00, , 10 149.17, 254.14, 177.50, 92.62, , 109.58, 2.744, 1.92, , Critical values F2,13; 0.05 = 3.81 [Table 3], F4,13; 0.05 = 3.18 [Table 3], The main effects of A is significantly different, whereas the main effect B and interaction, between A and B are not significant.
Page 157 :
148, , 100 STATISTICAL TESTS, , Test 80 F -test for nested or hierarchical classification, Object, To test for nestedness in the case of a nested or hierarchical classification., Limitations, This test is applicable if the error in different measurements is normally distributed; if, the relative size of these errors is unrelated to any factor of the experiment; and if the, different measurements themselves are independent., Method, In the case of a nested classification, the levels of factor B will be said to be nested with, the levels of factor A if any level of B occurs with only a single level of A. This means, that if A has p levels, then the q levels of B will be grouped into p mutually exclusive, and exhaustive groups, such that the ith group of levels of B occurs only with the ith, level of A in the observations. Here we shall only consider two-factor nesting, where, the number of levels �, of B associated with the ith level of A is qi , i.e. we consider the, case where there are i qi levels of B., For example, consider a chemical experiment where factor A stands for the method, of analysing a chemical, there being p different methods. Factor B may represent the, different analysts, there being qi analysts associated with the ith method., The jth analyst performs the nij experiments allotted to him. The corresponding fixed, effects model is:, Yijk = µ + αi + βij + eijk ,, p, �, , i = 1, 2, . . . , p; j = 1, 2, . . . , qi ;, k = 1, 2, . . . , nij ,, , ni αi =, , �, , nij ,, , n=, , �, , j, , nij βj = 0, , j, all j, , i=l, , ni =, , �, , ni and eijk are independently N(0, σ 2 )., , i, , We are interested in testing HA : αi = 0, for all i, and HB : βij = 0, for all i, j., The residual sum of squares is given by, sE2 =, , ���, (Yijk − Yij0 )2, i, , with, are, , �, , ij (nij, , j, , k, , − 1) degrees of freedom; the sums of squares due respectively to A and B, sA2 =, , �, i, , ni (Yi00 − Y000 )2
Page 158 :
THE TESTS, , 149, , with p − 1 degrees of freedom, and, sB2 =, , ��, i, , nij (Yij0 − Yi00 ), , j, , �, with i (qi − 1) degrees of freedom., To perform the tests for HA and HB we first require the mean squares, s̄E2 , s̄A2 and s̄B2 ,, corresponding to these sums of squares; we then calculate s̄A2 /s̄E2 to test HA and s̄B2 /s̄E2 to, test HB , each of which, under the respective null hypothesis, follows the F-distribution, with appropriate degrees of freedom., Nested models are frequently used in sample survey investigations., Example, An educational researcher wishes to establish the relative contribution from the teachers, and schools towards pupils’ reading scores. She has collected data relating to twelve, teachers (three in each of four schools). The analysis of variance table produces an F, ratio of 1.46 which is less than the critical value of 2.10 from Table 3. So the differences, between teachers are not significant. The differences between schools are, however,, significant since the calculated F ratio of 6.47 is greater than the critical value of 4.07., Why the schools should be different is another question., Numerical calculation, Scores of pupils from three teachers in each of four schools are shown in the following, table., Schools, I, , 1, 44, 41, 39, 36, 35, 32, , II, Teacher, 2, 39, 37, 35, 35, 34, 30, , Teacher total 227, 210, Mean, 37.83 35.0, School total, Mean, , 3, , 1, , 39, 36, 33, 31, 28, 26, , 51, 49, 45, 44, 40, 40, , III, Teacher, 2, 48, 43, 42, 40, 37, 34, , IV, , 3, , 1, , Teacher, 2, , 3, , 1, , 44, 43, 42, 39, 37, 36, , 46, 43, 41, 40, 36, 34, , 45, 40, 38, 38, 35, 34, , 43, 41, 39, 37, 34, 33, , 42, 39, 38, 36, 34, 31, , Teacher, 2, 45, 40, 37, 37, 32, 32, , 3, 39, 38, 35, 35, 35, 29, , 193, 269, 244, 241, 240 230, 227, 220, 223, 211, 32.17 44.83 40.67 40.17 40.0 38.33 37.83 36.67 37.17 35.17, , 630, 35.00, , T = 2735, , 754, 41.89, , 697, 38.72, , 27352, = 103 892.01, 72, Total sum of squares = 105 637.00 − 103 892.01 = 1744.99, , CF (correction factor) =, , 654, 36.34, , 2735
Page 159 :
150, , 100 STATISTICAL TESTS, , Between-schools sum of squares, 6302, 7542, 6972, 6542, =, +, +, +, − CF = 493.60, 18, 18, 18, 18, Between teachers (within school) sum of squares, 2272, 2102, 1932, 6302, =, +, +, +, + similar terms for schools II, III and IV = 203.55, 6, 6, 6, 18, Within-group sum of squares = 1744.99 − 493.60 − 203.55 = 1047.84., ANOVA table, DF, , SS, , Mean square, 164.53, 25.44, 17.46, , Schools, Teachers within school, Pupils within teachers, , 3, 8, 60, , 493.60, 203.55, 1047.84, , Total, , 71, , 1744.99, , Teacher differences:, 25.44, = 1.46, F=, 17.46, Critical value F8,60; 0.05 = 2.10 [Table 3]., The calculated value is less than the critical value., Hence the differences between teachers are not significant., School differences:, 164.53, = 6.47, F=, 25.44, Critical value F3,8; 0.05 = 4.07 [Table 3]., The calculated value is greater than the critical value., Hence the differences between schools are significant.
Page 160 :
THE TESTS, , 151, , Test 81 F -test for testing regression, Object, To test the presence of regression of variable Y on the observed value X., Limitations, For given X, the Y s are normally and independently distributed. The error terms are, normally and independently distributed with mean zero., Method, Suppose, corresponding to each value Xi (i = 1, 2, . . . , p) of the independent random, variable X, we have a corresponding array of observations Yij ( j = 1, 2, . . . , ni ) on the, dependent variable Y . Using the model:, Yij = µi + eij ,, , i = 1, 2, . . . , p,, , j = 1, 2, . . . , ni ,, , where the eij are independently N(0, σ 2 ), we are interested in testing H0 : all µi are, equal, against H1 : not all µi are equal. ‘H0 is true’ implies the absence of regression of, Y on X. Then the sums of squares are given by, ��, �, (Yij − Yi0 )2 ., ni (Yi0 − Y00 )2 , sE2 =, sB2 =, i, , i, , j, , 2 and s̄2 respectively, then, under H ,, Denoting the corresponding mean squares by s̄B, 0, E, 2, 2, F = s̄B /s̄E follows the F-distribution with (p − 1, n − p) degrees of freedom., , Example, It is desired to test for the presence of regression (i.e. non-zero slope) in comparing an, independent variable X, with a dependent variable Y ., A small-scale experiment is set up to measure perceptions on a simple dimension, (Y ) to a visual stimulus (X). The results test for the presence of a regression of Y on X., The experiment is repeated three times at two levels of X., Since the calculated F value of 24 is larger than the critical F value from Table 3,, the null hypothesis is rejected, indicating the presence of regression., Numerical calculation, Yij, X1, , 1, , X2, , 7, , 2, , 3, , ni, �, Yij, , n1 = 3, where Yi0 =, , ,, ni, � � Yij, , i = 1, 2, . . . , p, , j=1, , 5, , 6, , n2 = 3, and Y00 =, , i, , j, , n, , ,, , n=, , �, , ni
Page 161 :
152, , 100 STATISTICAL TESTS, , Hence Y10 =, Y00 =, , 1+2+3, 7+5+6, = 2, Y20 =, = 6,, 3, 3, 1+2+3+7+5+6, =4, 6, , 2 = 3(2 − 4)2 + 3(6 − 4)2 = 24, sB, , sE2 = (1 − 2)2 + (2 − 2)2 + (3 − 2)2 + (7 − 6)2 + (5 − 6)2 + (6 − 6)2 = 4, 2 = 24/1 = 24, s̄2 = 4/4 = 1, F = 24/1 = 24, s̄B, E, , Critical value F1,4; 0.05 = 7.71 [Table 3]., Hence reject the null hypothesis, indicating the presence of regression.
Page 162 :
THE TESTS, , 153, , Test 82 F -test for testing linearity of regression, Object, To test the linearity of regression between an X variable and a Y variable., Limitations, For given X, the Y s are normally and independently distributed. The error terms are, normally and independently distributed with mean zero., Method, Once the relationship between X and Y is established using Test 81, we would further, like to know whether the regression is linear or not. Under the same set-up as Test 81,, we are interested in testing:, H0 : µi = α + βXi ,, Under H0 ,, sE2 =, , i = 1, 2, . . . , n,, , �, �, ni (xi − x̄)2 ,, (yi − ȳ) − b2, i, , i, , with n − 2 degrees of freedom, and the sum of squares due to regression, �, 2, sR, = b2, ni (xi − x̄)2 ,, i, , with 1 degree of freedom. The ratio of mean squares, 2 /s̄2 is used to test H with (1, n − 2) degrees of freedom., F = s̄R, 0, E, Example, In a chemical reaction the quantity of plastic polymer (Y ) is measured at each of four, levels of an enzyme additive (X). The experiment is repeated three times at each level, of X to enable a test of linearity of regression to be performed., The data produce an F value of 105.80 and this is compared with the critical F value, of 4.96 from Table 3. Since the critical value is exceeded we conclude that there is a, significant regression., Numerical calculation, , i, , 1, , 2, , 3, , 4, , 5, , 6, , 7, , 8, , 9, , 10, , 11, , 12, , xi 150, 150, 150, 200, 200, 200, 250, 250, 250, 300, 300, 300, yi 77.4 76.7 78.2 84.1 84.5 83.7 88.9 89.2 89.7 94.8 94.7 95.9, , n = 12, n − 2 = 10. For β = 0, test H0 : β = 0 against H1 : β � = 0
Page 163 :
154, , 100 STATISTICAL TESTS, , The total sum of squares is, �, , yi2 −, , �� �2 yi, n = 513.1167,, , and, �, 2, sR, =b, , �, , 1�, xi yi −, xi yi, n, � 2 1, xi − (xi )2, n, , �2, = 509.10,, , 2 = 42.425, s̄2 = 0.401, F = 105.80, sE2 = 4.0117, s̄R, E, Critical value F1,10; 0.05 = 4.96 [Table 3]., Hence reject the null hypothesis and conclude that β � = 0.
Page 164 :
THE TESTS, , 155, , Test 83 Z-test for the uncertainty of events, Object, To test the significance of the reduction of uncertainty of past events., Limitations, Unlike sequential analyses, this test procedure requires a probability distribution of a, variable., Method, It is well known that the reduction of uncertainty by knowledge of past events is the, basic concept of sequential analysis. The purpose here is to test the significance of this, reduction of uncertainty using the statistic, Z=�, , P(B+k |A) − P(B), P(B)[1 − P(B)][1 − P(A)], (n − k)P(A), , where P(A) = probability of A, P(B) = probability of B and P(B+k |A) = P(B|A) at lag k., Example, An economic researcher wishes to test for the reduction of uncertainty of past events., He notes that following a financial market crash (event A) a particular economic index, rises (event B). His test statistic of Z = 2.20 is greater than the tabulated value of, 1.96 from Table 1. This is a significant result allowing him to claim a reduction of, uncertainty for events A and B., Numerical calculation, Consider a sequence of A and B: AA BA BA BB AB AB, n = 12,, , k = 1,, , P(A) =, , 6, = 0.5,, 12, , P(B) =, , 6, = 0.5, 12, , We note that A occurs six times and that of these six times B occurs immediately after, A five times. Given that A just occurred we have, P(B|A) at lag one = P(B+1 |A) =, , 5, = 0.83., 6, , Therefore the test statistic is, Z=�, , 0.83 − 0.50, = 2.20., 0.50(1 − 0.50)(1 − 0.50), (12 − 1)(0.50), , The critical value at α = 0.05 is 1.96 [Table 1]., The calculated value is greater than the critical value., Hence it is significant.
Page 165 :
156, , 100 STATISTICAL TESTS, , Test 84 Z-test for comparing sequential, contingencies across two groups using the, ‘log odds ratio’, Object, To test the significance of the difference in sequential connections across groups., Limitations, This test is applicable when a logit transformation can be used and 2 × 2 contingency, tables are available., Method, Consider a person’s antecedent behaviour (Wt ) taking one of the two values:, �, 1 for negative effect, Wt =, 0 for positive effect., Let us use Ht + 1, a similar notation, for the spouse’s consequent behaviour. A fundamental distinction may be made between measures of association in contingency tables, which are either sensitive or insensitive to the marginal (row) totals. A measure that, is invariant to the marginal total is provided by the so-called logit transformation. The, logit is defined by:, logit (P) = loge, , P, ., 1−P, , We can now define a statistic β as follows:, β = logit [Pr (Ht+k = 1|Wt = 1)] − logit[Pr (Ht+k = 1|Wt = 0)]., Hence β is known as the logarithm of the ‘odds ratio’ which is the cross product ratio in, a 2 × 2 contingency table, i.e. if we have a table in which first row is (a, b) and second, row is (c, d) then, � �, ad, β = log, ., bc, In order to test whether β is different across groups we use the statistic, β1 − β2, Z=� � �, � 1, fi, where fi is the frequency in the ith cell and Z is the standard normal variate, i.e. N(0, 1).
Page 166 :
THE TESTS, , 157, , Example, A social researcher wishes to test a hypothesis concerning the behaviour of adult, couples. She compares a man’s behaviour with a consequent spouse’s behaviour for, couples in financial distress and for those not in financial distress. A log-odds ratio test, is used. In this case the Z value of 1.493 is less than the critical value of 1.96 from, Table 1. She concludes that there is insufficient evidence to suggest financial distress, affects couples’ behaviour in the way she hypothesizes., Numerical calculation, Distressed couples, Wt+1, , Non-distressed couples, Wt+1, , Ht, , 1, , 0, , 1, , 0, , 1, 0, , 76, 79, , 100, 200, , 80, 43, , 63, 39, , 76 × 200, 80 × 39, = 0.654; β2 = loge, = 0.141, 79 × 100, 43 × 63, 0.654 − 0.141, Z=�, = 1.493, 1, 1, 1, 1, 1, 1, 1, 1, +, +, +, +, +, +, +, 76 79 100 200 80 43 63 39, β1 = loge, , The critical value at α = 0.05 is 1.96 [Table 1]., The calculated value is less than the critical value., Hence it is not significant and the null hypothesis (that β is not different across groups), cannot be rejected.
Page 167 :
158, , 100 STATISTICAL TESTS, , Test 85 F -test for testing the coefficient of multiple, regression, Object, A multiple linear regression model is used in order to test whether the population value, of each multiple regression coefficient is zero., Limitations, This test is applicable if the observations are independent and the error term is normally, distributed with mean zero., Method, Let X1 , X2 , . . . , Xk be k independent variables and X1i , X2i , . . . , Xki be their fixed values,, corresponding to dependent variables Yi . We consider the model:, �, + · · · + βk Xki� + ei, Yi = β0 + β1 X1i, , where Xji� = Xji − X̄j and the ei are independently N(0, σ 2 )., We are interested in testing whether the population value of each multiple regression, coefficient is zero. We want to test:, H0 : β1 = β2 = · · · = βk = 0, , against, , H1 : not all βk = 0, , for k = 1, 2, . . . , p − 1, where p is the number of parameters. The error sum of squares, is, �, � �, (Yi − Ȳ )2 −, bj, Yi Xji�, sE2 =, i, , j, , i, , with n − k − 1 degrees of freedom, where bj is the least-squares estimator of βj ., The sum of squares due to H0 is, � �, 2, sH, =, bj, Yi Xji�, j, , i, , 2, with k degrees of freedom. Denoting the corresponding mean squares by s̄E2 and s̄H, 2 /s̄2 follows the F-distribution with (k, n − k − 1), respectively, then, under H0 , F = s̄H, E, degrees of freedom and can be used for testing H0 ., The appropriate decision rule is: if the calculated F � Fp−1, n−p; 0.05 , do not reject, H0 ; if the calculated F > Fp−1, n−p; 0.05 , reject H0 ., , Example, In an investigation of the strength of concrete (Y ), a number of variables were measured, (X1 , X2 , . . . , Xk ) and a multiple regression analysis performed. The global F test is a
Page 168 :
THE TESTS, , 159, , test of whether any of the X variables is significant (i.e. any of the βi coefficients,, i = 1, . . . , k are non-zero)., The calculated F value of 334.35 is greater than the tabulated F value of 3.81 [Table 3]., So at least one of the X variables is useful in the prediction of Y ., Numerical calculation, n = 16, p = 3, ν = p − 1, ν2 = n − p, Critical value F2, 13; 0.05 = 3.81 [Table 3]., From the computer output of a certain set of data, 2 = 96.74439, s̄2 = 0.28935, s̄H, E, F = 96.74439/0.28935 = 334.35, Hence reject the null hypothesis.
Page 169 :
160, , 100 STATISTICAL TESTS, , Test 86 F -test for variance of a random effects model, Object, To test for variance in a balanced random effects model of random variables., Limitations, This test is applicable if the random variables are independently and normally, distributed with mean zero., Method, Let the random variable Yij···m for a balanced case be such that:, Yij···m = µ + ai + bij + cijk + · · · + eijk···m, where µ is a constant and the random variables ai , bij , cijk , . . . , eijk···m are completely, independent and ai ∼ N(0, σa2 ), . . . , bij ∼ N(0, σb2 ), cijk ∼ N(0, σc2 ), . . . , eijk···m ∼, N(0, σe2 )., Then the test for H0 = σi2 = σj2 (i � = j) against H1 = σi2 > σj2 is given by si2 /sj2, which is distributed as (σi2 /σj2 )F and follows the F-distribution with (fi , fj ) degrees of, freedom. Here si2 and sj2 are the estimates of σi2 and σj2 ., Example, An electronic engineer wishes to test for company and sample electrical static differences for a component used in a special process. He selects three companies at, random and also two samples. He collects four measurements of static from selected, components. Are the companies all the same with respect to electrical resistance of, the particular component? His analysis of variance calculation produces an F value of, 1.279. He compares this with the tabulated F value of 9.55 [Table 3] and concludes, that there is no evidence to suggest company differences., Numerical calculation, s12 = 5.69, s22 = 4.45, f1 = 2, f2 = 3, H0 : σ12 = σ22 ; H1 : σ12 > σ22, F=, , s12, s22, , =, , 5.69, = 1.279, 4.45, , Critical value F2,3; 0.05 = 9.55 [Table 3], Hence we do not reject the null hypothesis H0 ., f1 = n1 − 1 Here: n1 = 3, n2 = 2, f2 = 2n2 − 1
Page 170 :
THE TESTS, , 161, , Test 87 F -test for factors A and B and an interaction, effect, Object, To test for the homogeneity of factors A and B and the absence of an interaction effect., Limitations, This test is applicable if the random variables and interaction effects are jointly normal, with mean zero and the error terms are independently normally distributed with mean, zero., Method, Let the factor having fixed levels be labelled A and represented by the columns of the, table and let the randomly sampled factor be B and represented by the rows. Let, Yijk = µ + αi + bk + cjk + eijk, where, αi is the fixed effect of the treatment indicated by the column i;, bk = random variable associated with the kth row;, cjk = random interaction effect operating on the ( j, k)th cell; and, eijk = random error associated with observation i in the ( j, k)th cell., We make the following assumptions:, 2 ,, 1. bk and cjk are jointly normal with mean zero and with variance σB2 and σAB, respectively;, 2. eijk are normally distributed with mean zero and variance σE2 ;, 3. eijk are independent of bk and cjk ;, 4. eijk are independent of each other., 2 , s̄2 , s̄2 and s̄2, Denoting the column, interaction, row and error mean squares by s̄C, I R, E, 2 /s̄2 ∼ F, provides, an, appropriate, test, for, the, column, respectively, then s̄C, c−1,(r−1)(c−1), I, 2 /s̄2 ∼ F, 2, effects, i.e. H0 : σA2 = 0; s̄R, r−1, rc(n−1) provides a test for H0 : σB = 0; and, E, 2 = 0., s̄I2 /s̄E2 ∼ F(r−1)(c−1),r(n−1) provides a test for H0 : σAB, , Example, An educational researcher has collected data on pupils’ performance in relation to three, tasks; six classes are compared. The analysis of variance suggests that neither classroom, nor task factors is significant but their interaction is significant.
Page 171 :
162, , 100 STATISTICAL TESTS, , Numerical calculation, In the following table the values are a combination of classroom and task and represent, the independent performance of two subjects in each cell., , Classroom, 1, 2, 3, 4, 5, 6, Total, , Tasks, II, , I, 7.8, (16.5), 8.7, 8.0, (17.2), 9.2, 4.0, (10.9), 6.9, 10.3, (19.7), 9.4, 9.3, (19.9), 10.6, 9.5, (19.3), 9.8, 103.5, , 11.1, (23.1), 12.0, 11.3, (21.9), 10.6, 9.8, (19.9), 10.1, 11.4, (21.9), 10.5, 13.0, (24.7), 11.7, 12.2, (24.5), 12.3, 136.0, , III, 11.7, (21.7), 10.0, 9.8, (21.7), 11.9, 11.7, (24.3), 12.6, 7.9, (16.0), 8.1, 8.3, (16.2), 7.9, 8.6, (19.1), 10.5, 119.0, , CF (correction factor) = 358.52 /36 = 3570.0625, TSS = 7.82 + · · · + 10.52 − (3570.0625) = 123.57, The sums of squares are given by, (103.5)2 + (136.0)2 + (119.0)2, − CF = 44.04, 12, 61.32 + · · · + 62.92, 2, − CF = 6.80, =, sR, 6, 16.52 + · · · + 19.12, = 14.54, sE2 = 7.82 + · · · + 10.52 −, 2, sI2 = 123.57 − 44.04 − 6.8 − 14.54 = 58.19, , 2, =, sC, , Total, 61.3, 60.8, 55.1, 57.6, 60.8, 62.9, 358.5
Page 172 :
THE TESTS, , ANOVA table, Source, , DF, , SS, , MS, , F, , Column, Row, Interaction, Error, , 2, 5, 10, 18, , 44.04, 6.80, 58.19, 14.54, , 22.02, 1.36, 5.82, 0.81, , 3.78, 1.68, 7.19, , Total, , 35, , 123.57, , Critical values, , F10,18;0.05 = 2.41 [Table 3], F2,10; 0.05 = 4.10, F5,18; 0.05 = 2.77, , Hence H0 : σAB = 0 is rejected., H0 : σA2 = 0 is not rejected., H0 : σB2 = 0 is not rejected., , 163
Page 173 :
164, , 100 STATISTICAL TESTS, , Test 88 Likelihood ratio test for the parameter of, a rectangular population, Object, To test for one of the parameters of a rectangular population with probability density, function, ⎧, ⎨ 1 , α−β �X �α+β, f0 (X) = 2β, ⎩, 0,, otherwise., Limitations, This test is applicable if the observations are a random sample from a rectangular, distribution., Method, Let X1 , X2 , . . . , Xn be a random sample from the above rectangular population. We are, interested in testing H0 : α = 0 against H1 : α � = 0. Then, the likelihood ratio test, criterion for testing H0 is:, �, �, � �n, X(n) − X(1) n, R, λ=, =, ,, 2Z, 2Z, where R is the sample range and Z = max[−X(1) , X(n) ]. Then the asymptotic, distribution of 2 loge λ is χ22 ., Example, An electronic component test profile follows a rectangular distribution at stepped input, levels. An electronic engineer wishes to test a particular component type and collects, his data. He uses a likelihood ratio test. He obtains a value of his test statistic of −4.2809, and compares this with his tabulated value. He thus rejects the null hypothesis that one, parameter is zero., Numerical calculation, Consider (−0.2, −0.3, −0.4, 0.4, 0.3, 0.5) as a random sample from a rectangular, distribution. Here,, n=6, R = 0.5 − (−0.2) = 0.7, Z = max[0.4, 0.5] = 0.5, � �6, R, = (0.7)6 = 0.1176, 2 loge λ = −4.2809, λ=, 2Z, Critical value χ2;2 0.05 = 5.99 [Table 5]., Hence we reject the null hypothesis that α = 0.
Page 175 :
166, , 100 STATISTICAL TESTS, , Test 90 Sequential test for the parameter of, a Bernoulli population, Object, To test the parameter of the Bernoulli population by the sequential method., Limitations, This test is applicable if the observations are independent and identically follow the, Bernoulli distribution., Method, Let X1 , X2 , . . . , Xm be independent and identically distributed random variables having, the distribution with probability density function (PDF), �, θ x (1 − θ )1−x , X = 0, 1, (x), f0 =, 0,, otherwise., where 0 < θ < 1. We want to test H0 : θ = θ0 against H1 : θ = θ1 ., � rm . We continue sampling,, We fail to reject H0 if Sm � am , and we reject H0 if Sm�, i.e. taking observations, if am < Sm < rm , where Sm = m, i=1 Xi and, �, �, 1 − θ0, β, m log, log, 1 − θ1, α, �, �, � � 1 −�, � �, �+, am =, 1 − θ1, θ1, θ1, 1 − θ1, − log, log, log, − log, θ0, 1 − θ0, θ0, 1 − θ0, �, �, 1 − θ0, 1−β, m log, log, 1 − θ1, α�, � �, � �, �+, �, �., rm =, θ1, θ1, 1 − θ1, 1 − θ1, log, log, − log, − log, θ0, 1 − θ0, θ0, 1 − θ0, Example, Same as Numerical calculation., Numerical calculation, While dealing with the sampling of manufactured products, θ may be looked upon as, the true proportion of defectives under a new production process. A manufacturer may, be willing to adopt the new process if θ � θ0 and will reject it if θ � θ1 and he may, not be decisive if θ0 < θ < θ1 . To reach a decision, he may use a sequential sampling, plan, taking one item at each stage and at random. Here Sm will be the number of, defectives up to the mth stage, am the corresponding acceptance number and rm the
Page 176 :
THE TESTS, , 167, , rejection number. If θ0 = 0.04 and θ1 = 0.08, α = 0.15, β = 0.25, then the graphical, representation of the sequential plan is:, , As soon as (m, Sm ) lies on or below the line for am or on or above the line for rm ,, sampling is to be stopped; the new process is to be considered in the former case and, rejected in the latter.
Page 177 :
168, , Test 91, , 100 STATISTICAL TESTS, , Sequential probability ratio test, , Object, A sequential test for the ratio between the mean and the standard deviation of a normal, population where both are unknown., Limitations, This test is applicable if the observations are normally distributed with unknown mean, and variance., Method, Let X ∼ N(µ, σ 2 ), where both µ and σ 2 are unknown. We want to find a sequential, test for testing H0 : µ/σ = r0 against H1 : µ/σ = r1 . The sequential probability ratio, test procedure is as follows., 1. Continue sampling if bn < tn < an , where, n, �, , n, �, , Xi, , i=1, , yi, , i=1, , tn = ., =., /�, /�, / n 2, / n 2, 0, 0, X, y, i, , i=1, , i, , i=1, , where yi = Xi /|Xi |, i = 1, 2, . . . , n,, an = log, , 1−β, α, , and, , bn = log, , β, ., 1−α, , 2. Fail to reject H0 if tn � bn and reject H0 if tn � an ., Example, A useful measure is the ratio of mean divided by standard deviation since it is independent of measured units. Here we set up a sequential test for the ratio equal to 0.2, versus the alternative that it is equal to 0.4. The rule is that if the test statistic is less, than log(7/15) do not reject the null hypothesis and if the test statistic is greater than, log(13/5) then reject the null hypothesis; otherwise continue to sample., Numerical calculation, Consider a sample from N(µ, σ 2 ) where µ and σ are both unknown. Then we want a, sequential test for testing H0 : µ/σ = 0.2 against H1 : µ/σ = 0.4., Let α = 0.25, β = 0.35, an = log(0.65/0.25), bn = log(0.35/0.75)., If log 7/15 < tn < log 13/5 then continue sampling., If tn � log 7/15 do not reject H0 , and if tn � log 13/5 reject H0 .
Page 178 :
THE TESTS, , Test 92, , 169, , Durbin–Watson test, , Object, To test whether the error terms in a regression model are autocorrelated., Limitations, This test is applicable if the autocorrelation parameter and error terms are independently, normally distributed with mean zero and variance s2 ., Method, This test is based on the first-order autoregressive error model εt = ϕεt−1 + ut where, ϕ is the autocorrelation parameter and the ut , are independently normally distributed, with zero mean and variance σ 2 . When one is concerned with positive autocorrelation, the alternatives are given as follows:, H0 : ϕ � 0, , H1 : ϕ > 0., , Here H0 implies that error terms are uncorrelated or negatively correlated, while H1, implies that they are positively autocorrelated. This test is based on the difference, between adjacent residuals εt − εt−1 and is given by, n, �, (et − et−1 )2, , d=, , t=2, n, �, , e2t, , t=1, , where et is the regression residual for period t, and n is the number of time periods, used in fitting the regression model., When the error terms are positively autocorrelated the adjacent residuals will tend to, be of similar magnitude and the numerator of the test statistic d will be small. If the error, terms are either not correlated or negatively correlated et and et−1 will tend to differ, and the numerator of the test statistic will be larger. The exact action limit for this test, is difficult to calculate and the test is used with lower bound dL and the upper bound, dU . When the statistic d is less than the lower bound dL , we conclude that positive, autocorrelation is present. Similarly, when the test statistic exceeds the upper bound, dU , we conclude that positive autocorrelation is not present. When dL < d < dU , the, test is inconclusive., Example, Data on the sales (£m) of a large company (Y ) compared with its sector total (X) have, been collected over a five-year period. In order to test the significance of the regression, of Y on X, and to obtain confidence intervals on predictions, it is necessary to perform a, test of serial correlation on the error term or residuals. The Durbin–Watson test statistic
Page 179 :
170, , 100 STATISTICAL TESTS, , (d) is equal to 0.4765 and is less than the lower d value (dL ) of 1.20 [Table 33]. So the, residuals are positively autocorrelated. An appropriate adjustment to the error sum of, squares is necessary., Numerical calculation, n = 20, α = 0.05, Quarter-t, 1, 2, 3, 4, –, –, –, –, 20, , Company sale, Yi, , Industry sales, Xi, , 77.044, 78.613, 80.124, –, –, –, –, –, 102.481, , 746.512, 762.345, 778.179, –, –, –, –, –, 1006.882, , A computer run of a regression package provided us with the value of the test statistic, d = 0.4765: dL = 1.20 and dU = 1.41 from Table 33. Since d = 0.4765 < 1.20, the, error terms are positively autocorrelated.
Page 180 :
THE TESTS, , 171, , Test 93 Duckworth’s test for comparing the medians, of two populations, Object, A quick and easy test for comparing the medians of two populations which could be, used for a wide range of m and n observations., Limitations, This is not a powerful test but it is easy to use and the table values can be easily obtained., It works only on the largest and the smallest values of the observations from different, populations., Method, Consider the smallest observation from the X population and the largest from the Y, population. Then the test statistic, D, is the sum of the overlaps, the number of X, observations that are smaller than the smallest Y , plus the number of Y observations, that are larger than the largest X. If either 3 + 4n/3 � m � 2n or vice versa we subtract, 1 from D. Under these circumstances, the table of critical values consists of the three, numbers; 7, 10 and 13. If D � 7 we reject the hypothesis of equal medians at α = 0.05., Example, Two groups of workers are compared in terms of their daily rates of pay. Are they, significantly different? We use Duckworth’s test since the median is an appropriate, measure of central tendency for an income variable. The test statistic is 5 which is less, than 7 and so not significant. We have no reason to assume any difference in rates of, pay between the two groups., Numerical calculation, m = n = 12, 1, 66.3, X, , 2, 68.3, X, , 3, 68.5, X, , 4, 69.2, Y, , 5, 70.0, Y, , 6, 70.1, X, , 7, 70.4, X, , 8, 70.9, Y, , 9, 71.1, X, , 10, 71.2, X, , 11, 72.1, Y, , 12, 72.1, Y, , 13, 72.1, X, , 14, 72.7, X, , 15, 72.8, Y, , 16, 73.3, Y, , 17, 73.6, X, , 18, 74.1, X, , 19, 74.2, Y, , 20, 74.6, Y, , 21, 74.7, Y, , 22, 74.8, X, , 23, 75.5, Y, , 24, 75.8, Y, , We note that there are three X observations below all the Y observations and two Y s, above all the Xs. The total is D = 5, which is less than 7 and so not significant.
Page 181 :
172, , 100 STATISTICAL TESTS, , Test 94 χ 2 -test for a suitable probabilistic model, Object, Many experiments yield a set of data, say X1 , X2 , . . . , Xn , and the experimenter is often, interested in determining whether the data can be treated as the observed values of the, random sample X1 , X2 , . . . , Xn from a given distribution. That is, would this proposed, distribution be a reasonable probabilistic model for these sample items?, Limitations, This test is applicable if both distributions have the same interval classification and the, same number of elements. The observed data are observed by random sampling., Method, Let X1 denote the number of heads that occur when coins are tossed at random, under, the assumptions that the coins are independent and the probability of heads for each, coin has a binomial distribution. An experiment resulted in certain observed values at, Yi corresponding to 0, 1, 2, 3 and 4 heads., Let A1 = {0}, A2 = {1}, A3 = {2}, A4 = {3}, A5 = {4} be the corresponding heads, and if πi = P(X ∈ Ai ) when X is B(4, 21 ), then we have, � � � �4, 1, 4, = 0.0625, 0, 2, � � � �4, 1, 4, π2 = π4 =, = 0.25, 1, 2, � � � �4, 1, 4, π3 =, = 0.375., 2, 2, π1 = π5 =, , If α = 0.05, then the null hypothesis, H0 : p1 = π1 , p2 = π2 , p3 = π3 , p4 = π4 , p5 = π5, is rejected if the calculated value is greater than the tabulated value using, �, �, k, �, (yi − nπi )2, 2, qk−1 =, ., ∼ χk−1, nπi, i=1, , Example, We wish to test whether a binomial distribution is a good model for an application area., A full group of prisoner trainees consists of up to five members. Each full group must, have two escorts if five members turn up for training. If up to three turn up for training, then only one escort is needed. Data is collected over 100 group turnouts. Is a binomial
Page 182 :
THE TESTS, , 173, , model a good fit? The calculated chi-squared statistic of 4.47 is less than the critical, value of 9.49 [Table 5] so a binomial model is an acceptable model for this data., Numerical calculation, In this case y1 = 7, y2 = 18, y3 = 40, y4 = 31 and y5 = 4. The computed value is, q4 =, , (18 − 25)2, (40 − 37.5)2, (31 − 25)2, (7 − 6.25)2, +, +, +, 6.25, 25, 37.5, 25, 2, (4 − 6.25), = 4.47., +, 6.25, , Critical value χ42 (0.05) = 9.49 [Table 5]., Hence the hypothesis is not rejected. Thus the data support the hypothesis that B(4, 21 ), is a reasonable probabilistic model for X.
Page 183 :
174, , 100 STATISTICAL TESTS, , Test 95 V -test (modified Rayleigh), Object, To test whether the observed angles have a tendency to cluster around a given angle, indicating a lack of randomness in the distribution., Limitations, For grouped data the length of the mean vector must be adjusted, and for axial data all, angles must be doubled., Method, Given a random sample of n angular values 1 , 2 , . . . , n and a given theoretical, direction determined by an angle θ0 , then the test statistic for the test of randomness is:, 1, , V = (2n) 2 ϑ, where ϑ = r cos( ¯ − θ0 ) and r is the length of the mean vector, ���, �2 ��, �2 �, 1, 1, sin i, cos i +, = (x̄ 2 + ȳ2 ) 2, r= +, n, ⎧, � �, ȳ, ⎪, ⎪, if x̄ > 0, ⎨arctan, x̄, � �, ¯ =, ȳ, ⎪, ⎪, if x̄ < 0., ⎩180◦ + arctan, x̄, If V is greater than or equal to the critical V (α), the null hypothesis, that the parent, population is uniformly distributed (randomness), is rejected., Example, A radar screen produces a series of traces; angles from a centre are measured. Do these, cluster around a value of 265 degrees? The calculated V statistic is 3.884, which is, greater than the critical value of 2.302 [Table 34]. So the angles are not random and do, cluster., Numerical calculation, n = 15, ◦, 1 = 250 ,, ◦, 7 = 295 ,, ◦, 13 = 330 ,, x̄ =, , 1, (cos, n, , = 275◦ , 3 = 285◦ , 4 = 285◦ ,, ◦, ◦, ◦, 8 = 300 , 9 = 305 , 10 = 310 ,, ◦, ◦, ◦, 14 = 330 , 15 = 5 , θ0 = 265, 2, , 1, , + · · · + cos, , 15 ), , =, , 7.287, = 0.4858, 15, , 5, , = 290◦ , 6 = 290◦ ,, ◦, ◦, 11 = 315 , 12 = 320 ,
Page 184 :
THE TESTS, , ȳ =, , 1, (sin, n, , 1, , + · · · + sin, 1, , 15 ), , =, , −11.367, = −0.7578, 15, 1, , r = (x̄ 2 + ȳ2 ) 2 = (0.48582 + 0.75782 ) 2 = 0.9001, �, �, −0.7578, ¯ = arctan, = −57.3◦ , which is equivalent to 303◦ ., 0.4858, ϑ = r cos( ¯ − θ0 ) = 0.9001 × cos(303◦ − 265◦ ) = 0.9001 × 0.7880 = 0.7093, 1, , V = (2 × 15) 2 × 0.7093 = 5.4772 × 0.7092 = 3.885, Critical value V15; 0.01 = 2.302 [Table 34]., Hence reject the null hypothesis of randomness., , 175
Page 185 :
176, , 100 STATISTICAL TESTS, , Test 96 Watson’s Un2 -test, Object, To test whether the given distribution fits a random sample of angular values., Limitations, This test is suitable for both unimodal and the multimodal cases. The test is very, practical if a computer program is available. It can be used as a test for randomness., Method, Given a random sample of n angular values 1 , 2 , . . . , n rearranged in ascending, order: 1 � 2 � · · · � n . Suppose F( ) is the distribution function of the given, theoretical distribution and let, Vi = F(, 1�, V̄ =, Vi, n, , i ),, , and, , i = 1, 2, . . . , n, Ci = 2i − 1., , Then the test statistic is:, Un2 =, , n, �, i=1, , Vi2 −, , �, n �, �, C i Vi, i=1, , n, , �, +n, , 1, 3, , �, �2 �, − V̄ − 21, ., , If the sample value of Un2 exceeds the critical value the null hypothesis is rejected., Otherwise the fit is satisfactory., Example, A particle atomizer produces traces on a filter paper, which is calibrated on an angular, scale. Are the particles equally spaced on an angular scale? The distribution is one, of equal angles and the calculated U squared statistic is 0.1361. This is smaller than, the critical value of 0.184 [Table 35] so the null hypothesis of no difference from the, theoretical distribution is accepted., Numerical calculation, n = 13, F( ) = /360◦ , 1 = 20◦ , 2 = 135◦ , 3 = 145◦ , 4 = 165◦ ,, ◦, ◦, ◦, ◦, ◦, ◦, 5 = 170 , 6 = 200 , 7 = 300 , 8 = 325 , 9 = 335 , 10 = 350 ,, ◦, ◦, ◦, 11 = 350 , 12 = 350 , 13 = 355, Vi = i /13, i = 1, . . . , 13, �, �, �, Vi = 8.8889, Vi2 = 7.2310, Ci Vi /n = 10.9893, V̄ = 0.68376, �, �, Un2 = 7.2310 − 10.9893 + 13 13 − (0.18376)2 = 0.1361, 2, Critical value U13;, 0.05 = 0.184 [Table 35]., Do not reject the null hypothesis. The sample comes from the given theoretical, distribution.
Page 186 :
THE TESTS, , 177, , Test 97 Watson’s U 2 -test, Object, To test whether two samples from circular observations differ significantly from each, other with regard to mean direction or angular variance., Limitation, Both samples must come from a continuous distribution. In the case of grouping the, class interval should not exceed 5◦ ., Method, Given two random samples of n and m circular observations 1 , 2 , . . . , n and, �1 , �2 , . . . , �m , let n + m = N and d1 , d2 , . . . , dN (k = 1, 2, . . . , N) be the differences between the sample distribution function, and let d̄ denote the mean of the N, differences. Then the test statistic is given by:, ⎡, � N, �2 ⎤, N, �, �, nm, 1, dk2 −, dk ⎦ ., U2 = 2 ⎣, N, N, k=1, , k=1, , If U 2 > U 2 (α), reject the null hypothesis., Example, Two prototype machines produce two angular displacement scales. Are they essentially, the same with regard to mean direction and angular variance? The calculated U squared, statistic is 0.261. Since this is greater than the critical value of 0.185 [Table 36] the null, hypothesis of no difference is rejected. The two prototype machines differ., Numerical calculation, n = 8, m = 10,, , 16, �, k=1, , dk = 6.525,, , 16, �, k=1, , dk2 = 3.422, , �, �, 6.525 × 6.525, 80, 2, U = 2 3.422 −, = 0.261, 18, 18, 2, Critical value U8,10;, 0.05 = 0.185 [Table 36]., The calculated value is greater than the critical value., Reject the hypothesis. The two samples deviate significantly from each other.
Page 187 :
178, , 100 STATISTICAL TESTS, , Test 98 Watson–Williams test, Object, To test whether the mean angles of two independent circular observations differ, significantly from each other., Limitations, Samples are drawn from a von Mises distribution and the concentration parameter, k (>2) must have the same value in each population., Method, Given two independent random samples of n and m circular observations, 1 , 2 , . . . , n and �1 , �2 , . . . , �m , for each sample, calculate the components of, the resultant vectors, C1 =, C2 =, , n, �, i=1, m, �, , cos, , i, , cos �i, , S1 =, S2 =, , i=1, , n, �, i=1, m, �, , sin, , i, , sin �i, , i=1, , with the resultant lengths, 1, , 1, , R1 = (C12 + S12 ) 2, , R2 = (C22 + S22 ) 2 ., , ¯ For the combined sample,, The directions of the resultant vectors are given by ¯ and �., the components of the resultant vector are, C = C1 + C 2, , and, , S = S1 + S2 ., , Hence, the length of the resultant vector is, 1, , R = (C 2 + S 2 ) 2 ., To test the unknown mean angles of the population use the test statistic, F = g(N − 2), , R1 + R2 − R, N − (R1 + R2 ), , where N = n + m and g = 1 − 3/8k̂, with k determined from, R̄ =, , R1 + R2, N, , and Table 37. Reject the null hypothesis if the calculated value F is greater than the, critical value F1, N−2 .
Page 188 :
THE TESTS, , 179, , Example, A trainee-building surveyor has calibrated two angular measuring devices. Do they, produce similar results? She takes ten measurements from each device and then uses, the Watson–Williams test to compare them. Her F test statistic is 8.43, which is greater, than the critical value of 8.29 [Table 3]. So the null hypothesis of no difference between, the samples is rejected suggesting that the two devices have been calibrated differently., Numerical calculation, n = 10, m = 10, N = 20, ν1 = 1, ν2 = N − 2, C1 = 9.833, C2 = 9.849, C = 19.682, S1 = −1.558, S2 = 0.342, S = −1.216, R1 = 9.956, R2 = 9.854, R = 19.721, R̄ = 0.991 for k̂ greater than 10, g = 1, k̂ = 50.241 [Table 37], 18 × 0.089, = 8.432, F=, 0.190, Critical value F1,18; 0.01 = 8.29 [Table 3]., Reject the null hypothesis., Hence the mean directions differ significantly.
Page 189 :
180, , Test 99, , 100 STATISTICAL TESTS, , Mardia–Watson–Wheeler test, , Object, To test whether two independent random samples from circular observations differ, significantly from each other regarding mean angle, angular variance or both., Limitation, There are no ties between the samples and the populations have a continuous circular, distribution., Method, Consider two independent samples of n and m circular observations 1 , 2 , . . . , n and, �1 , �2 , . . . , �m . We observe the order in which the random samples are arranged and, then alter the space between successive sample points in such a way that all these spaces, become the same size. Having spaced the sample points equally, the sample points are, then ranked. Let r1 , r2 , . . . , rn be the ranks of the first sample and βi = ri δ (i = 1, . . . , n), be the angles, where δ and N = n + m are known as uniform scores. Then the resultant, vector of the first sample has components, �, �, cos βi, S1 =, sin βi, C1 =, and the length of the resultant vector is, 1, , R1 = (C 2 + S 2 ) 2 ., The test statistic is given by, B = R12 ., If B > Bα , reject the null hypothesis. When N > 17, the quantity χ 2 = 2(N −1)R12 /nm, has a χ 2 -distribution with 2 degrees of freedom if H0 is true., Example, A new improved boat navigation system is compared with the old one. Is the way they, work similar in terms of the observations taken? A sailor uses the Mardia–Watson–, Wheeler test and computes a B statistic of 3.618. This is smaller than the tabulated, value of 9.47 [Table 37] so he concludes that there is no difference between the two, systems., Numerical calculation, n = 6, m = 4, N = 10, δ = 360◦ /10 = 36◦ , α = 0.05, Here m is the smaller sample size., For the first sample:, r1 = 1, r2 = 2, r3 = 3, r4 = 4, r5 = 8, r6 = 9
Page 190 :
THE TESTS, , 181, , β1 = 36◦ , β2 = 72◦ , β3 = 108◦ , β4 = 144◦ , β5 = 288◦ , β6 = 324◦, C1 = 1.118, S1 = 1.539, R1 = 1.902, B = 3.618, Critical value BN, m; α = B10, 4; 0.05 = 9.47 [Table 38]., The calculated value B is less than the critical value Bα ., Hence there are no significant differences between the samples. (The second sample, would lead to the same result.)
Page 191 :
182, , 100 STATISTICAL TESTS, , Test 100 Harrison–Kanji–Gadsden test (analysis of, variance for angular data), Object, To test whether the treatment effects of the q independent random samples from von, Mises populations differ significantly from each other., Limitations, 1. Samples are drawn from a von Mises population., 2. The concentration parameter k has the same value for each sample., 3. k must be at least 2., Method, Given a one-way classification situation with µ0 , βj and eij denoting the overall mean, direction, treatment effect and random error variation respectively, then, ij, , = µ0 + βj + eij ,, , i = 1, . . . , p;, , j = 1, 2, . . . , q, , where each observation ij is an independent observation from a von Mises distribution, with mean µ0 + βj and concentration parameter k., For the one-way situation, the components of variation are similarly, ⎡, ⎡, ⎤, �⎤, �, �, q � 2, q � 2�, 2, 2, �, �, R, R, R, R ⎦, ·j, ·j ⎦, k N−, −, =k⎣, + k ⎣N −, N·j, N·j, N, N, j=1, , j=1, , (Total variation) = (Between variation) + (Residual variation), and the test statistic for a large value of k is given by, ⎛, ⎞⎤, ⎡, q � 2�, 2, �, R·j, R, ⎠⎥, ⎢ (N − q) ⎝, −, ⎢, N·j, N ⎥, ⎥, ⎢, j=1, �, ⎧, ⎫ ⎥, Fq−1,N−q, =β⎢, �, �, ⎥, ⎢, q, ⎨, ⎢, �, R·j2 ⎬ ⎥, ⎦, ⎣ (q − 1) N −, ⎩, N·j ⎭, j=1, , �p, , �q, , ¯ ·j are the jth mean angles with, where, i=1, j=1 cos( ij − µ̂0 ) = R, and, corresponding resultant length r·j ., Let x·i and y·j be the rectangular components of r·j . Then:, ⎡⎛, ⎢ 1, r· · = ⎣⎝, q, , q, �, j=1, , ⎞2, , ⎛, , r·j cos ¯ ·j ⎠ + ⎝, , 1, q, , q, �, j=1, , ⎞2 ⎤ 21, ⎥, r·j sin ¯ ·j ⎠ ⎦
Page 192 :
THE TESTS, , and R = Nr· · , R·j =, , �q, , j=1 cos(, , ij, , 183, , − ¯ ·j ),, , ¯ ·j = arctan, , � �, ȳ, ,, x̄, , 1, , r·j = [(x̄ 2 + ȳ2 )] 2, , where, 1, [cos, q, 1, ȳ = [sin, q, , x̄ =, , 1j, , + cos, , 1j, , + sin, , 2j, , 2j, , + · · · + cos, , + · · · + sin, , q j], q j], , k̂ is found by calculating the resultant R̄ and using Table 37. Here R̄ = R/N., Example, Five different magnification systems are compared for their effect on automatic angular, differentiation. A flight simulation researcher uses the Harrison–Kanji–Gadsden test, and computes the F statistic as 1.628. This is less than the tabulated value of 2.37, [Table 3]. So the researcher concludes that all five magnification systems are equally, effective., Numerical calculation, Magnification, 100, , 200, , 400, , 1200, , 400 × 1.3, , 82, 71, 85, 89, 78, 77, 74, 71, 68, 83, 72, 73, 81, 65, 62, 90, 92, 80, 77, 93, 75, 80, 69, 74,, 77, 75, 71, 82, 84, 79, 78, 81, 89, 79, 82, 81, 85, 76, 71, 80, 94, 68, 72, 70, 59, 80, 86, 98,, 82, 73, 75, 74, 71, 63, 83, 74, 82, 78, 87, 87, 82, 71, 60, 66, 63, 85, 81, 78, 80, 89, 82, 82, 92, 80,, 81, 74, 90, 78, 73, 72, 80, 59, 64, 78, 73, 70, 79, 79, 77, 81, 72, 76, 69, 73, 75, 84, 81, 51,, 76, 88, 70, 76, 79, 86, 77, 86, 77, 90, 88, 82, 84, 70, 87, 61, 71, 89,72, 90, 74, 88, 82, 68, 83, 75,, 90, 79, 89, 78, 74, 73, 71, 80, 83, 89, 68, 81, 47, 88, 69, 76, 71, 67, 76, 90, 84, 70, 80, 77,, 93, 89, 78, 90, 72, 91, 73, 79, 82, 87, 78, 83, 74, 82, 85, 75, 67, 72, 78, 88, 89, 71, 73, 77, 90, 82,, 80, 81, 89, 87, 78, 73, 78, 86, 73, 84, 68, 75, 70, 89, 54, 80, 90, 88, 81, 82, 88, 82, 75, 79,, 83, 82, 88, 69, 64, 78, 71, 68, 54, 80, 73, 72, 65, 73, 93, 84, 80, 49, 78, 82, 95, 69, 87, 83, 52, 79,, 85, 67, 82, 84, 87, 83, 88, 79, 83, 77, 78, 89, 75, 72, 88, 78, 62, 86, 89, 74, 71, 73, 84, 56,, 77, 71, , q = 5, N.1 = N.2 = · · · = N.q = 50, N = 250, ν1 = q − 1 = 4, ν2 = N − q = 245, q � 2�, �, R·j, R2, R = 238.550,, = 227.6244, = 228.1931,, N·j, N, j=1
Page 193 :
184, , 100 STATISTICAL TESTS, , Between variation = 0.5687, within variation = 21.8069, �, �, 0.142175, �, = β(1.597337), Fq−1, N−q = β, 0.089007, 1, 1, 1, k̂ = 11.02,, −, =1−, or β = 1.01959,, β, 5k̂, 10k̂ 2, R, = 0.954 [Table 37], N, �, = 1.628, Modified F � = β × F4,245 = 1.01959 × 1.597337 or F4,245, Critical value F4, 245; 0.05 = 2.37 [Table 3]., Hence there are no significant differences between the treatments., where R̄ =
Page 194 :
LIST OF TABLES, Table 1, Table 2, Table 3, Table 4, Table 5, Table 6, Table 7, Table 8, Table 9, Table 10, Table 11, Table 12, Table 13, Table 14, Table 15, Table 16, Table 17, Table 18, Table 19, Table 20, Table 21, Table 22, Table 23, Table 24, Table 25, Table 26, Table 27, Table 28, Table 29, Table 30, Table 31, Table 32, Table 33, Table 34, Table 35, Table 36, Table 37, Table 38, , The normal curve, Critical values of the t-distribution, Critical values of the F-distribution, Fisher z-transformation, Critical values for the χ 2 -distribution, Critical values of r for the correlation test with ρ = 0, Critical values of g1 and g2 for Fisher’s cumulant test, Critical values for the Dixon test of outliers, Critical values of the Studentized range for multiple, comparison, Critical values of K for the Link–Wallace test, Critical values for the Dunnett test, Critical values of M for the Bartlett test, Critical values for the Hartley test (right-sided), Critical values of w/s for the normality test, Critical values for the Cochran test for variance outliers, Critical values of D for the Kolmogorov–Smirnov, one-sample test, Critical values of T for the sign test, Critical values of r for the sign test for paired observations, Critical values of T for the signed rank test for paired, differences, Critical values of U for the Wilcoxon inversion test, Critical values of the smallest rank sum for the, Wilcoxon–Mann–Whitney test, The Kruskal–Wallis test, Critical values for the rank sum difference test (two-sided), Critical values for the rank sum maximum test, Critical values for the Steel test, Critical values of rs for the Spearman rank correlation test, Critical values of S for the Kendall rank correlation test, Critical values of D for the adjacency test, Critical values of r for the serial correlation test, Critical values for the run test on successive differences, Critical values for the run test (equal sample sizes), Critical values for the Wilcoxon–Wilcox test (two-sided), Durbin–Watson test bounds, Modified Rayleigh test (V -test), Watson’s Un2 test, Watson’s two-sample U 2 -test, Maximum likelihood estimate k̂ for given R̄ in the von Mises, case, Mardia–Watson–Wheeler test, , 186, 189, 190, 194, 195, 196, 197, 198, 199, 203, 205, 206, 208, 210, 211, 213, 214, 215, 216, 217, 218, 220, 221, 223, 224, 226, 227, 228, 228, 229, 230, 231, 233, 235, 236, 237, 238, 239
Page 195 :
TABLES, , Area, , Table 1 The normal curve, (a) Area under the normal curve, z, , 0.00, , 0, , z, , 0.01, , 0.02, , 0.03, , 0.04, , 0.05, , 0.06, , 0.07, , 0.08, , 0.09, , −3.4, −3.3, −3.2, −3.1, −3.0, , 0.0003, 0.0005, 0.0007, 0.0010, 0.0013, , 0.0003, 0.0005, 0.0007, 0.0009, 0.0013, , 0.0003, 0.0005, 0.0006, 0.0009, 0.0013, , 0.0003, 0.0004, 0.0006, 0.0009, 0.0012, , 0.0003, 0.0004, 0.0006, 0.0008, 0.0012, , 0.0003, 0.0004, 0.0006, 0.0008, 0.0011, , 0.0003, 0.0004, 0.0006, 0.0008, 0.0011, , 0.0003, 0.0004, 0.0005, 0.0008, 0.0011, , 0.0003, 0.0004, 0.0005, 0.0007, 0.0010, , 0.0002, 0.0003, 0.0005, 0.0007, 0.0010, , −2.9, −2.8, −2.7, −2.6, −2.5, , 0.0019, 0.0026, 0.0035, 0.0047, 0.0062, , 0.0018, 0.0025, 0.0034, 0.0045, 0.0060, , 0.0017, 0.0024, 0.0033, 0.0044, 0.0059, , 0.0017, 0.0023, 0.0032, 0.0043, 0.0057, , 0.0016, 0.0023, 0.0031, 0.0041, 0.0055, , 0.0016, 0.0022, 0.0030, 0.0040, 0.0054, , 0.0015, 0.0021, 0.0029, 0.0039, 0.0052, , 0.0015, 0.0021, 0.0028, 0.0038, 0.0051, , 0.0014, 0.0020, 0.0027, 0.0037, 0.0049, , 0.0014, 0.0019, 0.0026, 0.0036, 0.0048, , −2.4, −2.3, −2.2, −2.1, −2.0, , 0.0082, 0.0107, 0.0139, 0.0179, 0.0228, , 0.0080, 0.0104, 0.0136, 0.0174, 0.0222, , 0.0078, 0.0102, 0.0132, 0.0170, 0.0217, , 0.0075, 0.0099, 0.0129, 0.0166, 0.0212, , 0.0073, 0.0096, 0.0124, 0.0162, 0.0207, , 0.0071, 0.0094, 0.0122, 0.0158, 0.0202, , 0.0069, 0.0091, 0.0119, 0.0154, 0.0197, , 0.0068, 0.0089, 0.0116, 0.0150, 0.0192, , 0.0066, 0.0087, 0.0113, 0.0146, 0.0188, , 0.0064, 0.0084, 0.0110, 0.0143, 0.0183, , −1.9, −1.8, −1.7, −1.6, −1.5, , 0.0287, 0.0359, 0.0446, 0.0548, 0.0668, , 0.0281, 0.0352, 0.0436, 0.0537, 0.0655, , 0.0274, 0.0344, 0.0427, 0.0526, 0.0643, , 0.0268, 0.0336, 0.0418, 0.0516, 0.0630, , 0.0262, 0.0329, 0.0409, 0.0505, 0.0618, , 0.0256, 0.0322, 0.0401, 0.0495, 0.0606, , 0.0250, 0.0314, 0.0392, 0.0485, 0.0594, , 0.0244, 0.0307, 0.0384, 0.0475, 0.0582, , 0.0239, 0.0301, 0.0375, 0.0465, 0.0571, , 0.0233, 0.0294, 0.0367, 0.0455, 0.0559, , −1.4, −1.3, −1.2, −1.1, −1.0, , 0.0808, 0.0968, 0.1151, 0.1357, 0.1587, , 0.0793, 0.0951, 0.1131, 0.1335, 0.1562, , 0.0778, 0.0934, 0.1112, 0.1314, 0.1539, , 0.0764, 0.0918, 0.1093, 0.1292, 0.1515, , 0.0749, 0.0901, 0.1075, 0.1271, 0.1492, , 0.0735, 0.0885, 0.1056, 0.1251, 0.1469, , 0.0722, 0.0869, 0.1038, 0.1230, 0.1446, , 0.0708, 0.0853, 0.1020, 0.1210, 0.1423, , 0.0694, 0.0838, 0.1003, 0.1190, 0.1401, , 0.0681, 0.0823, 0.0985, 0.1170, 0.1379, , −0.9, −0.8, −0.7, −0.6, −0.5, , 0.1841, 0.2119, 0.2420, 0.2743, 0.3085, , 0.1814, 0.2090, 0.2389, 0.2709, 0.3050, , 0.1788, 0.2061, 0.2358, 0.2676, 0.3015, , 0.1762, 0.2033, 0.2327, 0.2643, 0.2981, , 0.1736, 0.2005, 0.2296, 0.2611, 0.2946, , 0.1711, 0.1977, 0.2266, 0.2578, 0.2912, , 0.1685, 0.1949, 0.2236, 0.2546, 0.2877, , 0.1660, 0.1922, 0.2206, 0.2514, 0.2843, , 0.1635, 0.1894, 0.2177, 0.2483, 0.2810, , 0.1611, 0.1867, 0.2148, 0.2451, 0.2776, , −0.4, −0.3, −0.2, −0.1, −0.0, , 0.3446, 0.3821, 0.4207, 0.4602, 0.5000, , 0.3409, 0.3783, 0.4168, 0.4562, 0.4960, , 0.3372, 0.3745, 0.4129, 0.4522, 0.4920, , 0.3336, 0.3707, 0.4090, 0.4483, 0.4880, , 0.3300, 0.3669, 0.4052, 0.4443, 0.4840, , 0.3264, 0.3632, 0.4013, 0.4404, 0.4801, , 0.3228, 0.3594, 0.3974, 0.4364, 0.4761, , 0.3192, 0.3557, 0.3936, 0.4325, 0.4721, , 0.3156, 0.3520, 0.3897, 0.4286, 0.4681, , 0.3121, 0.3483, 0.3859, 0.4247, 0.4641
Page 196 :
TABLES, Table 1(a), z, , 187, , continued, 0.00, , 0.01, , 0.02, , 0.03, , 0.04, , 0.05, , 0.06, , 0.07, , 0.08, , 0.09, , 0.0, 0.1, 0.2, 0.3, 0.4, , 0.5000, 0.5398, 0.5793, 0.6179, 0.6554, , 0.5040, 0.5438, 0.5832, 0.6217, 0.6591, , 0.5080, 0.5478, 0.5871, 0.6255, 0.6628, , 0.5120, 0.5517, 0.5910, 0.6293, 0.6664, , 0.5160, 0.5557, 0.5948, 0.6331, 0.6700, , 0.5199, 0.5596, 0.5987, 0.6368, 0.6736, , 0.5239, 0.5636, 0.6026, 0.6406, 0.6772, , 0.5279, 0.5675, 0.6064, 0.6443, 0.6808, , 0.5319, 0.5714, 0.6103, 0.6480, 0.6844, , 0.5359, 0.5753, 0.6141, 0.6517, 0.6879, , 0.5, 0.6, 0.7, 0.8, 0.9, , 0.6915, 0.7257, 0.7580, 0.7881, 0.8159, , 0.6950, 0.7291, 0.7611, 0.7910, 0.8186, , 0.6985, 0.7324, 0.7642, 0.7939, 0.8212, , 0.7019, 0.7357, 0.7673, 0.7967, 0.8238, , 0.7054, 0.7389, 0.7704, 0.7995, 0.8264, , 0.7088, 0.7422, 0.7734, 0.8023, 0.8289, , 0.7123, 0.7454, 0.7764, 0.8051, 0.8315, , 0.7157, 0.7486, 0.7794, 0.8078, 0.8340, , 0.7190, 0.7517, 0.7823, 0.8106, 0.8365, , 0.7224, 0.7549, 0.7852, 0.8133, 0.8389, , 1.0, 1.1, 1.2, 1.3, 1.4, , 0.8413, 0.8643, 0.8849, 0.9032, 0.9192, , 0.8438, 0.8665, 0.8869, 0.9049, 0.9207, , 0.8461, 0.8686, 0.8888, 0.9066, 0.9222, , 0.8485, 0.8708, 0.8907, 0.9082, 0.9236, , 0.8508, 0.8729, 0.8925, 0.9099, 0.9251, , 0.8531, 0.8749, 0.8944, 0.9115, 0.9265, , 0.8554, 0.8770, 0.8962, 0.9131, 0.9278, , 0.8577, 0.8790, 0.8980, 0.9147, 0.9292, , 0.8599, 0.8810, 0.8997, 0.9162, 0.9306, , 0.8621, 0.8830, 0.9015, 0.9177, 0.9319, , 1.5, 1.6, 1.7, 1.8, 1.9, , 0.9332, 0.9452, 0.9554, 0.9641, 0.9713, , 0.9345, 0.9463, 0.9564, 0.9649, 0.9719, , 0.9357, 0.9474, 0.9573, 0.9656, 0.9726, , 0.9370, 0.9484, 0.9582, 0.9664, 0.9732, , 0.9382, 0.9495, 0.9591, 0.9671, 0.9738, , 0.9394, 0.9505, 0.9599, 0.9678, 0.9744, , 0.9406, 0.9515, 0.9608, 0.9686, 0.9750, , 0.9418, 0.9525, 0.9616, 0.9693, 0.9756, , 0.9429, 0.9535, 0.9625, 0.9699, 0.9761, , 0.9441, 0.9545, 0.9633, 0.9706, 0.9767, , 2.0, 2.1, 2.2, 2.3, 2.4, , 0.9772, 0.9821, 0.9861, 0.9893, 0.9918, , 0.9778, 0.9826, 0.9864, 0.9896, 0.9920, , 0.9783, 0.9830, 0.9868, 0.9898, 0.9922, , 0.9788, 0.9834, 0.9871, 0.9901, 0.9925, , 0.9793, 0.9838, 0.9875, 0.9904, 0.9927, , 0.9798, 0.9842, 0.9878, 0.9906, 0.9929, , 0.9803, 0.9846, 0.9881, 0.9909, 0.9931, , 0.9808, 0.9850, 0.9884, 0.9911, 0.9932, , 0.9812, 0.9854, 0.9887, 0.9913, 0.9934, , 0.9817, 0.9857, 0.9890, 0.9916, 0.9936, , 2.5, 2.6, 2.7, 2.8, 2.9, , 0.9938, 0.9953, 0.9965, 0.9974, 0.9981, , 0.9940, 0.9955, 0.9966, 0.9975, 0.9982, , 0.9941, 0.9956, 0.9967, 0.9976, 0.9982, , 0.9943, 0.9957, 0.9968, 0.9977, 0.9983, , 0.9945, 0.9959, 0.9969, 0.9977, 0.9984, , 0.9946, 0.9960, 0.9970, 0.9978, 0.9984, , 0.9948, 0.9961, 0.9971, 0.9979, 0.9985, , 0.9949, 0.9962, 0.9972, 0.9979, 0.9985, , 0.9951, 0.9963, 0.9973, 0.9980, 0.9986, , 0.9952, 0.9964, 0.9974, 0.9981, 0.9986, , 3.0, 3.1, 3.2, 3.3, 3.4, , 0.9987, 0.9990, 0.9993, 0.9995, 0.9997, , 0.9987, 0.9991, 0.9993, 0.9995, 0.9997, , 0.9987, 0.9991, 0.9994, 0.9995, 0.9997, , 0.9988, 0.9991, 0.9994, 0.9996, 0.9997, , 0.9988, 0.9992, 0.9994, 0.9996, 0.9997, , 0.9989, 0.9992, 0.9994, 0.9996, 0.9997, , 0.9989, 0.9992, 0.9994, 0.9996, 0.9997, , 0.9989, 0.9992, 0.9995, 0.9996, 0.9997, , 0.9990, 0.9993, 0.9995, 0.9996, 0.9997, , 0.9990, 0.9993, 0.9995, 0.9997, 0.9998, , Source: Walpole and Myers, 1989
Page 197 :
188, , 100 STATISTICAL TESTS, , (b) critical values for a standard normal distribution, The normal distribution is symmetrical with respect to µ = 0., Level of significance α, Two-sided, , One-sided, , z, , 0.001, 0.002, 0.0026, 0.01, 0.02, 0.0456, 0.05, 0.10, 0.20, 0.318, , 0.0005, 0.001, 0.0013, 0.05, 0.01, 0.0228, 0.025, 0.05, 0.10, 0.159, , 3.29, 3.09, 3.00, 2.58, 2.33, 2.00, 1.96, 1.64, 1.28, 1.00
Page 198 :
TABLES, , 189, , α, , 0, , Table 2, , tα, , Critical values of the t-distribution, Level of significance α, 0.10, , 0.05, , 0.025, , 0.01, , 0.005, , 1, 2, 3, 4, 5, , 3.078, 1.886, 1.638, 1.533, 1.476, , 6.314, 2.920, 2.353, 2.132, 2.015, , 12.706, 4.303, 3.182, 2.776, 2.571, , 31.821, 6.965, 4.541, 3.747, 3.365, , 63.657, 9.925, 5.841, 4.604, 4.032, , 6, 7, 8, 9, 10, , 1.440, 1.415, 1.397, 1.383, 1.372, , 1.943, 1.895, 1.860, 1.833, 1.812, , 2.447, 2.365, 2.306, 2.262, 2.228, , 3.143, 2.998, 2.896, 2.821, 2.764, , 3.707, 3.499, 3.355, 3.250, 3.169, , 11, 12, 13, 14, 15, , 1.363, 1.356, 1.350, 1.345, 1.341, , 1.796, 1.782, 1.771, 1.761, 1.753, , 2.201, 2.179, 2.160, 2.145, 2.131, , 2.718, 2.681, 2.650, 2.624, 2.602, , 3.106, 3.055, 3.012, 2.977, 2.947, , 16, 17, 18, 19, 20, , 1.337, 1.333, 1.330, 1.328, 1.325, , 1.746, 1.740, 1.734, 1.729, 1.725, , 2.120, 2.110, 2.101, 2.093, 2.086, , 2.583, 2.567, 2.552, 2.539, 2.528, , 2.921, 2.898, 2.878, 2.861, 2.845, , 21, 22, 23, 24, 25, , 1.323, 1.321, 1.319, 1.318, 1.316, , 1.721, 1.717, 1.714, 1.711, 1.708, , 2.080, 2.074, 2.069, 2.064, 2.060, , 2.518, 2.508, 2.500, 2.492, 2.485, , 2.831, 2.819, 2.807, 2.797, 2.787, , 26, 27, 28, 29, 30, ∞, , 1.315, 1.314, 1.313, 1.311, 1.310, 1.282, , 1.706, 1.703, 1.701, 1.699, 1.697, 1.645, , 2.056, 2.052, 2.048, 2.045, 2.042, 1.960, , 2.479, 2.473, 2.467, 2.462, 2.457, 2.326, , 2.779, 2.771, 2.763, 2.756, 2.750, 2.576, , ν, , Source: Fisher and Yates, 1974
Page 199 :
190, , 100 STATISTICAL TESTS, , α, , 0, , Table 3, , tα, , Critical values of the F -distribution, Level of significance α = 0.05, , ν1, , 1, , 2, , 3, , 4, , 5, , 6, , 7, , 8, , 9, , 1, 2, 3, 4, , 161.4, 18.51, 10.13, 7.71, , 199.5, 19.00, 9.55, 6.94, , 215.7, 19.16, 9.28, 6.59, , 224.6, 19.25, 9.12, 6.39, , 230.2, 19.30, 9.01, 6.26, , 234.0, 19.33, 8.94, 6.16, , 236.8, 19.35, 8.89, 6.09, , 238.9, 19.37, 8.85, 6.04, , 240.5, 19.38, 8.81, 6.00, , 5, 6, 7, 8, 9, , 6.61, 5.99, 5.59, 5.32, 5.12, , 5.79, 5.14, 4.74, 4.46, 4.26, , 5.41, 4.76, 4.35, 4.07, 3.86, , 5.19, 4.53, 4.12, 3.84, 3.63, , 5.05, 4.39, 3.97, 3.69, 3.48, , 4.95, 4.28, 3.87, 3.58, 3.37, , 4.88, 4.21, 3.79, 3.50, 3.29, , 4.82, 4.15, 3.73, 3.44, 3.23, , 4.77, 4.10, 3.68, 3.39, 3.18, , 10, 11, 12, 13, 14, , 4.96, 4.84, 4.75, 4.67, 4.60, , 4.10, 3.98, 3.89, 3.81, 3.74, , 3.71, 3.59, 3.49, 3.41, 3.34, , 3.48, 3.36, 3.26, 3.18, 3.11, , 3.33, 3.20, 3.11, 3.03, 2.96, , 3.22, 3.09, 3.00, 2.92, 2.85, , 3.14, 3.01, 2.91, 2.83, 2.76, , 3.07, 2.95, 2.85, 2.77, 2.70, , 3.02, 2.90, 2.80, 2.71, 2.65, , 15, 16, 17, 18, 19, , 4.54, 4.49, 4.45, 4.41, 4.38, , 3.68, 3.63, 3.59, 3.55, 3.52, , 3.29, 3.24, 3.20, 3.16, 3.13, , 3.06, 3.01, 2.96, 2.93, 2.90, , 2.90, 2.85, 2.81, 2.77, 2.74, , 2.79, 2.74, 2.70, 2.66, 2.63, , 2.71, 2.66, 2.61, 2.58, 2.54, , 2.64, 2.59, 2.55, 2.51, 2.48, , 2.59, 2.54, 2.49, 2.46, 2.42, , 20, 21, 22, 23, 24, , 4.35, 4.32, 4.30, 4.28, 4.26, , 3.49, 3.47, 3.44, 3.42, 3.40, , 3.10, 3.07, 3.05, 3.03, 3.01, , 2.87, 2.84, 2.82, 2.80, 2.78, , 2.71, 2.68, 2.66, 2.64, 2.62, , 2.60, 2.57, 2.55, 2.53, 2.51, , 2.51, 2.49, 2.46, 2.44, 2.42, , 2.45, 2.42, 2.40, 2.37, 2.36, , 2.39, 2.37, 2.34, 2.32, 2.30, , 25, 26, 27, 28, 29, , 4.24, 4.23, 4.21, 4.20, 4.18, , 3.39, 3.37, 3.35, 3.34, 3.33, , 2.99, 2.98, 2.96, 2.95, 2.93, , 2.76, 2.74, 2.73, 2.71, 2.70, , 2.60, 2.59, 2.57, 2.56, 2.55, , 2.49, 2.47, 2.46, 2.45, 2.43, , 2.40, 2.39, 2.37, 2.36, 2.35, , 2.34, 2.32, 2.31, 2.29, 2.28, , 2.28, 2.27, 2.25, 2.24, 2.22, , 30, 40, 60, 120, ∞, , 4.17, 4.08, 4.00, 3.92, 3.84, , 3.32, 3.23, 3.15, 3.07, 3.00, , 2.92, 2.84, 2.76, 2.68, 2.60, , 2.69, 2.61, 2.53, 2.45, 2.37, , 2.53, 2.45, 2.37, 2.29, 2.21, , 2.42, 2.34, 2.25, 2.17, 2.10, , 2.33, 2.25, 2.17, 2.09, 2.01, , 2.27, 2.18, 2.10, 2.02, 1.94, , 2.21, 2.12, 2.04, 1.96, 1.88, , ν2
Page 200 :
TABLES, Table 3, , 191, , continued, Level of significance α = 0.05, , ν1, , 24, , 30, , 12, , 15, , 20, , 1, 2, 3, 4, , 241.9, 19.40, 8.79, 5.96, , 243.9, 19.41, 8.74, 5.91, , 245.9, 19.43, 8.70, 5.86, , 248.0, 19.45, 8.66, 5.80, , 5, 6, 7, 8, 9, , 4.74, 4.06, 3.64, 3.35, 3.14, , 4.68, 4.00, 3.57, 3.28, 3.07, , 4.62, 3.94, 3.51, 3.22, 3.01, , 4.56, 3.87, 3.44, 3.15, 2.94, , 4.53, 3.84, 3.41, 3.12, 2.90, , 4.50, 3.81, 3.38, 3.08, 2.86, , 4.46, 3.77, 3.34, 3.04, 2.83, , 4.43, 3.74, 3.30, 3.01, 2.79, , 4.40, 3.70, 3.27, 2.97, 2.75, , 4.36, 3.67, 3.23, 2.93, 2.71, , 10, 11, 12, 13, 14, , 2.98, 2.85, 2.75, 2.67, 2.60, , 2.91, 2.79, 2.69, 2.60, 2.53, , 2.85, 2.72, 2.62, 2.53, 2.46, , 2.77, 2.65, 2.54, 2.46, 2.39, , 2.74, 2.61, 2.51, 2.42, 2.35, , 2.70, 2.57, 2.47, 2.38, 2.31, , 2.66, 2.53, 2.43, 2.34, 2.27, , 2.62, 2.49, 2.38, 2.30, 2.22, , 2.58, 2.45, 2.34, 2.25, 2.18, , 2.54, 2.40, 2.30, 2.21, 2.13, , 15, 16, 17, 18, 19, , 2.54, 2.49, 2.45, 2.41, 2.38, , 2.48, 2.42, 2.38, 2.34, 2.31, , 2.40, 2.35, 2.31, 2.27, 2.23, , 2.33, 2.28, 2.23, 2.19, 2.16, , 2.29, 2.24, 2.19, 2.15, 2.11, , 2.25, 2.19, 2.15, 2.11, 2.07, , 2.20, 2.15, 2.10, 2.06, 2.03, , 2.16, 2.11, 2.06, 2.02, 1.98, , 2.11, 2.06, 2.01, 1.97, 1.93, , 2.07, 2.01, 1.96, 1.92, 1.88, , 20, 21, 22, 23, 24, , 2.35, 2.32, 2.30, 2.27, 2.25, , 2.28, 2.25, 2.23, 2.20, 2.18, , 2.20, 2.18, 2.15, 2.13, 2.11, , 2.12, 2.10, 2.07, 2.05, 2.03, , 2.08, 2.05, 2.03, 2.01, 1.98, , 2.04, 2.01, 1.98, 1.96, 1.94, , 1.99, 1.96, 1.94, 1.91, 1.89, , 1.95, 1.92, 1.89, 1.86, 1.84, , 1.90, 1.87, 1.84, 1.81, 1.79, , 1.84, 1.81, 1.78, 1.76, 1.73, , 25, 26, 27, 28, 29, , 2.24, 2.22, 2.20, 2.19, 2.18, , 2.16, 2.15, 2.13, 2.12, 2.10, , 2.09, 2.07, 2.06, 2.04, 2.03, , 2.01, 1.99, 1.97, 1.96, 1.94, , 1.96, 1.95, 1.93, 1.91, 1.90, , 1.92, 1.90, 1.88, 1.87, 1.85, , 1.87, 1.85, 1.84, 1.82, 1.81, , 1.82, 1.80, 1.79, 1.77, 1.75, , 1.77, 1.75, 1.73, 1.71, 1.70, , 1.71, 1.69, 1.67, 1.65, 1.64, , 30, 40, 60, 120, ∞, , 2.16, 2.08, 1.99, 1.91, 1.83, , 2.09, 2.00, 1.92, 1.83, 1.75, , 2.01, 1.92, 1.84, 1.75, 1.67, , 1.93, 1.84, 1.75, 1.66, 1.57, , 1.89, 1.79, 1.70, 1.61, 1.52, , 1.84, 1.74, 1.65, 1.55, 1.46, , 1.79, 1.69, 1.59, 1.50, 1.39, , 1.74, 1.64, 1.53, 1.43, 1.32, , 1.68, 1.58, 1.47, 1.35, 1.22, , 1.62, 1.51, 1.39, 1.25, 1.00, , 249.1 250.1, 19.45 19.46, 8.64, 8.62, 5.77, 5.75, , 40, , 60, , 120, , ∞, , 10, , ν2, , 251.1 252.2, 253.3 254.3, 19.47 19.48 19.49 19.50, 8.59, 8.57, 8.55, 8.53, 5.72, 5.69, 5.66, 5.63
Page 201 :
192, , 100 STATISTICAL TESTS, , Table 3, , continued, Level of significance α = 0.01, , ν1, , ν2, 1, 2, 3, 4, , 1, , 2, , 3, , 4, , 5, , 6, , 7, , 8, , 9, , 4052, 4999, 5403, 5625, 5764, 5859, 5928, 5981, 6022, 98.50, 99.00, 99.17, 99.25, 99.30, 99.33, 99.36, 99.37, 99.39, 34.12, 30.82, 29.46, 28.71, 28.24, 27.91, 27.67, 27.49, 27.35, 21.20, 18.00, 16.69, 15.98, 15.52, 15.21, 14.98, 14.80, 14.66, , 5, 6, 7, 8, 9, , 16.26, 13.75, 12.25, 11.26, 10.56, , 13.27, 10.92, 9.55, 8.65, 8.02, , 12.06, 9.78, 8.45, 7.59, 6.99, , 11.39, 9.15, 7.85, 7.01, 6.42, , 10.97, 8.75, 7.46, 6.63, 6.06, , 10.67, 8.47, 7.19, 6.37, 5.80, , 10.46, 8.26, 6.99, 6.18, 5.61, , 10.29, 8.10, 6.84, 6.03, 5.47, , 10.16, 7.98, 6.72, 5.91, 5.35, , 10, 11, 12, 13, 14, , 10.04, 9.65, 9.33, 9.07, 8.86, , 7.56, 7.21, 6.93, 6.70, 6.51, , 6.55, 6.22, 5.95, 5.74, 5.56, , 5.99, 5.67, 5.41, 5.21, 5.04, , 5.64, 5.32, 5.06, 4.86, 4.69, , 5.39, 5.07, 4.82, 4.62, 4.46, , 5.20, 4.89, 4.64, 4.44, 4.28, , 5.06, 4.74, 4.50, 4.30, 4.14, , 4.94, 4.63, 4.39, 4.19, 4.03, , 15, 16, 17, 18, 19, , 8.68, 8.53, 8.40, 8.29, 8.18, , 6.36, 6.23, 6.11, 6.01, 5.93, , 5.42, 5.29, 5.18, 5.09, 5.01, , 4.89, 4.77, 4.67, 4.58, 4.50, , 4.56, 4.44, 4.34, 4.25, 4.17, , 4.32, 4.20, 4.10, 4.01, 3.94, , 4.14, 4.03, 3.93, 3.84, 3.77, , 4.00, 3.89, 3.79, 3.71, 3.63, , 3.89, 3.78, 3.68, 3.60, 3.52, , 20, 21, 22, 23, 24, , 8.10, 8.02, 7.95, 7.88, 7.82, , 5.85, 5.78, 5.72, 5.66, 5.61, , 4.94, 4.87, 4.82, 4.76, 4.72, , 4.43, 4.37, 4.31, 4.26, 4.22, , 4.10, 4.04, 3.99, 3.94, 3.90, , 3.87, 3.81, 3.76, 3.71, 3.67, , 3.70, 3.64, 3.59, 3.54, 3.50, , 3.56, 3.51, 3.45, 3.41, 3.36, , 3.46, 3.40, 3.35, 3.30, 3.26, , 25, 26, 27, 28, 29, , 7.77, 7.72, 7.68, 7.64, 7.60, , 5.57, 5.53, 5.49, 5.45, 5.42, , 4.68, 4.64, 4.60, 4.57, 4.54, , 4.18, 4.14, 4.11, 4.07, 4.04, , 3.85, 3.82, 3.78, 3.75, 3.73, , 3.63, 3.59, 3.56, 3.53, 3.50, , 3.46, 3.42, 3.39, 3.36, 3.33, , 3.32, 3.29, 3.26, 3.23, 3.20, , 3.22, 3.18, 3.15, 3.12, 3.09, , 30, 40, 60, 120, ∞, , 7.56, 7.31, 7.08, 6.85, 6.63, , 5.39, 5.18, 4.98, 4.79, 4.61, , 4.51, 4.31, 4.13, 3.95, 3.78, , 4.02, 3.83, 3.65, 3.48, 3.32, , 3.70, 3.51, 3.34, 3.17, 3.02, , 3.47, 3.29, 3.12, 2.96, 2.80, , 3.30, 3.12, 2.95, 2.79, 2.64, , 3.17, 2.99, 2.82, 2.66, 2.51, , 3.07, 2.89, 2.72, 2.56, 2.41
Page 202 :
TABLES, , Table 3, , 193, , continued, Level of significance α = 0.01, , ν1, ν2, , 10, , 12, , 15, , 20, , 24, , 30, , 40, , 60, , 120, , ∞, , 1 6056, 6106, 6157, 6209, 6235, 6261, 6287, 6313, 6339, 6366, 99.40, 99.42, 99.43, 99.45, 99.46, 99.47, 99.47, 99.48, 99.49, 99.50, 2, 3, 27.23, 27.05, 26.87, 26.69, 26.60, 26.50, 26.41, 26.32, 26.22, 26.13, 4, 14.55, 14.37, 14.20, 14.02, 13.39, 13.84, 13.75, 13.65, 13.56, 13.46, 5, 6, 7, 8, 9, , 10.05, 7.87, 6.62, 5.81, 5.26, , 9.89, 7.72, 6.47, 5.67, 5.11, , 9.72, 7.56, 6.31, 5.52, 4.96, , 9.55, 7.40, 6.16, 5.36, 4.81, , 9.47, 7.31, 6.07, 5.28, 4.73, , 9.38, 7.23, 5.99, 5.20, 4.65, , 9.29, 7.14, 5.91, 5.12, 4.57, , 9.20, 7.06, 5.82, 5.03, 4.48, , 9.11, 6.97, 5.74, 4.95, 4.40, , 9.02, 6.88, 5.65, 4.86, 4.31, , 10, 11, 12, 13, 14, , 4.85, 4.54, 4.30, 4.10, 3.94, , 4.71, 4.40, 4.16, 3.96, 3.80, , 4.56, 4.25, 4.01, 3.82, 3.66, , 4.41, 4.10, 3.86, 3.66, 3.51, , 4.33, 4.02, 3.78, 3.59, 3.43, , 4.25, 3.94, 3.70, 3.51, 3.35, , 4.17, 3.86, 3.62, 3.43, 3.27, , 4.08, 3.78, 3.54, 3.34, 3.18, , 4.00, 3.69, 3.45, 3.25, 3.09, , 3.91, 3.60, 3.36, 3.17, 3.00, , 15, 16, 17, 18, 19, , 3.80, 3.69, 3.59, 3.51, 3.43, , 3.67, 3.55, 3.46, 3.37, 3.30, , 3.52, 3.41, 3.31, 3.23, 3.15, , 3.37, 3.26, 3.16, 3.08, 3.00, , 3.29, 3.18, 3.08, 3.00, 2.92, , 3.21, 3.10, 3.00, 2.92, 2.84, , 3.13, 3.02, 2.92, 2.84, 2.76, , 3.05, 2.93, 2.83, 2.75, 2.67, , 2.96, 2.84, 2.75, 2.66, 2.58, , 2.87, 2.75, 2.65, 2.57, 2.49, , 20, 21, 22, 23, 24, , 3.37, 3.31, 3.26, 3.21, 3.17, , 3.23, 3.17, 3.12, 3.07, 3.03, , 3.09, 3.03, 2.98, 2.93, 2.89, , 2.94, 2.88, 2.83, 2.78, 2.74, , 2.86, 2.80, 2.75, 2.70, 2.66, , 2.78, 2.72, 2.67, 2.62, 2.58, , 2.69, 2.64, 2.58, 2.54, 2.49, , 2.61, 2.55, 2.50, 2.45, 2.40, , 2.52, 2.46, 2.40, 2.35, 2.31, , 2.42, 2.36, 2.31, 2.26, 2.21, , 25, 26, 27, 28, 29, , 3.13, 3.09, 3.06, 3.03, 3.00, , 2.99, 2.96, 2.93, 2.90, 2.87, , 2.85, 2.81, 2.78, 2.75, 2.73, , 2.70, 2.66, 2.63, 2.60, 2.57, , 2.62, 2.58, 2.55, 2.52, 2.49, , 2.54, 2.50, 2.47, 2.44, 2.41, , 2.45, 2.42, 2.38, 2.35, 2.33, , 2.36, 2.33, 2.29, 2.26, 2.23, , 2.27, 2.23, 2.20, 2.17, 2.14, , 2.17, 2.13, 2.10, 2.06, 2.03, , 30, 40, 60, 120, ∞, , 2.98, 2.80, 2.63, 2.47, 2.32, , 2.84, 2.66, 2.50, 2.34, 2.18, , 2.70, 2.52, 2.35, 2.19, 2.04, , 2.55, 2.37, 2.20, 2.03, 1.88, , 2.47, 2.29, 2.12, 1.95, 1.79, , 2.39, 2.20, 2.03, 1.86, 1.70, , 2.30, 2.11, 1.94, 1.76, 1.59, , 2.21, 2.02, 1.84, 1.66, 1.47, , 2.11, 1.92, 1.73, 1.53, 1.32, , 2.01, 1.80, 1.60, 1.38, 1.00, , Source: Pearson and Hartley, 1970
Page 203 :
194, , 100 STATISTICAL TESTS, , Table 4, , Fisher z-transformation, �, , z(r) =, , 1, 2, , loge, , 1+r, 1−r, , �, , = tanh−1 r = 1.1513 log10, , �, , 1+r, 1−r, , �, , z, , 0, , 1, , 2, , 3, , 4, , 5, , 6, , 7, , 8, , 9, , 0.0, 0.1, 0.2, 0.3, 0.4, 0.5, 0.6, 0.7, 0.8, , 0.0000, 0.1003, 0.2027, 0.3095, 0.4236, 0.5493, 0.6931, 0.8673, 1.0986, , 0.0100, 0.1104, 0.2132, 0.3205, 0.4356, 0.5627, 0.7089, 0.8872, 1.1270, , 0.0200, 0.1206, 0.2237, 0.3316, 0.4477, 0.5763, 0.7250, 0.9076, 1.1568, , 0.0300, 0.1307, 0.2341, 0.3428, 0.4599, 0.5901, 0.7414, 0.9287, 1.1881, , 0.0400, 0.1409, 0.2448, 0.3541, 0.4722, 0.6042, 0.7582, 0.9505, 1.2212, , 0.0500, 0.1511, 0.2554, 0.3654, 0.4847, 0.6184, 0.7753, 0.9730, 1.2562, , 0.0601, 0.1614, 0.2661, 0.3769, 0.4973, 0.6328, 0.7928, 0.9962, 1.2933, , 0.0701, 0.1717, 0.2769, 0.3884, 0.5101, 0.6475, 0.8107, 1.0203, 1.3331, , 0.0802, 0.1820, 0.2877, 0.4001, 0.5230, 0.6625, 0.8291, 1.0454, 1.3758, , 0.0902, 0.1923, 0.2986, 0.4118, 0.5361, 0.6777, 0.8480, 1.0714, 1.4219, , 0.90, 0.91, 0.92, 0.93, 0.94, 0.95, 0.96, 0.97, 0.98, 0.99, , 1.4722, 1.5275, 1.5890, 1.6584, 1.7380, 1.8318, 1.9459, 2.0923, 2.2976, 2.6467, , 1.4775, 1.5334, 1.5956, 1.6658, 1.7467, 1.8421, 1.9588, 2.1095, 2.3235, 2.6995, , 1.4828, 1.5393, 1.6022, 1.6734, 1.7555, 1.8527, 1.9721, 2.1273, 2.3507, 2.7587, , 1.4882, 1.5453, 1.6089, 1.6811, 1.7645, 1.8635, 1.9857, 2.1457, 2.3796, 2.8257, , 1.4937, 1.5513, 1.6157, 1.6888, 1.7736, 1.8745, 1.9996, 2.1649, 2.4101, 2.9031, , 1.4992, 1.5574, 1.6226, 1.6967, 1.7828, 1.8857, 2.0139, 2.1847, 2.4427, 2.9945, , 1.5047, 1.5636, 1.6296, 1.7047, 1.7923, 1.8972, 2.0287, 2.2054, 2.4774, 3.1063, , 1.5103, 1.5698, 1.6366, 1.7129, 1.8019, 1.9090, 2.0439, 2.2269, 2.5147, 3.2504, , 1.5160, 1.5762, 1.6438, 1.7211, 1.8117, 1.9210, 2.0595, 2.2494, 2.5550, 3.4534, , 1.5217, 1.5826, 1.6510, 1.7295, 1.8216, 1.9333, 2.0756, 2.2729, 2.5987, 3.8002, , Source: Neave, 1978
Page 204 :
TABLES, Table 5, , 195, , Critical values for the χ 2 -distribution, , Columns a denote the lower boundaries or the left-sided critical values., Columns b denote the upper boundaries or the right-sided critical values., Level of significance α, Two-sided, One-sided, , 0.20, 0.10, , 0.10, 0.05, , 0.05, 0.025, , 0.01, 0.005, , ν, , a, , b, , a, , b, , a, , b, , a, , b, , 1, 2, 3, 4, 5, , 0.016, 0.21, 0.58, 1.06, 1.61, , 2.71, 4.61, 6.25, 7.78, 9.24, , 39.10−4, 0.10, 0.35, 0.71, 1.15, , 3.84, 5.99, 7.81, 9.49, 11.07, , 98.10−5, 0.05, 0.22, 0.48, 0.83, , 5.02, 7.38, 9.35, 11.14, 12.83, , 16.10−5, 0.02, 0.11, 0.30, 0.55, , 6.63, 9.21, 11.34, 13.28, 15.09, , 6, 7, 8, 9, 10, , 2.20, 2.83, 3.49, 4.17, 4.87, , 10.64, 12.02, 13.36, 14.68, 15.99, , 1.64, 2.17, 2.73, 3.33, 3.94, , 12.59, 14.07, 15.51, 16.92, 18.31, , 1.24, 1.69, 2.18, 2.70, 3.25, , 14.45, 16.01, 17.53, 19.02, 20.48, , 0.87, 1.24, 1.65, 2.09, 2.56, , 16.81, 18.48, 20.09, 21.67, 23.21, , 11, 12, 13, 14, 15, , 5.58, 6.30, 7.04, 7.79, 8.55, , 17.28, 18.55, 19.81, 21.06, 22.31, , 4.57, 5.23, 5.89, 6.57, 7.26, , 19.68, 21.03, 22.36, 23.68, 25.00, , 3.82, 4.40, 5.01, 5.63, 6.26, , 21.92, 23.34, 24.74, 26.12, 27.49, , 3.05, 3.57, 4.11, 4.66, 5.23, , 24.73, 26.22, 27.69, 29.14, 30.58, , 16, 17, 18, 19, 20, , 9.31, 10.09, 10.86, 11.65, 12.44, , 23.54, 24.77, 25.99, 27.20, 28.41, , 7.96, 8.67, 9.39, 10.12, 10.85, , 26.30, 27.59, 28.87, 30.14, 31.41, , 6.91, 7.56, 8.23, 8.91, 9.59, , 28.85, 30.19, 31.53, 32.85, 34.17, , 5.81, 6.41, 7.01, 7.63, 8.26, , 32.00, 33.41, 34.81, 36.19, 37.57, , 21, 22, 23, 24, 25, , 13.24, 14.04, 14.85, 15.66, 16.47, , 29.62, 30.81, 32.01, 33.20, 34.38, , 11.59, 12.34, 13.09, 13.85, 14.61, , 32.67, 33.92, 35.17, 36.42, 37.65, , 10.28, 10.98, 11.69, 12.40, 13.12, , 35.48, 36.78, 38.08, 39.36, 40.65, , 8.90, 9.54, 10.20, 10.86, 11.52, , 38.93, 40.29, 41.64, 42.98, 44.31, , 26, 27, 28, 29, 30, , 17.29, 18.11, 18.94, 19.77, 20.60, , 35.56, 36.74, 37.92, 39.09, 40.26, , 15.38, 16.15, 16.93, 17.71, 18.49, , 38.89, 40.11, 41.34, 42.56, 43.77, , 13.84, 14.57, 15.31, 16.05, 16.79, , 41.92, 43.19, 44.46, 45.72, 46.98, , 12.20, 12.88, 13.56, 14.26, 14.95, , 45.64, 46.96, 48.28, 49.59, 50.89, , 40, 50, 60, 70, 80, 90, 100, , 29.05, 37.69, 46.46, 55.33, 64.28, 73.29, 82.36, , 51.81, 63.17, 74.40, 85.53, 96.58, 107.57, 118.50, , 26.51, 34.76, 43.19, 51.74, 60.39, 69.13, 77.93, , 55.76, 67.50, 79.08, 90.53, 101.88, 113.15, 124.34, , 24.43, 32.36, 40.48, 48.76, 57.15, 65.65, 74.22, , 59.34, 71.42, 83.30, 95.02, 106.63, 118.14, 129.56, , 22.16, 29.71, 37.48, 45.44, 53.54, 61.75, 70.06, , 63.69, 76.15, 88.38, 100.43, 112.33, 124.12, 135.81
Page 205 :
196, , 100 STATISTICAL TESTS, Table 6, , Critical values of r for the correlation test with ρ = 0, , The distribution is symmetrical with respect to ρ = 0., 0.10, 0.05, , Level of significance α, 0.05, 0.02, 0.025, 0.01, , Two-sided, One-sided, ν =n−2, 1, 2, 3, 4, 5, , 0.01, 0.005, , 0.001, 0.0005, , 0.988, 0.900, 0.805, 0.729, 0.669, , 0.997, 0.950, 0.878, 0.811, 0.754, , 0.9995, 0.980, 0.934, 0.882, 0.833, , 0.9999, 0.990, 0.959, 0.917, 0.874, , 1.000, 0.999, 0.991, 0.974, 0.951, , 6, 7, 8, 9, 10, , 0.622, 0.582, 0.549, 0.521, 0.497, , 0.707, 0.666, 0.632, 0.602, 0.576, , 0.789, 0.750, 0.716, 0.685, 0.658, , 0.834, 0.798, 0.765, 0.735, 0.708, , 0.925, 0.898, 0.872, 0.847, 0.823, , 11, 12, 13, 14, 15, , 0.476, 0.458, 0.441, 0.426, 0.412, , 0.553, 0.532, 0.514, 0.497, 0.482, , 0.634, 0.612, 0.592, 0.574, 0.558, , 0.684, 0.661, 0.641, 0.623, 0.606, , 0.801, 0.780, 0.760, 0.742, 0.725, , 16, 17, 18, 19, 20, , 0.400, 0.389, 0.378, 0.369, 0.360, , 0.468, 0.456, 0.444, 0.433, 0.423, , 0.542, 0.528, 0.516, 0.503, 0.492, , 0.590, 0.575, 0.561, 0.549, 0.537, , 0.708, 0.693, 0.679, 0.665, 0.652, , 22, 24, 25, 30, 35, , 0.344, 0.330, 0.323, 0.296, 0.275, , 0.404, 0.388, 0.381, 0.349, 0.325, , 0.472, 0.453, 0.445, 0.409, 0.381, , 0.515, 0.496, 0.487, 0.449, 0.418, , 0.629, 0.607, 0.597, 0.554, 0.519, , 40, 45, 50, 55, 60, , 0.257, 0.243, 0.231, 0.220, 0.211, , 0.304, 0.288, 0.273, 0.261, 0.250, , 0.358, 0.338, 0.322, 0.307, 0.295, , 0.372, 0.372, 0.354, 0.338, 0.325, , 0.490, 0.415, 0.443, 0.424, 0.408, , 65, 70, 75, 80, 85, , 0.203, 0.195, 0.189, 0.183, 0.178, , 0.240, 0.232, 0.224, 0.217, 0.211, , 0.284, 0.274, 0.264, 0.256, 0.249, , 0.312, 0.302, 0.292, 0.283, 0.275, , 0.393, 0.380, 0.368, 0.357, 0.347, , 90, 95, 100, 125, 150, , 0.173, 0.168, 0.164, 0.147, 0.134, , 0.205, 0.200, 0.195, 0.174, 0.159, , 0.242, 0.236, 0.230, 0.206, 0.189, , 0.267, 0.260, 0.254, 0.228, 0.208, , 0.338, 0.329, 0.321, 0.288, 0.264, , 175, 200, 300, 500, 1000, 2000, , 0.124, 0.116, 0.095, 0.074, 0.052, 0.037, , 0.148, 0.138, 0.113, 0.088, 0.062, 0.044, , 0.174, 0.164, 0.134, 0.104, 0.073, 0.056, , 0.194, 0.181, 0.148, 0.115, 0.081, 0.058, , 0.248, 0.235, 0.188, 0.148, 0.104, 0.074, , Source: De Jonge, 1963–4
Page 206 :
TABLES, Table 7, , 197, , Critical values of g1 and g2 for Fisher’s cumulant test, , The g1 distribution may be considered as symmetrical with respect to 0;, the g2 distribution has to be considered as asymmetrical., The columns a denote the lower boundaries or left-sided critical values., The columns b denote the upper boundaries or right-sided critical values., g1, , g2, Level of significance α, , Two-sided, One-sided, , 0.10, 0.05, , 0.10, 0.05, , 0.02, 0.01, , n, , 0.02, 0.01, , a, , b, , a, , b, , 50, 75, 100, 125, 150, , 0.550, 0.454, 0.395, 0.354, 0.324, , 0.812, 0.664, 0.576, 0.514, 0.469, , –, –, −0.62, −0.57, −0.53, , –, –, 1.53, 1.34, 1.22, , –, –, −0.80, −0.74, −0.69, , –, –, 1.53, 1.34, 1.22, , 175, 200, 250, 300, 350, , 0.301, 0.282, 0.253, 0.231, 0.214, , 0.434, 0.406, 0.362, 0.331, 0.306, , −0.50, −0.47, −0.44, −0.40, −0.37, , 1.11, 1.04, 0.91, 0.82, 0.75, , −0.66, −0.62, −0.57, −0.53, −0.49, , 1.11, 1.04, 0.91, 0.82, 0.75, , 400, 450, 500, 550, 600, , 0.201, 0.189, 0.180, 0.171, 0.163, , 0.286, 0.270, 0.256, 0.244, 0.234, , −0.35, −0.33, −0.32, −0.30, −0.29, , 0.69, 0.65, 0.62, 0.59, 0.55, , −0.48, −0.44, −0.42, −0.41, −0.39, , 0.69, 0.65, 0.62, 0.59, 0.55, , 650, 700, 750, 800, 850, , 0.157, 0.151, 0.146, 0.142, 0.138, , 0.225, 0.215, 0.208, 0.202, 0.196, , −0.28, −0.27, −0.26, −0.25, −0.25, , 0.53, 0.51, 0.49, 0.47, 0.46, , −0.38, −0.37, −0.35, −0.34, −0.33, , 0.53, 0.51, 0.49, 0.47, 0.46, , 900, 950, 1000, , 0.134, 0.130, 0.127, , 0.190, 0.185, 0.180, , −0.24, −0.23, −0.23, , 0.44, 0.43, 0.42, , −0.33, −0.32, −0.31, , 0.44, 0.43, 0.42, , Source: Geary and Pearson, n.d.; Bennett and Franklin, 1961
Page 207 :
198, , 100 STATISTICAL TESTS, Table 8, , Critical values for the Dixon test of outliers, , Test, Statistic, , x − x1, r10 = 2, xn − x1, , Level of significance α, n, , 0.30, , 0.20, , 0.10, , 0.05, , 0.02, , 0.01, , 0.005, , 3, 4, 5, 6, 7, , 0.684, 0.471, 0.373, 0.318, 0.281, , 0.781, 0.560, 0.451, 0.386, 0.344, , 0.886, 0.679, 0.557, 0.482, 0.434, , 0.941, 0.765, 0.642, 0.560, 0.507, , 0.976, 0.846, 0.729, 0.644, 0.586, , 0.988, 0.889, 0.780, 0.698, 0.637, , 0.994, 0.926, 0.821, 0.740, 0.680, , r11 =, , x2 − x1, xn−1 − x1, , 8, 9, 10, , 0.318, 0.288, 0.265, , 0.385, 0.352, 0.325, , 0.479, 0.441, 0.409, , 0.554, 0.512, 0.477, , 0.631, 0.587, 0.551, , 0.683, 0.635, 0.597, , 0.725, 0.677, 0.639, , r21 =, , x3 − x1, xn−1 − x1, , 11, 12, 13, , 0.391, 0.370, 0.351, , 0.442, 0.419, 0.399, , 0.517, 0.490, 0.467, , 0.576, 0.546, 0.521, , 0.638, 0.605, 0.578, , 0.679, 0.642, 0.615, , 0.713, 0.675, 0.649, , 14, 15, 16, 17, 18, 19, 20, 21, 22, 23, 24, 25, , 0.370, 0.353, 0.338, 0.325, 0.314, 0.304, 0.295, 0.287, 0.280, 0.274, 0.268, 0.262, , 0.421, 0.402, 0.386, 0.373, 0.361, 0.350, 0.340, 0.331, 0.323, 0.316, 0.310, 0.304, , 0.492, 0.472, 0.454, 0.438, 0.424, 0.412, 0.401, 0.391, 0.382, 0.374, 0.367, 0.360, , 0.546, 0.525, 0.507, 0.490, 0.475, 0.462, 0.450, 0.440, 0.430, 0.421, 0.413, 0.406, , 0.602, 0.579, 0.559, 0.542, 0.527, 0.514, 0.502, 0.491, 0.481, 0.472, 0.464, 0.457, , 0.641, 0.616, 0.595, 0.577, 0.561, 0.547, 0.535, 0.524, 0.514, 0.505, 0.497, 0.489, , 0.674, 0.647, 0.624, 0.605, 0.589, 0.575, 0.562, 0.551, 0.541, 0.532, 0.524, 0.516, , r22 =, , x3 − x1, xn−2 − x1, , Source: Dixon and Massey, 1957
Page 208 :
Table 9 Critical values of the Studentized range for multiple comparison, Level of significance α = 0.05, K, , 4, , 5, , 6, , 7, , 8, , 9, , 10, , 11, , 12, , 13, , 14, , 15, , 16, , 17, , 18, , 19, , 20, , 1, 2, 3, 4, , 17.969, 6.085, 4.501, 3.926, , 26.98, 8.33, 5.91, 5.04, , 32.82, 9.80, 6.82, 5.76, , 37.08, 10.88, 7.50, 6.29, , 40.41, 11.74, 8.04, 6.71, , 43.12, 12.44, 8.48, 7.05, , 45.40, 13.03, 8.85, 7.35, , 47.36, 13.54, 9.18, 7.60, , 49.07, 13.99, 9.46, 7.83, , 50.59, 14.39, 9.72, 8.03, , 51.96, 14.75, 9.95, 8.21, , 53.20, 15.08, 10.15, 8.37, , 54.33, 15.38, 10.35, 8.52, , 55.36, 15.65, 10.52, 8.66, , 56.32, 15.91, 10.69, 8.79, , 57.22, 16.14, 10.84, 8.91, , 58.04, 16.37, 10.98, 9.03, , 58.83, 16.57, 11.11, 9.13, , 59.56, 16.77, 11.24, 9.23, , 5, 6, 7, 8, 9, , 3.635, 3.460, 3.344, 3.261, 3.199, , 4.60, 4.34, 4.16, 4.04, 3.95, , 5.22, 4.90, 4.68, 4.53, 4.41, , 5.67, 5.30, 5.06, 4.89, 4.76, , 6.03, 5.63, 5.36, 5.17, 5.02, , 6.33, 5.90, 5.61, 5.40, 5.24, , 6.58, 6.12, 5.82, 5.60, 5.43, , 6.80, 6.32, 6.00, 5.77, 5.59, , 6.99, 6.49, 6.16, 5.92, 5.74, , 7.17, 6.65, 6.30, 6.05, 5.87, , 7.32, 6.79, 6.43, 6.18, 5.98, , 7.47, 6.92, 6.55, 6.29, 6.09, , 7.60, 7.03, 6.66, 6.39, 6.19, , 7.72, 7.14, 6.76, 6.48, 6.28, , 7.83, 7.24, 6.85, 6.57, 6.36, , 7.93, 7.34, 6.94, 6.65, 6.44, , 8.03, 7.43, 7.02, 6.73, 6.51, , 8.12, 7.51, 7.10, 6.80, 6.58, , 8.21, 7.59, 7.17, 6.87, 6.64, , 10, 11, 12, 13, 14, , 3.151, 3.113, 3.081, 3.055, 3.033, , 3.88, 3.82, 3.77, 3.73, 3.70, , 4.33, 4.26, 4.20, 4.15, 4.11, , 4.65, 4.57, 4.51, 4.45, 4.41, , 4.91, 4.82, 4.75, 4.69, 4.64, , 5.12, 5.03, 4.95, 4.88, 4.83, , 5.30, 5.20, 5.12, 5.05, 4.99, , 5.46, 5.35, 5.27, 5.19, 5.13, , 5.60, 5.49, 5.39, 5.32, 5.25, , 5.72, 5.61, 5.51, 5.43, 5.36, , 5.83, 5.71, 5.61, 5.53, 5.46, , 5.93, 5.81, 5.71, 5.63, 5.55, , 6.03, 5.90, 5.80, 5.71, 5.64, , 6.11, 5.98, 5.88, 5.79, 5.71, , 6.19, 6.06, 5.95, 5.85, 5.79, , 6.27, 6.13, 6.02, 5.93, 5.85, , 6.34, 6.20, 6.09, 5.99, 5.91, , 6.40, 6.27, 6.15, 6.05, 5.97, , 6.47, 6.33, 6.21, 6.11, 6.03, , 15, 16, 17, 18, 19, , 3.014, 2.998, 2.984, 2.971, 2.960, , 3.67, 3.65, 3.63, 3.61, 3.59, , 4.08, 4.05, 4.02, 4.00, 3.98, , 4.37, 4.33, 4.30, 4.28, 4.25, , 4.59, 4.56, 4.52, 4.49, 4.47, , 4.78, 4.74, 4.70, 4.67, 4.65, , 4.94, 4.90, 4.86, 4.82, 4.79, , 5.08, 5.03, 4.99, 4.96, 4.92, , 5.20, 5.15, 5.11, 5.07, 5.04, , 5.31, 5.26, 5.21, 5.17, 5.14, , 5.40, 5.35, 5.31, 5.27, 5.23, , 5.49, 5.44, 5.39, 5.35, 5.31, , 5.57, 5.52, 5.47, 5.43, 5.39, , 5.65, 5.59, 5.54, 5.50, 5.46, , 5.72, 5.66, 5.61, 5.57, 5.53, , 5.78, 5.73, 5.67, 5.63, 5.59, , 5.85, 5.79, 5.73, 5.69, 5.65, , 5.90, 5.84, 5.79, 5.74, 5.70, , 5.96, 5.90, 5.84, 5.79, 5.75, , 20, 21, 22, 23, 24, , 2.950, 2.941, 2.933, 2.926, 2.919, , 3.58, 3.56, 3.55, 3.54, 3.53, , 3.96, 3.94, 3.93, 3.91, 3.90, , 4.23, 4.21, 4.20, 4.18, 4.17, , 4.45, 4.43, 4.41, 4.39, 4.37, , 4.62, 4.60, 4.58, 4.56, 4.54, , 4.77, 4.74, 4.72, 4.70, 4.68, , 4.90, 4.87, 4.85, 4.83, 4.81, , 5.01, 4.98, 4.96, 4.94, 4.92, , 5.11, 5.08, 5.05, 5.03, 5.01, , 5.20, 5.17, 5.15, 5.12, 5.10, , 5.28, 5.25, 5.23, 5.20, 5.18, , 5.36, 5.33, 5.30, 5.27, 5.25, , 5.43, 5.40, 5.37, 5.34, 5.32, , 5.49, 5.46, 5.43, 5.40, 5.38, , 5.55, 5.52, 5.49, 5.46, 5.44, , 5.61, 5.58, 5.55, 5.52, 5.49, , 5.66, 5.62, 5.59, 5.57, 5.55, , 5.71, 5.67, 5.64, 5.62, 5.59, , 199, , 3, , TABLES, , 2, , ν2
Page 209 :
200, , Table 9 continued, K, ν2, , 2, , 3, , 4, , 5, , 6, , 7, , 8, , 9, , 10, , 11, , 12, , 13, , 14, , 15, , 16, , 17, , 18, , 19, , 20, , 2.913, 2.907, 2.902, 2.897, 2.892, , 3.52, 3.51, 3.51, 3.50, 3.49, , 3.89, 3.88, 3.87, 3.86, 3.85, , 4.16, 4.14, 4.13, 4.12, 4.11, , 4.36, 4.34, 4.33, 4.32, 4.31, , 4.52, 4.51, 4.50, 4.48, 4.47, , 4.66, 4.65, 4.63, 4.62, 4.61, , 4.79, 4.78, 4.76, 4.75, 4.73, , 4.90, 4.89, 4.87, 4.86, 4.84, , 4.99, 4.97, 4.96, 4.94, 4.93, , 5.08, 5.06, 5.04, 5.03, 5.01, , 5.16, 5.14, 5.12, 5.11, 5.09, , 5.23, 5.21, 5.19, 5.18, 5.16, , 5.30, 5.28, 5.26, 5.24, 5.23, , 5.36, 5.34, 5.32, 5.30, 5.29, , 5.42, 5.40, 5.38, 5.36, 5.35, , 5.48, 5.46, 5.43, 5.42, 5.40, , 5.52, 5.50, 5.48, 5.46, 5.44, , 5.57, 5.55, 5.53, 5.51, 5.49, , 30, 31, 32, 33, 34, , 2.888, 2.884, 2.881, 2.877, 2.874, , 3.49, 3.48, 3.48, 3.47, 3.47, , 3.85, 3.83, 3.83, 3.82, 3.82, , 4.10, 4.09, 4.09, 4.08, 4.07, , 4.30, 4.29, 4.28, 4.27, 4.27, , 4.46, 4.45, 4.44, 4.44, 4.43, , 4.60, 4.59, 4.58, 4.57, 4.56, , 4.72, 4.71, 4.70, 4.69, 4.68, , 4.82, 4.82, 4.81, 4.80, 4.79, , 4.92, 4.91, 4.89, 4.88, 4.87, , 5.00, 4.99, 4.98, 4.97, 4.96, , 5.08, 5.07, 5.06, 5.04, 5.03, , 5.15, 5.14, 5.13, 5.11, 5.10, , 5.21, 5.20, 5.19, 5.17, 5.16, , 5.27, 5.26, 5.24, 5.23, 5.22, , 5.33, 5.32, 5.30, 5.29, 5.28, , 5.38, 5.37, 5.35, 5.34, 5.33, , 5.43, 5.41, 5.40, 5.39, 5.37, , 5.47, 5.46, 5.45, 5.44, 5.42, , 35, 36, 37, 38, 39, , 2.871, 2.868, 2.865, 2.863, 2.861, , 3.46, 3.46, 3.45, 3.45, 3.44, , 3.81, 3.81, 3.80, 3.80, 3.79, , 4.07, 4.06, 4.05, 4.05, 4.04, , 4.26, 4.25, 5.25, 4.24, 4.24, , 4.42, 4.41, 4.41, 4.40, 4.40, , 4.55, 4.55, 4.54, 4.53, 4.53, , 4.67, 4.66, 4.65, 4.64, 4.64, , 4.78, 4.77, 4.76, 4.75, 4.75, , 4.86, 4.85, 4.84, 4.84, 4.83, , 4.95, 4.94, 4.93, 4.92, 4.92, , 5.02, 5.01, 5.00, 5.00, 4.99, , 5.09, 5.08, 5.08, 5.07, 5.06, , 5.15, 5.14, 5.14, 5.13, 5.12, , 5.21, 5.20, 5.19, 5.18, 5.17, , 5.27, 5.26, 5.25, 5.24, 5.23, , 5.32, 5.31, 5.30, 5.29, 5.28, , 5.36, 5.35, 5.34, 5.33, 5.32, , 5.41, 5.40, 5.39, 5.38, 5.37, , 40, 50, 60, 120, ∞, , 2.858, 2.841, 2.829, 2.800, 2.772, , 3.44, 3.41, 3.40, 3.36, 3.31, , 3.79, 3.76, 3.74, 3.68, 3.63, , 4.04, 4.00, 3.98, 3.92, 3.86, , 4.23, 4.19, 4.16, 4.10, 4.03, , 4.39, 4.34, 4.31, 4.24, 4.17, , 4.52, 4.47, 4.44, 4.36, 4.29, , 4.63, 4.58, 4.55, 4.47, 4.39, , 4.73, 4.69, 4.65, 4.56, 4.47, , 4.82, 4.76, 4.73, 4.64, 4.55, , 4.90, 4.85, 4.81, 4.71, 4.62, , 4.98, 4.92, 4.88, 4.78, 4.68, , 5.04, 4.99, 4.94, 4.84, 4.74, , 5.11, 5.05, 5.00, 4.90, 4.80, , 5.16, 5.10, 5.06, 4.95, 4.85, , 5.22, 5.15, 5.11, 5.00, 4.89, , 5.27, 5.20, 5.15, 5.04, 4.93, , 5.22, 5.24, 5.20, 5.09, 4.97, , 5.36, 5.29, 5.24, 5.13, 5.01, , 100 STATISTICAL TESTS, , 25, 26, 27, 28, 29
Page 210 :
Table 9 continued, , Level of significance α = 0.01, , K, ν2, 1, 2, 3, 4, , 2, , 3, , 4, , 5, , 6, , 7, , 8, , 9, , 10, , 11, , 12, , 90.025 135.0 164.3, 185.6 202.2, 215.8, 227.2, 237.0, 245.6, 253.2 260.0, 14.036, 19.02 22.29 24.72, 26.63, 28.20, 29.53 30.68, 31.69 32.59, 33.40, 8.260 10.62 12.17, 13.33 14.24, 15.00, 15.64, 16.20, 16.69, 17.13, 17.53, 6.511, 8.12, 9.17, 9.96 10.58, 11.10, 11.55, 11.93 12.27 12.57 12.84, , 13, , 14, , 15, , 16, , 266.2, 34.13, 17.89, 13.09, , 271.8, 34.81, 18.22, 13.32, , 277.0, 35.43, 18.52, 13.53, , 281.8, 36.00, 18.81, 13.73, , 17, , 18, , 19, , 20, , 286.3 290.4 294.3, 298.0, 36.53, 37.03, 37.50, 37.95, 19.07, 19.32, 19.55, 19.77, 13.91 14.08 14.24 14.40, , 6.98, 6.33, 5.92, 5.64, 5.43, , 7.80, 7.08, 6.54, 6.20, 5.96, , 8.42, 7.56, 7.01, 6.62, 6.35, , 8.91, 7.97, 7.37, 6.96, 6.66, , 9.32, 8.32, 7.68, 7.24, 6.91, , 9.67, 8.61, 7.94, 7.47, 7.13, , 9.97, 8.87, 8.17, 7.68, 7.33, , 10.24, 9.10, 8.37, 7.86, 7.49, , 10.48, 9.30, 8.55, 8.03, 7.65, , 10.70, 9.48, 8.71, 8.18, 7.78, , 10.89, 9.65, 8.86, 8.31, 7.91, , 11.08, 9.81, 9.00, 8.44, 8.03, , 11.24, 9.95, 9.12, 8.55, 8.13, , 11.40, 10.08, 9.24, 8.66, 8.23, , 11.55, 10.21, 9.35, 8.76, 8.33, , 11.68, 10.32, 9.46, 8.85, 8.41, , 11.81, 10.43, 9.55, 8.94, 8.49, , 11.93, 10.54, 9.65, 9.03, 8.57, , 10, 11, 12, 13, 14, , 4.482, 4.392, 4.320, 4.260, 4.210, , 5.27, 5.15, 5.05, 4.96, 4.89, , 5.77, 5.62, 5.50, 5.40, 5.32, , 6.14, 5.97, 5.84, 5.73, 5.63, , 6.43, 6.25, 6.10, 5.98, 5.88, , 6.67, 6.48, 6.32, 6.19, 6.08, , 6.87, 6.67, 6.51, 6.37, 6.26, , 7.05, 6.84, 6.67, 6.53, 6.41, , 7.21, 6.99, 6.81, 6.67, 6.54, , 7.36, 7.13, 6.94, 6.79, 6.66, , 7.49, 7.25, 7.06, 6.90, 6.77, , 7.60, 7.36, 7.17, 7.01, 6.87, , 7.71, 7.46, 7.26, 7.10, 6.96, , 7.81, 7.56, 7.36, 7.19, 7.05, , 7.91, 7.65, 7.44, 7.27, 7.13, , 7.99, 7.73, 7.52, 7.35, 7.20, , 8.08, 7.81, 7.59, 7.42, 7.27, , 8.15, 7.88, 7.66, 7.48, 7.33, , 8.23, 7.95, 7.73, 7.55, 7.39, , 15, 16, 17, 18, 19, , 4.167, 4.131, 4.099, 4.071, 4.045, , 4.84, 4.79, 4.74, 4.70, 4.67, , 5.25, 5.19, 5.14, 5.09, 5.05, , 5.56, 5.49, 5.43, 5.38, 5.33, , 5.80, 5.72, 5.66, 5.60, 5.55, , 5.99, 5.92, 5.85, 5.79, 5.73, , 6.16, 6.08, 6.01, 5.94, 5.89, , 6.31, 6.22, 6.15, 6.08, 6.02, , 6.44, 6.35, 6.27, 6.20, 6.14, , 6.55, 6.46, 6.38, 6.31, 6.25, , 6.66, 6.56, 6.48, 6.41, 6.34, , 6.76, 6.66, 6.57, 6.50, 6.43, , 6.84, 6.74, 6.66, 6.58, 6.51, , 6.93, 6.82, 6.73, 6.65, 6.58, , 7.00, 6.90, 6.81, 6.73, 6.65, , 7.07, 6.97, 6.87, 6.79, 6.72, , 7.14, 7.03, 6.94, 6.85, 6.78, , 7.20, 7.09, 7.00, 6.91, 6.84, , 7.26, 7.15, 7.05, 6.97, 6.89, , 20, 21, 22, 23, 24, , 4.024, 4.004, 3.986, 3.970, 3.955, , 4.64, 4.61, 4.58, 4.56, 4.55, , 5.02, 4.99, 4.96, 4.93, 4.91, , 5.29, 5.26, 5.22, 5.20, 5.17, , 5.51, 5.47, 5.43, 5.40, 5.37, , 5.69, 5.65, 5.61, 5.57, 5.54, , 5.84, 5.80, 5.76, 5.72, 5.69, , 5.97, 5.92, 5.88, 5.84, 5.81, , 6.09, 6.04, 6.00, 5.96, 5.92, , 6.19, 6.14, 6.10, 6.06, 6.02, , 6.28, 6.24, 6.19, 6.15, 6.11, , 6.37, 6.32, 6.27, 6.23, 6.19, , 6.45, 6.39, 6.35, 6.30, 6.26, , 6.52, 6.47, 6.42, 6.37, 6.33, , 6.59, 6.53, 6.48, 6.43, 6.39, , 6.65, 6.59, 6.54, 6.49, 6.45, , 6.71, 6.65, 6.60, 6.55, 6.51, , 6.77, 6.70, 6.65, 6.60, 6.56, , 6.82, 6.76, 6.70, 6.65, 6.61, , 201, , 5.702, 5.243, 4.949, 4.745, 4.596, , TABLES, , 5, 6, 7, 8, 9
Page 211 :
202, , Table 9 continued, K, ν2, , 2, , 3, , 4, , 5, , 6, , 7, , 8, , 9, , 10, , 11, , 12, , 13, , 14, , 15, , 16, , 17, , 18, , 19, , 20, , 3.942, 3.930, 3.918, 3.908, 3.889, , 4.52, 4.50, 4.49, 4.47, 4.45, , 4.89, 4.87, 4.85, 4.83, 4.80, , 5.15, 5.12, 5.10, 5.08, 5.05, , 5.34, 5.32, 5.30, 5.28, 5.24, , 5.51, 5.49, 5.46, 5.44, 5.40, , 5.66, 5.63, 5.61, 5.58, 5.54, , 5.78, 5.75, 5.72, 5.70, 5.65, , 5.89, 5.86, 5.83, 5.80, 5.76, , 5.99, 5.95, 5.93, 5.90, 5.85, , 6.07, 6.04, 6.01, 5.98, 5.93, , 6.15, 6.12, 6.09, 6.06, 6.01, , 6.22, 6.19, 6.16, 6.13, 6.08, , 6.29, 6.26, 6.22, 6.19, 6.14, , 6.35, 6.32, 6.28, 6.25, 6.20, , 6.41, 6.38, 6.34, 6.31, 6.26, , 6.47, 6.43, 6.40, 6.37, 6.31, , 6.52, 6.48, 6.45, 6.42, 6.36, , 6.57, 6.53, 6.50, 6.47, 6.41, , 30, 31, 32, 33, 34, , 3.889, 3.881, 3.873, 3.865, 3.859, , 4.45, 4.44, 4.43, 4.42, 4.41, , 4.80, 4.79, 4.78, 4.76, 4.75, , 5.05, 5.03, 5.02, 5.01, 4.99, , 5.24, 5.22, 5.21, 5.19, 5.18, , 5.40, 5.38, 5.37, 5.35, 5.34, , 5.54, 5.52, 5.50, 5.48, 5.47, , 5.65, 5.63, 5.61, 5.59, 5.58, , 5.76, 5.74, 5.72, 5.70, 5.68, , 5.85, 5.83, 5.81, 5.79, 5.77, , 5.93, 5.91, 5.89, 5.87, 5.86, , 6.01, 5.99, 5.97, 5.95, 5.93, , 6.08, 6.06, 6.03, 6.01, 5.99, , 6.14, 6.12, 6.09, 6.07, 6.05, , 6.20, 6.18, 6.16, 6.13, 6.12, , 6.26, 6.23, 6.21, 6.19, 6.17, , 6.31, 6.29, 6.26, 6.24, 6.22, , 6.36, 6.34, 6.31, 6.29, 6.27, , 6.41, 6.38, 6.36, 6.34, 6.31, , 35, 36, 37, 38, 39, , 3.852, 3.846, 3.841, 3.835, 3.830, , 4.41, 4.40, 4.39, 4.38, 4.38, , 4.74, 4.73, 4.72, 4.72, 4.71, , 4.98, 4.97, 4.96, 4.95, 4.94, , 5.16, 5.15, 5.14, 5.13, 5.12, , 5.33, 5.31, 5.30, 5.29, 5.28, , 5.45, 5.44, 5.43, 5.41, 5.40, , 5.56, 5.55, 5.54, 5.52, 5.51, , 5.67, 5.65, 5.64, 5.62, 5.62, , 5.76, 5.74, 5.73, 5.72, 5.70, , 5.84, S.82, 5.81, 5.80, 5.78, , 5.91, 5.90, 5.88, 5.87, 5.85, , 5.98, 5.96, 5.94, 5.93, 5.91, , 6.04, 6.02, 6.00, 5.99, 5.97, , 6.10, 6.08, 6.06, 6.05, 6.03, , 6.15, 6.13, 6.12, 6.10, 6.08, , 6.20, 6.18, 6.17, 6.15, 6.13, , 6.25, 6.23, 6.22, 6.20, 6.18, , 6.29, 6.28, 6.26, 6.24, 6.23, , 40, 50, 60, 120, ∞, , 3.825, 3.787, 3.762, 3.702, 3.643, , 4.37, 4.32, 4.28, 4.20, 4.12, , 4.70, 4.64, 4.59, 4.50, 4.40, , 4.93, 4.86, 4.82, 4.71, 4.60, , 5.11, 5.04, 4.99, 4.87, 4.76, , 5.26, 5.19, 5.13, 5.01, 4.88, , 5.39, 5.30, 5.25, 5.12, 4.99, , 5.50, 5.41, 5.36, 5.21, 5.08, , 5.60, 5.51, 5.45, 5.30, 5.16, , 5.69, 5.59, 5.53, 5.37, 5.23, , 5.76, 5.67, 5.60, 5.44, 5.29, , 5.83, 5.74, 5.67, 5.50, 5.35, , 5.90, 5.80, 5.73, 5.56, 5.40, , 5.96, 5.86, 5.78, 5.61, 5.45, , 6.02, 5.91, 5.84, 5.66, 5.49, , 6.07, 5.96, 5.89, 5.71, 5.54, , 6.12, 6.01, 5.93, 5.75, 5.57, , 6.16, 6.06, 5.97, 5.79, 5.61, , 6.21, 6.09, 6.01, 5.83, 5.65, , Source: Sachs, 1972, , 100 STATISTICAL TESTS, , 25, 26, 27, 28, 29
Page 212 :
Table 10 Critical values of K for the Link–Wallace test, Level of significance α = 0.05, K, n, , 4, , 5, , 6, , 7, , 8, , 9, , 10, , 11, , 12, , 13, , 14, , 15, , 16, , 17, , 18, , 19, , 20, , 30, , 40, , 50, , 2, 3, 4, 5, , 3.43, 1.90, 1.62, 1.53, , 2.35, 1.44, 1.25, 1.19, , 1.74, 1.14, 1.01, 0.96, , 1.39, 0.94, 0.84, 0.81, , 1.15, 0.80, 0.72, 0.70, , 0.99, 0.70, 0.63, 0.61, , 0.87, 0.62, 0.57, 0.55, , 0.77, 0.56, 0.51, 0.50, , 0.70, 0.51, 0.47, 0.45, , 0.63, 0.47, 1.43, 0.42, , 0.58, 0.43, 0.40, 0.39, , 0.54, 0.40, 0.37, 0.36, , 0.50, 0.38, 0.35, 0.34, , 0.47, 0.35, 0.33, 0.32, , 0.443, 0.335, 0.310, 0.303, , 0.418, 0.317, 0.294, 0.287, , 0.396, 0.301, 0.279, 0.273, , 0.376, 0.287, 0.266, 0.260, , 0.158, 0.274, 0.254, 0.249, , 0.245, 0.189, 0.177, 0.173, , 0.187, 0.146, 0.136, 0.134, , 0.151, 0.119, 0.112, 0.110, , 6, 7, 8, 9, 10, , 1.50, 1.49, 1.49, 1.50, 1.52, , 1.17, 1.17, 1.18, 1.19, 1.20, , 0.95, 0.95, 0.96, 0.97, 0.98, , 0.80, 0.80, 0.81, 0.82, 0.83, , 0.69, 0.69, 0.70, 0.71, 0.72, , 0.61, 0.61, 0.62, 0.62, 0.63, , 0.55, 0.55, 0.55, 0.56, 0.57, , 0.49, 0.50, 0.50, 0.51, 0.52, , 0.45, 0.45, 0.46, 0.47, 0.47, , 0.42, 0.42, 0.42, 0.43, 0.44, , 0.39, 0.39, 0.39, 0.40, 0.41, , 0.36, 0.36, 0.37, 0.37, 0.38, , 0.34, 0.34, 0.35, 0.35, 0.36, , 0.32, 0.32, 0.33, 0.33, 0.34, , 0.302, 0.304, 0.308, 0.312, 0.317, , 0.287, 0.289, 0.292, 0.297, 0.301, , 0.273, 0.275, 0.278, 0.282, 0.287, , 0.260, 0.262, 0.265, 0.269, 0.274, , 0.249, 0.251, 0.254, 0.258, 0.262, , 0.174, 0.175, 0.178, 0.180, 0.183, , 0.135, 0.136, 0.138, 0.140, 0.142, , 0.110, 0.111, 0.113, 0.115, 0.117, , 11, 12, 13, 14, 15, , 1.54, 1.56, 1.58, 1.60, 1.62, , 1.22, 1.23, 1.25, 1.26, 1.28, , 0.99, 1.01, 1.02, 1.03, 1.05, , 0.84, 0.85, 0.86, 0.87, 0.89, , 0.73, 0.74, 0.75, 0.76, 0.77, , 0.64, 0.65, 0.66, 0.67, 0.68, , 0.58, 0.58, 0.59, 0.60, 0.61, , 0.52, 0.53, 0.54, 0.55, 0.55, , 0.48, 0.49, 0.49, 0.50, 0.51, , 0.44, 0.45, 0.46, 0.46, 0.47, , 0.41, 0.42, 0.42, 0.43, 0.44, , 0.38, 0.39, 0.40, 0.40, 0.41, , 0.36, 0.37, 0.37, 0.38, 0.38, , 0.34, 0.35, 0.35, 0.36, 0.36, , 0.322, 0.327, 0.332, 0.337, 0.342, , 0.306, 0.311, 0.316, 0.320, 0.325, , 0.291, 0.296, 0.300, 0.305, 0.310, , 0.278, 0.282, 0.287, 0.291, 0.295, , 0.266, 0.270, 0.274, 0.279, 0.283, , 0.186, 0.189, 0.192, 0.195, 0.198, , 0.145, 0.147, 0.149, 0.152, 0.154, , 0.119, 0.121, 0.122, 0.124, 0.126, , 16, 17, 18, 19, 20, , 1.64, 1.66, 1.68, 1.70, 1.72, , 1.30, 1.32, 1.33, 1.35, 1.36, , 1.06, 1.08, 1.09, 1.10, 1.12, , 0.90, 0.91, 0.92, 0.93, 0.95, , 0.78, 0.79, 0.80, 0.81, 0.82, , 0.69, 0.70, 0.71, 0.72, 0.73, , 0.62, 0.63, 0.64, 0.64, 0.65, , 0.56, 0.57, 0.58, 0.59, 0.59, , 0.52, 0.52, 0.53, 0.54, 0.54, , 0.48, 0.48, 0.49, 0.50, 0.50, , 0.44, 0.45, 0.46, 0.46, 0.47, , 0.41, 0.42, 0.43, 0.43, 0.44, , 0.39, 0.39, 0.40, 0.41, 0.41, , 0.37, 0.37, 0.38, 0.38, 0.39, , 0.348, 0.352, 0.357, 0.362, 0.367, , 0.330, 0.335, 0.339, 0.344, 0.348, , 0.314, 0.319, 0.323, 0.327, 0.3.32, , 0.300, 0.304, 0.308, 0.312, 0.317, , 0.287, 0.291, 0.295, 0.299, 0.303, , 0.201, 0.204, 0.207, 0.210, 0.212, , 0.156, 0.158, 0.161, 0.163, 0.165, , 0.128, 0.130, 0.132, 0.134, 0.135, , 30, 40, 50, 100, 200, 500, 1000, , 1.92, 2.08, 2.23, 2.81, 3.61, 5.15, 6.81, , 1.52, 1.66, 1.77, 2.23, 2.88, 4.10, 5.43, , 1.24, 1.35, 1.45, 1.83, 2.35, 3.35, 4.44, , 1.05, 1.14, 1.22, 1.55, 1.99, 2.84, 3.77, , 0.91, 0.99, 1.06, 1.34, 1.73, 2.47, 3.28, , 0.81, 0.88, 0.94, 1.19, 1.53, 2.19, 2.90, , 0.73, 0.79, 0.85, 1.07, 1.38, 1.97, 2.61, , 0.66, 0.72, 0.77, 0.97, 1.25, 1.79, 2.37, , 0.60, 0.66, 0.71, 0.89, 1.15, 1.64, 2.18, , 0.56, 0.61, 0.65, 0.83, 1.06, 1.52, 2.22, , 0.52, 0.57, 0.61, 0.77, 0.99, 1.42, 1.88, , 0.49, 0.53, 0.57, 0.72, 0.93, 1.32, 1.76, , 0.46, 0.50, 0.53, 0.67, 0.87, 1.24, 1.65, , 0.43, 0.47, 0.50, 0.64, 0.82, 1.17, 1.56, , 0.408, 0.444, 0.476, 0.60, 0.78, 1.11, 1.47, , 0.387, 0.422, 0.453, 0.573, 0.74, 1.06, 1.40, , 0.369, 0.402, 0.431, 0.546, 0.70, 1.01, 1.33, , 0.352, 0.384, 0.412, 0.521, 0.67, 0.96, 1.27, , 0.337, 0.367, 0.394, 0.499, 0.64, 0.92, 1.22, , 0.237, 0.258, 0.277, 0.351, 0.454, 0.65, 0.86, , 0.184, 0.201, 0.216, 0.273, 0.353, 0.504, 0.669, , 0.151, 0.165, 0.177, 0.224, 0.290, 0.414, 0.549, , 203, , 3, , TABLES, , 2
Page 213 :
204, , Table 10 continued, , Level of significance α = 0.01, , K, V2, , 3, , 4, , 5, , 6, , 7, , 8, , 9, , 10, , 11, , 12, , 13, , 14, , 15, , 16, , 17, , 18, , 19, , 20, , 30, , 40, , 50, , 7.92, 3.14, 2.48, 2.24, , 4.32, 2.12, 1.74, 1.60, , 2.84, 1.57, 1.33, 1.24, , 2.10, 1.25, 1.08, 1.02, , 1.66, 1.04, 0.91, 0.86, , 1.38, 0.89, 0.78, 0.75, , 1.17, 0.78, 0.69, 0.66, , 1.02, 0.69, 0.62, 0.59, , 0.91, 0.62, 0.56, 0.54, , 0.82, 1.57, 0.51, 0.49, , 0.74, 0.52, 0.47, 0.46, , 0.68, 0.48, 0.44, 0.42, , 0.63, 0.45, 0.41, 0.40, , 0.58, 0.42, 0.38, 0.37, , 0.54, 0.39, 0.36, 0.35, , 0.51, 0.37, 0.34, 0.33, , 0.480, 0.352, 0.323, 0.314, , 0.454, 0.334, 0.307, 0.299, , 0.430, 0.318, 0.293, 0.285, , 0.285, 0.217, 0.200, 0.196, , 0.214, 0.165, 0.153, 0.151, , 0.172, 0.134, 0.125, 0.123, , 6, 7, 8, 9, 10, , 2.14, 2.10, 2.09, 2.09, 2.10, , 1.55, 1.53, 1.53, 1.54, 1.55, , 1.21, 1.20, 1.20, 1.21, 1.22, , 0.99, 0.99, 0.99, 1.00, 1.01, , 0.85, 0.84, 0.85, 0.85, 0.86, , 0.74, 0.73, 0.74, 0.75, 0.76, , 0.65, 0.65, 0.66, 0.66, 0.67, , 0.59, 0.59, 0.59, 0.60, 0.61, , 0.53, 0.53, 0.54, 0.54, 0.55, , 0.49, 0.49, 0.49, 0.50, 0.51, , 0.45, 0.45, 0.46, 0.46, 0.47, , 0.42, 0.42, 0.43, 0.43, 0.44, , 0.39, 0.39, 0.40, 0.40, 0.41, , 0.37, 0.37, 0.37, 0.38, 0.38, , 0.35, 0.35, 0.35, 0.36, 0.36, , 0.33, 0.33, 0.33, 0.34, 0.34, , 0.313, 0.314, 0.318, 0.322, 0.327, , 0.298, 0.299, 0.303, 0.307, 0.311, , 0.284, 0.286, 0.289, 0.293, 0.297, , 0.196, 0.198, 0.200, 0.200, 0.206, , 0.151, 0.152, 0.154, 0.156, 0.159, , 0.123, 0.124, 0.126, 0.127, 0.129, , 11, 12, 13, 14, 15, , 2.11, 2.13, 2.15, 2.18, 2.20, , 1.56, 1.58, 1.60, 1.62, 1.63, , 1.23, 1.25, 1.26, 1.28, 1.30, , 1.02, 1.04, 1.05, 1.06, 1.08, , 0.87, 0.89, 0.90, 0.91, 0.92, , 0.76, 0.78, 0.79, 0.80, 0.81, , 0.68, 0.69, 0.70, 0.71, 0.72, , 0.61, 0.62, 0.63, 0.64, 0.65, , 0.56, 0.57, 0.58, 0.58, 0.59, , 0.51, 0.52, 0.53, 0.54, 0.54, , 0.48, 0.48, 0.49, 0.50, 0.50, , 0.44, 0.45, 0.46, 0.46, 0.47, , 0.42, 0.42, 0.43, 0.43, 0.44, , 0.39, 0.40, 0.40, 0.41, 0.41, , 0.37, 0.37, 0.38, 0.39, 0.39, , 0.35, 0.35, 0.36, 0.36, 0.37, , 0.332, 0.337, 0.342, 0.347, 0.352, , 0.316, 0.321, 0.326, 0.330, 0.335, , 0.302, 0.306, 0.311, 0.316, 0.320, , 0.209, 0.213, 0.216, 0.219, 0.222, , 0.161, 0.164, 0.166, 0.169, 0.171, , 0.132, 0.134, 0.136, 0.138, 0.140, , 16, 17, 18, 19, 20, , 2.22, 2.25, 2.27, 2.30, 2.32, , 1.65, 1.67, 1.69, 1.71, 1.73, , 1.31, 1.33, 1.34, 1.36, 1.38, , 1.09, 1.10, 1.12, 1.13, 1.14, , 0.93, 0.95, 0.96, 0.97, 0.98, , 0.82, 0.83, 0.84, 0.85, 0.86, , 0.73, 0.74, 0.75, 0.76, 0.77, , 0.66, 0.67, 0.68, 0.68, 0.69, , 0.60, 0.61, 0.62, 0.62, 0.63, , 0.55, 0.56, 0.57, 0.57, 0.58, , 0.51, 0.52, 0.53, 0.53, 0.54, , 0.48, 0.48, 0.49, 0.50, 0.50, , 0.45, 0.45, 0.46, 0.46, 0.47, , 0.42, 0.43, 0.43, 0.44, 0.44, , 0.40, 0.40, 0.41, 0.41, 0.42, , 0.38, 0.38, 0.39, 0.39, 0.40, , 0.357, 0.362, 0.367, 0.372, 0.376, , 0.340, 0.345, 0.350, 0.354, 0.359, , 0.325, 0.329, 0.334, 0.338, 0.343, , 0.226, 0.229, 0.232, 0.235, 0.238, , 0.174, 0.176, 0.179, 0.181, 0.184, , 0.142, 0.144, 0.146, 0.148, 0.150, , 30, 40, 50, 100, 200, 500, 1000, , 2.59, 2.80, 2.99, 3.74, 4.79, 6.81, 9.01, , 1.95, 2.11, 2.25, 2.83, 3.63, 5.16, 6.83, , 1.54, 1.66, 1.78, 2.24, 2.88, 4.10, 5.42, , 1.27, 1.38, 1.48, 1.86, 2.39, 3.41, 4.52, , 1.09, 1.18, 1.27, 1.60, 2.06, 2.93, 3.88, , 0.96, 1.04, 1.11, 1.40, 1.81, 2.58, 3.41, , 0.85, 0.93, 0.99, 1.25, 1.61, 2.30, 3.05, , 0.77, 0.84, 0.90, 1.13, 1.46, 2.08, 2.76, , 0.70, 0.76, 0.82, 1.03, 1.33, 1.90, 2.52, , 0.65, 0.70, 0.75, 0.95, 1.23, 1.75, 2.32, , 0.60, 0.65, 0.70, 0.88, 1.14, 1.62, 2.15, , 0.56, 0.61, 0.65, 0.82, 1.06, 1.52, 2.01, , 0.52, 0.57, 0.61, 0.77, 0.99, 1.42, 1.88, , 0.49, 0.54, 0.57, 0.73, 0.94, 1.34, 1.77, , 0.46, 0.51, 0.54, 0.69, 0.88, 1.26, 1.68, , 0.44, 0.48, 0.51, 0.65, 0.84, 1.20, 1.59, , 0.419, 0.456, 0.489, 0.62, 0.80, 1.14, 1.51, , 0.399, 0.435, 0.466, 0.590, 0.76, 1.09, 1.44, , 0.381, 0.415, 0.446, 0.564, 0.73, 1.04, 1.38, , 0.266, 0.289, 0.310, 0.393, 0.507, 0.73, 0.96, , 0.205, 0.223, 0.240, 0.304, 0.392, 0.560, 0.743, , 0.168, 0.183, 0.196, 0.248, 0.320, 0.458, 0.608, , Source: Sachs, 1972, , 100 STATISTICAL TESTS, , 2, 2, 3, 4, 5
Page 214 :
TABLES, Table 11, , 205, , Critical values for the Dunnett test, Level of significance α = 0.01, , K, , 2, , 3, , 4, , 5, , 6, , 7, , 8, , 9, , 5, 6, 7, 8, 9, , 3.90, 3.61, 3.42, 3.29, 3.19, , 4.21, 3.88, 3.66, 3.51, 3.40, , 4.43, 4.07, 3.83, 3.67, 3.55, , 4.60, 4.21, 3.96, 3.79, 3.66, , 4.73, 4.33, 4.07, 3.88, 3.75, , 4.85, 4.43, 4.15, 3.96, 3.82, , 4.94, 4.51, 4.23, 4.03, 3.89, , 5.03, 4.59, 4.30, 4.09, 3.94, , 10, 11, 12, 13, 14, , 3.11, 3.06, 3.01, 2.97, 2.94, , 3.31, 3.25, 3.19, 3.15, 3.11, , 3.45, 3.38, 3.32, 3.27, 3.23, , 3.56, 3.48, 3.42, 3.37, 3.32, , 3.64, 3.56, 3.50, 3.44, 3.40, , 3.71, 3.63, 3.56, 3.51, 3.46, , 3.78, 3.69, 3.62, 3.56, 3.51, , 3.83, 3.74, 3.67, 3.61, 3.56, , 15, 16, 17, 18, 20, , 2.91, 2.88, 2.86, 2.84, 2.81, , 3.08, 3.05, 3.03, 3.01, 2.97, , 3.20, 3.17, 3.14, 3.12, 3.08, , 3.29, 3.26, 3.23, 3.21, 3.17, , 3.36, 3.33, 3.30, 3.27, 3.23, , 3.42, 3.39, 3.36, 3.33, 3.29, , 3.47, 3.44, 3.41, 3.38, 3.34, , 3.52, 3.48, 3.43, 3.42, 3.38, , 24, 30, 40, 60, 120, ∞, , 2.77, 2.72, 2.68, 2.64, 2.60, 2.56, , 2.92, 2.87, 2.82, 2.78, 2.73, 2.68, , 3.03, 2.97, 2.92, 2.87, 2.82, 2.77, , 3.11, 3.05, 2.99, 2.94, 2.89, 2.84, , 3.17, 3.11, 3.05, 3.00, 2.94, 2.89, , 3.22, 3.16, 3.10, 3.04, 2.99, 2.93, , 3.27, 3.21, 3.14, 3.08, 3.03, 2.97, , 3.31, 3.24, 3.18, 3.12, 3.06, 3.00, , ν, , Level of significance α = 0.05, K, , 2, , 3, , 4, , 5, , 6, , 7, , 8, , 9, , 5, 6, 7, 8, 9, , 2.44, 2.34, 2.27, 2.22, 2.18, , 2.68, 2.56, 2.48, 2.42, 2.37, , 2.85, 2.71, 2.62, 2.55, 2.50, , 2.98, 2.83, 2.73, 2.66, 2.60, , 3.08, 2.92, 2.82, 2.74, 2.68, , 3.16, 3.00, 2.89, 2.81, 2.75, , 3.24, 3.07, 2.95, 2.87, 2.81, , 3.30, 3.12, 3.01, 2.92, 2.86, , 10, 11, 12, 13, 14, , 2.15, 2.13, 2.11, 2.09, 2.08, , 2.34, 2.31, 2.29, 2.27, 2.25, , 2.47, 2.44, 2.41, 2.39, 2.37, , 2.56, 2.53, 2.50, 2.48, 2.46, , 2.64, 2.60, 2.58, 2.55, 2.53, , 2.70, 2.67, 2.64, 2.61, 2.59, , 2.76, 2.72, 2.69, 2.66, 2.64, , 2.81, 2.77, 2.74, 2.71, 2.69, , 15, 16, 17, 18, 20, , 2.07, 2.06, 2.05, 2.04, 2.03, , 2.24, 2.23, 2.22, 2.21, 2.19, , 2.36, 2.34, 2.33, 2.32, 2.30, , 2.44, 2.43, 2.42, 2.41, 2.39, , 2.51, 2.50, 2.49, 2.48, 2.46, , 2.57, 2.56, 2.54, 2.53, 2.51, , 2.62, 2.61, 2.59, 2.58, 2.56, , 2.67, 2.65, 2.64, 2.62, 2.60, , 24, 30, 40, 60, 120, ∞, , 2.01, 1.99, 1.97, 1.95, 1.93, 1.92, , 2.17, 2.15, 2.13, 2.10, 2.08, 2.06, , 2.28, 2.25, 2.23, 2.21, 2.18, 2.16, , 2.36, 2.33, 2.31, 2.28, 2.26, 2.23, , 2.43, 2.40, 2.37, 2.35, 2.32, 2.29, , 2.48, 2.45, 2.42, 2.39, 2.37, 2.34, , 2.53, 2.50, 2.47, 2.44, 2.41, 2.38, , 2.57, 2.54, 2.51, 2.48, 2.45, 2.46, , ν, , Source: De Jonge, 1963–4
Page 215 :
206, , Table 12 Critical values of M for the Bartlett test, C = constant values., , Ci, , 0.0, , 0.5, , 1.0, , 1.5, , 2.0, , 2.5, , 3.0, , 3.5, , 4.0, , 4.5, , 5.0, , 6.0, , 7.0, , 8.0, , 9.0, , 10.0, , 3, 4, 5, 6, 7, , 9.21, 11.34, 13.28, 15.09, 16.81, , 9.92, 11.95, 13.81, 15.58, 17.27, , 10.47, 12.46, 14.30, 16.03, 17.70, , 10.78, 12.86, 14.71, 16.44, 18.10, , 10.81, 13.11, 15.03, 16.79, 18.46, , 10.50, 13.18, 15.25, 17.07, 18.77, , 9.83, 13.03, 15.34, 17.27, 19.02, , –, 12.65, 15.28, 17.37, 19.21, , –, 12.03, 15.06, 17.37, 19.32, , –, –, 14.66, 17.24, 19.35, , –, –, 14.07, 16.98, 19.28, , –, –, –, 16.03, 18.84, , –, –, –, –, 17.92, , –, –, –, –, –, , –, –, –, –, –, , –, –, –, –, –, , 8, 9, 10, 11, 12, , 18.48, 20.09, 21.67, 23.21, 24.72, , 18.91, 20.50, 22.06, 23.59, 25.10, , 19.32, 20.90, 22.45, 23.97, 25.46, , 19.71, 21.28, 22.82, 24.33, 25.81, , 20.07, 21.64, 23.17, 24.67, 26.15, , 20.39, 21.97, 23.50, 25.00, 26.48, , 20.67, 22.26, 23.80, 25.31, 26.79, , 20.90, 22.52, 24.08, 25.59, 27.08, , 21.08, 22.74, 24.32, 25.85, 27.35, , 21.20, 22.91, 24.52, 26.08, 27.59, , 21.35, 23.03, 24.69, 26.28, 27.81, , 21.13, 23.10, 24.90, 26.57, 28.16, , 20.64, 22.91, 24.90, 26.70, 28.39, , 19.76, 22.41, 24.66, 26.65, 28.46, , –, 21.56, 24.15, 26.38, 28.37, , –, –, 23.33, 25.86, 28.07, , 13, 14, 15, , 26.22, 27.69, 29.14, , 26.58, 28.04, 29.39, , 26.93, 28.39, 29.83, , 27.28, 28.73, 30.16, , 27.62, 29.06, 30.49, , 27.94, 29.38, 30.80, , 28.25, 29.69, 30.11, , 28.54, 29.98, 31.40, , 28.81, 30.26, 31.68, , 29.07, 30.52, 31.95, , 29.30, 30.77, 32.20, , 29.70, 31.19, 32.66, , 29.99, 31.53, 33.03, , 30.16, 31.77, 33.32, , 30.19, 31.89, 33.51, , 30.06, 31.88, 33.59, , K, , 100 STATISTICAL TESTS, , Level of significance α = 0.01
Page 216 :
Table 12 continued, K, , Ci, , Level of significance α = 0.05, , 0.5, , 1.0, , 1.5, , 2.0, , 2.5, , 3.0, , 3.5, , 4.0, , 4.5, , 5.0, , 6.0, , 7.0, , 8.0, , 9.0, , 10.0, , 3, 4, 5, 6, 7, , 5.99, 7.81, 9.49, 11.07, 12.59, , 6.47, 8.24, 9.88, 11.43, 12.94, , 5.89, 8.63, 10.24, 11.78, 13.27, , 7.20, 8.96, 10.57, 12.11, 13.59, , 7.38, 9.21, 10.86, 12.40, 13.88, , 7.39, 9.38, 11.08, 12.65, 14.15, , 7.22, 9.43, 11.24, 12.86, 14.38, , –, 9.37, 11.32, 13.01, 14.58, , –, 9.18, 11.31, 13.11, 14.73, , –, –, 11.21, 13.14, 14.83, , –, –, 11.02, 13.10, 14.88, , –, –, –, 12.78, 14.81, , –, –, –, –, 14.49, , –, –, –, –, –, , –, –, –, –, –, , –, –, –, –, –, , 8, 9, 10, 11, 12, , 14.07, 15.51, 16.92, 18.31, 19.68, , 14.40, 15.83, 17.23, 18.61, 19.97, , 14.72, 16.14, 17.54, 18.91, 20.26, , 15.03, 16.44, 17.83, 19.20, 20.55, , 15.32, 16.73, 18.12, 19.48, 20.83, , 15.60, 17.01, 18.39, 19.76, 21.10, , 15.84, 17.26, 18.65, 20.02, 21.36, , 16.06, 17.49, 18.89, 20.26, 21.61, , 16.25, 17.70, 19.11, 20.49, 21.84, , 16.40, 17.88, 19.31, 20.70, 22.06, , 16.51, 18.03, 19.48, 20.89, 22.27, , 16.60, 16.22, 19.75, 21.21, 22.62, , 16.49, 18.26, 19.89, 21.42, 22.88, , 16.16, 18.12, 19.89, 21.52, 23.06, , –, 17.79, 19.73, 21.49, 23.12, , –, –, 19.40, 21.32, 23.07, , 13, 14, 15, , 21.03, 22.36, 23.68, , 21.32, 22.65, 23.97, , 21.60, 22.93, 24.24, , 21.89, 23.21, 24.52, , 22.16, 23.48, 24.79, , 22.43, 23.75, 25.05, , 22.69, 24.01, 25.31, , 22.94, 24.26, 25.56, , 23.18, 24.50, 25.80, , 23.40, 24.73, 26.04, , 23.62, 24.95, 26.26, , 23.99, 25.34, 26.67, , 24.30, 25.68, 27.03, , 24.53, 25.95, 27.33, , 24.66, 26.14, 27.56, , 24.70, 26.25, 27.73, , TABLES, , 0.0, , Source: Merrington and Thompson, 1946, , 207
Page 217 :
208, , Table 13 Critical values for the Hartley test (right-sided), Level of significance α = 0.01, K, n−1, , 3, , 4, , 199, 47.5, 23.2, 14.9, 11.1, , 448, 85, 37, 22, 15.5, , 729, 120, 49, 28, 19.1, , 5, , 6, , 7, , 8, , 9, , 10, , 11, , 12, , 1036, 151, 59, 33, 22, , 1362, 184, 69, 38, 25, , 1705, 216∗, 79, 42, 27, , 2063, 249∗, 89, 46, 30, , 2432, 281∗, 97, 50, 32, , 2813, 310∗, 106, 54, 34, , 3204, 337∗, 113, 57, 36, , 3605, 361∗, 120, 60, 37, , 7, 8, 9, 10, 12, , 8.89, 7.50, 6.54, 5.85, 4.91, , 12.1, 9.9, 8.5, 7.4, 6.1, , 14.5, 11.7, 9.9, 8.6, 6.9, , 16.5, 13.2, 11.1, 9.6, 7.6, , 18.4, 14.5, 12.1, 10.4, 8.2, , 20, 15.8, 13.1, 11.1, 8.7, , 22, 16.9, 13.9, 11.8, 9.1, , 23, 17.9, 14.7, 12.4, 9.5, , 24, 18.9, 15.3, 12.9, 9.9, , 26, 19.8, 16.0, 13.4, 10.2, , 27, 21, 16.6, 13.9, 10.6, , 15, 20, 30, 60, ∞, , 4.07, 3.32, 2.63, 1.96, 1.0, , 4.9, 3.8, 3.0, 2.2, 1.0, , 5.5, 4.3, 3.3, 2.3, 1.0, , 6.0, 4.6, 3.4, 2.4, 1.0, , 6.4, 4.9, 3.6, 2.4, 1.0, , 6.7, 5.1, 3.7, 2.5, 1.0, , 7.1, 5.3, 3.8, 2.5, 1.0, , 7.3, 5.5, 3.9, 2.6, 1.0, , 7.5, 5.6, 4.0, 2.6, 1.0, , 7.8, 5.8, 4.1, 2.7, 1.0, , 8.0, 5.9, 4.2, 2.7, 1.0, , ∗ The unit digit is uncertain., , 100 STATISTICAL TESTS, , 2, 3, 4, 5, 6, , 2
Page 218 :
Table 13 continued, Level of significance α = 0.05, K, n−1, , 3, , 4, , 5, , 6, , 7, , 8, , 9, , 10, , 11, , 12, , 2, 3, 4, 5, 6, , 39.0, 15.4, 9.60, 7.15, 5.82, , 87.5, 27.8, 15.5, 10.8, 8.38, , 142, 39.2, 20.6, 13.7, 10.4, , 202, 50.7, 25.2, 16.3, 12.1, , 266, 62.0, 29.5, 18.7, 13.7, , 333, 72.9, 33.6, 20.8, 15.0, , 403, 83.5, 37.5, 22.9, 16.3, , 475, 93.9, 41.1, 24.7, 17.5, , 550, 104, 44.6, 26.5, 18.6, , 626, 114, 48.0, 28.2, 19.7, , 704, 124, 51.4, 29.9, 20.7, , 7, 8, 9, 10, 12, , 4.99, 4.43, 4.03, 3.72, 3.28, , 6.94, 6.00, 5.34, 4.85, 4.16, , 8.44, 7.18, 6.31, 5.67, 4.79, , 9.70, 8.12, 7.11, 6.34, 5.30, , 10.8, 9.03, 7.80, 6.92, 5.72, , 11.8, 9.78, 8.41, 7.42, 6.09, , 12.7, 10.5, 8.95, 7.87, 6.42, , 13.5, 11.1, 9.45, 8.28, 6.72, , 14.3, 11.7, 9.91, 8.66, 7.00, , 15.1, 12.2, 10.3, 9.01, 7.25, , 15.8, 12.7, 10.7, 9.34, 7.48, , 15, 20, 30, 60, ∞, , 2.86, 2.46, 2.07, 1.67, 1.00, , 3.54, 2.95, 2.40, 1.85, 1.00, , 4.01, 3.29, 2.61, 1.96, 1.00, , 4.37, 3.54, 2.78, 2.04, 1.00, , 4.68, 3.76, 2.91, 2.11, 1.00, , 4.95, 3.94, 3.02, 2.17, 1.00, , 5.19, 4.10, 3.12, 2.22, 1.00, , 5.40, 4.24, 3.21, 2.26, 1.00, , 5.59, 4.37, 3.29, 2.30, 1.00, , 5.77, 4.49, 3.36, 2.33, 1.00, , 5.93, 4.59, 3.39, 2.36, 1.00, , TABLES, , 2, , Source: De Jonge, 1963–4, , 209
Page 219 :
210, , 100 STATISTICAL TESTS, , Table 14, , Critical values of w/s for the normality test, , Columns a denote the lower boundaries or the left-sided critical values., Columns b denote the upper boundaries or the right-sided critical values., Level of significance α, n, , 0.000, a, , 0.005, b, , a, , 0.01, b, , a, , 0.025, b, , a, , 0.05, b, , a, , 0.10, b, , a, , b, , 3, 4, 5, , 1.732, 1.732, 1.826, , 2.000 1.735 2.000 1.737 2.000 1.745 2.000 1.758 1.999 1.782 1.997, 2.449 1.82 2.447 1.87 2.445 1.93 2.439 1.98 2.429 2.04 2.409, 2.828 1.98 2.813 2.02 2.803 2.09 2.782 2.15 2.753 2.22 2.712, , 6, 7, 8, 9, 10, , 1.826, 1.871, 1.871, 1.897, 1.897, , 3.162, 3.464, 3.742, 4.000, 4.243, , 2.11, 2.22, 2.31, 2.39, 2.46, , 3.115, 3.369, 3.585, 3.772, 3.935, , 2.15, 2.26, 2.35, 2.44, 2.51, , 3.095, 3.338, 3.543, 3.720, 3.875, , 2.22, 2.33, 2.43, 2.51, 2.59, , 3.056, 3.282, 3.471, 3.634, 3.777, , 2.28, 2.40, 2.50, 2.59, 2.67, , 3.012, 3.222, 3.399, 3.552, 3.685, , 2.37, 2.49, 2.59, 2.68, 2.76, , 2.949, 3.143, 3.308, 3.449, 3.57, , 11, 12, 13, 14, 15, , 1.915, 1.915, 1.927, 1.927, 1.936, , 4.472, 4.690, 4.899, 5.099, 5.292, , 2.53, 2.59, 2.64, 2.70, 2.74, , 4.079, 4.208, 4.325, 4.431, 4.53, , 2.58, 2.64, 2.70, 2.75, 2.80, , 4.012, 4.134, 4.244, 4.34, 4.44, , 2.66, 2.72, 2.78, 2.83, 2.88, , 3.903, 4.02, 4.12, 4.21, 4.29, , 2.74, 2.80, 2.86, 2.92, 2.97, , 3.80, 3.91, 4.00, 4.09, 4.17, , 2.84, 2.90, 2.96, 3.02, 3.07, , 3.68, 3.78, 3.87, 3.95, 4.02, , 16, 17, 18, 19, 20, , 1.936, 1.944, 1.944, 1.949, 1.949, , 5.477, 5.657, 5.831, 6.000, 6.164, , 2.79, 2.83, 2.87, 2.90, 2.94, , 4.62, 4.70, 4.78, 4.85, 4.91, , 2.84, 2.88, 2.92, 2.96, 2.99, , 4.52, 4.60, 4.67, 4.74, 4.80, , 2.93, 2.97, 3.01, 3.05, 3.09, , 4.37, 4.44, 4.51, 4.56, 4.63, , 3.01, 3.06, 3.10, 3.14, 3.18, , 4.24, 4.31, 4.37, 4.43, 4.49, , 3.12, 3.17, 3.21, 3.25, 3.29, , 4.09, 4.15, 4.21, 4.27, 4.32, , 25, 30, 35, 40, 45, , 1.961, 1.966, 1.972, 1.975, 1.978, , 6.93, 7.62, 8.25, 8.83, 9.38, , 3.09, 3.21, 3.32, 3.41, 3.49, , 5.19, 5.40, 5.57, 5.71, 5.83, , 3.15, 3.27, 3.38, 3.47, 3.55, , 5.06, 5.26, 5.42, 5.56, 5.67, , 3.24, 3.37, 3.48, 3.57, 3.66, , 4.87, 5.06, 5.21, 5.34, 5.45, , 3.34, 3.47, 3.58, 3.67, 3.75, , 4.71, 4.89, 5.04, 5.16, 5.26, , 3.45, 3.59, 3.70, 3.79, 3.88, , 4.53, 4.70, 4.84, 4.96, 5.06, , 50, 55, 60, 65, 70, , 1.980, 1.982, 1.983, 1.985, 1.986, , 9.90, 10.39, 10.86, 11.31, 11.75, , 3.56, 3.62, 3.68, 3.74, 3.79, , 5.93, 6.02, 6.10, 6.17, 6.24, , 3.62, 3.69, 3.75, 3.80, 3.85, , 5.77, 5.86, 5.94, 6.01, 6.07, , 3.73, 3.80, 3.86, 3.91, 3.96, , 5.54, 5.63, 5.70, 5.77, 5.83, , 3.83, 3.90, 3.96, 4.01, 4.06, , 5.35, 5.43, 5.51, 5.57, 5.63, , 3.95, 4.02, 4.08, 4.14, 4.19, , 5.14, 5.22, 5.29, 5.35, 5.41, , 75, 80, 85, 90, 95, , 1.987, 1.987, 1.988, 1.989, 1.990, , 12.17, 12.57, 12.96, 13.34, 13.71, , 3.83, 3.88, 3.92, 3.96, 3.99, , 6.30, 6.35, 6.40, 6.45, 6.49, , 3.90, 3.94, 3.99, 4.02, 4.06, , 6.13, 6.18, 6.23, 6.27, 6.32, , 4.01, 4.05, 4.09, 4.13, 4.17, , 5.88, 5.93, 5.98, 6.03, 6.07, , 4.11, 4.16, 4.20, 4.24, 4.27, , 5.68, 5.73, 5.78, 5.82, 5.86, , 4.24, 4.28, 4.33, 4.36, 4.40, , 5.46, 5.51, 5.56, 5.60, 5.64, , 100, 150, 200, 500, 1000, , 1.990, 1.993, 1.995, 1.998, 1.999, , 14.07, 17.26, 19.95, 31.59, 44.70, , 4.03, 4.32, 4.53, 5.06, 5.50, , 6.53, 6.82, 7.01, 7.60, 7.99, , 4.10, 4.38, 4.59, 5.13, 5.57, , 6.36, 6.64, 6.84, 7.42, 7.80, , 4.21, 4.48, 4.68, 5.25, 5.68, , 6.11, 6.39, 6.60, 7.15, 7.54, , 4.31, 4.59, 4.78, 5.47, 5.79, , 5.90, 6.18, 6.39, 6.94, 7.33, , 4.44, 4.72, 4.90, 5.49, 5.92, , 5.68, 5.96, 6.15, 6.72, 7.11, , Source: Sachs, 1972
Page 220 :
Table 15 Critical values for the Cochran test for variance outliers, Degrees of freedom ν = n − 1., , Level of significance α = 0.01, , νx, 2, , 3, , 4, , 5, , 6, , 7, , 8, , 9, , 10, , 16, , 36, , 144, , ∞, , 2, 3, 4, 5, , 0.9999, 0.9933, 0.9676, 0.9279, , 0.9950, 0.9423, 0.8643, 0.7885, , 0.9794, 0.8831, 0.7814, 0.6957, , 0.9586, 0.8335, 0.7212, 0.6329, , 0.9373, 0.7933, 0.6761, 0.5875, , 0.9172, 0.7606, 0.6410, 0.5531, , 0.8988, 0.7335, 0.6129, 0.5259, , 0.8823, 0.7107, 0.5897, 0.5037, , 0.8674, 0.6912, 0.5702, 0.4854, , 0.8539, 0.6743, 0.5536, 0.4697, , 0.7949, 0.6059, 0.4884, 0.4094, , 0.7067, 0.5153, 0.4057, 0.3351, , 0.6062, 0.4230, 0.3251, 0.2644, , 0.5000, 0.3333, 0.2500, 0.2000, , 6, 7, 8, 9, 10, , 0.8828, 0.8376, 0.7945, 0.7544, 0.7175, , 0.7218, 0.6644, 0.6152, 0.5727, 0.5358, , 0.6258, 0.5685, 0.5209, 0.4810, 0.4469, , 0.5635, 0.5080, 0.4627, 0.4251, 0.3934, , 0.5195, 0.4659, 0.4226, 0.3870, 0.3572, , 0.4866, 0.4347, 0.3932, 0.3592, 0.3308, , 0.4608, 0.4105, 0.3704, 0.3378, 0.3106, , 0.4401, 0.3911, 0.3522, 0.3207, 0.2945, , 0.4229, 0.3751, 0.3373, 0.3067, 0.2813, , 0.4084, 0.3616, 0.3248, 0.2950, 0.2704, , 0.3529, 0.3105, 0.2779, 0.2514, 0.2297, , 0.2858, 0.2494, 0.2214, 0.1992, 0.1811, , 0.2229, 0.1929, 0.1700, 0.1521, 0.1376, , 0.1667, 0.1429, 0.1250, 0.1111, 0.1000, , 12, 15, 20, 24, 30, , 0.6528, 0.5747, 0.4799, 0.4247, 0.3632, , 0.4751, 0.4069, 0.3297, 0.2871, 0.2412, , 0.3919, 0.3317, 0.2654, 0.2295, 0.1913, , 0.3428, 0.2882, 0.2288, 0.1970, 0.1635, , 0.3099, 0.2593, 0.2048, 0.1759, 0.1454, , 0.2861, 0.2386, 0.1877, 0.1608, 0.1327, , 0.2680, 0.2228, 0.1748, 0.1495, 0.1232, , 0.2535, 0.2104, 0.1646, 0.1406, 0.1157, , 0.2419, 0.2002, 0.1567, 0.1338, 0.1100, , 0.2320, 0.1918, 0.1501, 0.1283, 0.1054, , 0.1961, 0.1612, 0.1248, 0.1060, 0.0867, , 0.1535, 0.1251, 0.0960, 0.0810, 0.0658, , 0.1157, 0.0934, 0.0709, 0.0595, 0.0480, , 0.0833, 0.0667, 0.0500, 0.0417, 0.0333, , 40, 60, 120, ∞, , 0.2940, 0.2151, 0.1225, 0, , 0.1915, 0.1371, 0.0759, 0, , 0.1508, 0.1069, 0.0585, 0, , 0.1281, 0.0902, 0.0489, 0, , 0.1135, 0.0796, 0.0429, 0, , 0.1033, 0.0722, 0.0387, 0, , 0.0957, 0.0668, 0.0357, 0, , 0.0898, 0.0625, 0.0334, 0, , 0.0853, 0.0594, 0.0316, 0, , 0.0816, 0.0567, 0.0302, 0, , 0.0668, 0.0461, 0.0242, 0, , 0.0503, 0.0344, 0.0178, 0, , 0.0363, 0.0245, 0.0125, 0, , 0.0250, 0.0167, 0.0083, 0, , TABLES, , 1, , K, , 211
Page 221 :
212, , Table 15 continued, , Level of significance α = 0.05, , νx, 2, , 3, , 4, , 5, , 6, , 7, , 8, , 9, , 10, , 16, , 36, , 144, , ∞, , 2, 3, 4, 5, , 0.9985, 0.9669, 0.9065, 0.8412, , 0.9750, 0.8709, 0.7679, 0.6838, , 0.9392, 0.7977, 0.6841, 0.5981, , 0.9057, 0.7457, 0.6287, 0.5441, , 0.8772, 0.7071, 0.5895, 0.5065, , 0.8534, 0.6771, 0.5598, 0.4783, , 0.8332, 0.6530, 0.5365, 0.4564, , 0.8159, 0.6333, 0.5175, 0.4387, , 0.8010, 0.6167, 0.5017, 0.4241, , 0.7880, 0.6025, 0.4884, 0.4118, , 0.7341, 0.5466, 0.4366, 0.3645, , 0.6602, 0.4748, 0.3720, 0.3066, , 0.5813, 0.4031, 0.3093, 0.2513, , 0.5000, 0.3333, 0.2500, 0.2000, , 6, 7, 8, 9, 10, , 0.7808, 0.7271, 0.6798, 0.6385, 0.6020, , 0.6161, 0.5612, 0.5157, 0.4775, 0.4450, , 0.5321, 0.4800, 0.4377, 0.4027, 0.3733, , 0.4803, 0.4307, 0.3910, 0.3584, 0.3311, , 0.4447, 0.3974, 0.3595, 0.3286, 0.3029, , 0.4184, 0.3726, 0.3362, 0.3067, 0.2823, , 0.3980, 0.3535, 0.3185, 0.2901, 0.2666, , 0.3817, 0.3384, 0.3043, 0.2768, 0.2541, , 0.3682, 0.3259, 0.2926, 0.2659, 0.2439, , 0.3568, 0.3154, 0.2829, 0.2568, 0.2353, , 0.3135, 0.2756, 0.2462, 0.2226, 0.2032, , 0.2612, 0.2278, 0.2022, 0.1820, 0.1655, , 0.2119, 0.1833, 0.1616, 0.1446, 0.1308, , 0.1667, 0.1429, 0.1250, 0.1111, 0.1000, , 12, 15, 20, 24, 30, , 0.5410, 0.4709, 0.3894, 0.3434, 0.2929, , 0.3924, 0.3346, 0.2705, 0.2354, 0.1980, , 0.3264, 0.2758, 0.2205, 0.1907, 0.1593, , 0.2880, 0.2419, 0.1921, 0.1656, 0.1377, , 0.2624, 0.2195, 0.1735, 0.1493, 0.1237, , 0.2439, 0.2034, O.1602, 0.1374, 0.1137, , 0.2299, 0.1911, 0.1501, 0.1286, 0.1061, , 0.2187, 0.1815, 0.1422, 0.1216, 0.1002, , 0.2098, 0.1736, 0.1357, 0.1160, 0.0958, , 0.2020, 0.1671, 0.1303, 0.1113, 0.0921, , 0.1737, 0.1429, 0.1108, 0.0942, 0.0771, , 0.1403, 0.1144, 0.0879, 0.0743, 0.0604, , 0.1100, 0.0889, 0.0675, 0.0567, 0.0457, , 0.0833, 0.0667, 0.0500, 0.0417, 0.0333, , 40, 60, 120, ∞, , 0.2370, 0.1737, 0.0998, 0, , 0.1576, 0.1131, 0.0632, 0, , 0.1259, 0.0895, 0.0495, 0, , 0.1082, 0.0765, 0.0419, 0, , 0.0968, 0.0682, 0.0371, 0, , 0.0887, 0.0623, 0.0337, 0, , 0.0827, 0.0583, 0.0312, 0, , 0.0780, 0.0552, 0.0292, 0, , 0.0745, 0.0520, 0.0279, 0, , 0.0713, 0.0497, 0.0266, 0, , 0.0595, 0.0411, 0.0218, 0, , 0.0462, 0.0316, 0.0165, 0, , 0.0347, 0.0234, 0.0120, 0, , 0.0250, 0.0167, 0.0083, 0, , Source: Dixon and Massey, 1957, , 100 STATISTICAL TESTS, , 1, , K
Page 222 :
TABLES, , 213, , Table 16 Critical values of D for the Kolmogorov–Smirnov, one-sample test, D = maximum values of the differences., n, , Level of significance α, 0.20, , 0.15, , 0.10, , 0.05, , 0.01, , 1, 2, 3, 4, 5, , 0.900, 0.684, 0.565, 0.494, 0.446, , 0.925, 0.726, 0.597, 0.525, 0.474, , 0.950, 0.776, 0.642, 0.564, 0.510, , 0.975, 0.842, 0.708, 0.624, 0.565, , 0.995, 0.929, 0.823, 0.733, 0.669, , 6, 7, 8, 9, 10, , 0.410, 0.381, 0.358, 0.339, 0.322, , 0.436, 0.405, 0.381, 0.360, 0.342, , 0.470, 0.438, 0.411, 0.388, 0.368, , 0.521, 0.486, 0.457, 0.432, 0.410, , 0.618, 0.577, 0.543, 0.514, 0.490, , 11, 12, 13, 14, 15, , 0.307, 0.295, 0.284, 0.274, 0.266, , 0.326, 0.313, 0.302, 0.292, 0.283, , 0.352, 0.338, 0.325, 0.314, 0.304, , 0.391, 0.375, 0.361, 0.349, 0.338, , 0.468, 0.450, 0.433, 0.418, 0.404, , 16, 17, 18, 19, 20, , 0.258, 0.250, 0.244, 0.237, 0.231, , 0.274, 0.266, 0.259, 0.252, 0.246, , 0.295, 0.286, 0.278, 0.272, 0.264, , 0.328, 0.318, 0.309, 0.301, 0.294, , 0.392, 0.381, 0.371, 0.363, 0.356, , 25, 30, 35, , 0.21, 0.19, 0.18, , 0.22, 0.20, 0.19, , 0.24, 0.22, 0.21, , 0.27, 0.24, 0.23, , 0.32, 0.29, 0.27, , 1.07, √, n, , 1.14, √, n, , 1.22, √, n, , 1.36, √, n, , 1.63, √, n, , Over 35, , Source: Massey, 1951
Page 223 :
214, , 100 STATISTICAL TESTS, , Table 17, , Critical values of T for the sign test, Level of significance α, , Two-sided, One-sided, , 0.10, 0.05, , 0.05, 0.025, , 0.02, 0.01, , Level of significance α, 0.01, 0.005, , n, 1, 2, 3, 4, 5, 6, 7, 8, 9, 10, 11, 12, 13, 14, 15, 16, 17, 18, 19, 20, 21, 22, 23, 24, 25, 26, 27, 28, 29, 30, , Two-sided, One-sided, , 0.10, 0.05, , 0.05, 0.025, , 0.02, 0.01, , 0.01, 0.005, , 11, 12, 11, 12, 11, 12, 11, 12, 13, 12, 13, 14, 13, 14, 15, 14, 15, 14, 15, 16, 15, 16, 17, 16, 17, 16, 17, 18, 19, 18, , 13, 14, 13, 14, 13, 14, 13, 14, 15, 14, 15, 16, 15, 16, 17, 16, 17, 18, 17, 18, 19, 18, 19, 20, 19, 20, 21, 20, 21, 22, , 15, 16, 15, 16, 15, 16, 17, 16, 17, 16, 17, 18, 19, 18, 19, 18, 19, 20, 21, 20, 23, 22, 23, 22, 23, 22, 23, 24, 25, 26, , 17, 16, 17, 16, 17, 18, 17, 18, 17, 18, 19, 20, 19, 20, 21, 20, 21, 22, 23, 22, 25, 24, 25, 24, 25, 24, 27, 26, 27, 28, , n, –, –, –, –, 5, 6, 7, 6, 7, 8, 7, 8, 7, 8, 9, 8, 9, 8, 9, 10, 9, 10, 9, 10, 11, 10, 11, 10, 11, 10, , Source: Wijvekate, 1962, , –, –, –, –, –, 6, 7, 8, 7, 8, 9, 8, 9, 10, 9, 10, 9, 10, 11, 10, 11, 12, 11, 12, 11, 12, 13, 12, 13, 12, , –, –, –, –, –, –, 7, 8, 9, 10, 9, 10, 11, 10, 11, 12, 11, 12, 11, 12, 13, 12, 13, 14, 13, 14, 13, 14, 15, 14, , –, –, –, –, –, –, –, 8, 9, 10, 11, 10, 11, 12, 11, 12, 13, 12, 13, 14, 13, 14, 15, 14, 15, 14, 15, 16, 15, 16, , 31, 32, 33, 34, 35, 36, 37, 38, 39, 40, 45, 46, 49, 50, 55, 56, 59, 60, 65, 66, 69, 70, 75, 76, 79, 80, 89, 90, 99, 100
Page 224 :
TABLES, , 215, , F (r ), , r=0, , Table 18, , r, , Critical values of r for the sign test for paired observations, , N is the total number of equally probable dichotomous events, r, the smaller of the number of events of either kind. If r ≤ rN;α, then there are too few events of one kind at the 1 − α confidence level., For large values of N,, √ r is approximately distributed as z., Use µ = N/2, σ = N/2 and Zα = (µ − rN;α )/σ ., N, , rN;0.10, , rN;0.05, , rN;0.01, , rN;0.005, , rN;0.001, , 8, 10, 12, 14, 16, , 1, 1, 2, 3, 4, , 0, 1, 2, 2, 3, , 0, 0, 1, 1, 1, , 0, 0, 0, 0, , 0, 0, 0, , 18, 20, 22, 25, 30, , 5, 5, 6, 7, 10, , 4, 5, 5, 7, 9, , 3, 3, 4, 5, 7, , 2, 3, 4, 5, 6, , 1, 2, 3, 4, 5, , 35, 40, 45, 50, 55, , 12, 14, 16, 18, 20, , 11, 13, 15, 17, 19, , 9, 11, 13, 15, 17, , 8, 10, 12, 15, 17, , 7, 9, 11, 13, 15, , Source: Dixon and Massey, 1957
Page 225 :
216, , 100 STATISTICAL TESTS, Table 19 Critical values of T for the signed rank test for paired, differences, n is the number of pairs of observations., Level of significance α, , Level of significance α, n, , Two-sided, 0.05, , 0.01, , One-sided, , 0.001, , 0.05, , 0.01, 0, 1, 3, 5, 7, 9, 12, 15, 19, , n, , Two-sided, , One-sided, , 0.05, , 0.01, , 0.001, , 0.05, , 0.01, , 36, 37, 38, 39, 40, 41, 42, 43, 44, 45, , 208, 221, 235, 249, 264, 279, 294, 310, 327, 343, , 171, 182, 194, 207, 220, 233, 247, 261, 276, 291, , 130, 140, 150, 161, 172, 183, 195, 207, 220, 233, , 227, 241, 256, 271, 286, 302, 319, 336, 353, 371, , 185, 198, 211, 224, 238, 252, 266, 281, 296, 312, , 6, 7, 8, 9, 10, 11, 12, 13, 14, 15, , 0, 2, 3, 5, 8, 10, 13, 17, 21, 25, , 0, 1, 3, 5, 7, 9, 12, 15, , 0, 1, 2, 4, 6, , 2, 3, 5, 8, 10, 13, 17, 21, 25, 30, , 16, 17, 18, 19, 20, 21, 22, 23, 24, 25, , 29, 34, 40, 46, 52, 58, 65, 73, 81, 89, , 19, 23, 27, 32, 37, 42, 48, 54, 61, 68, , 8, 11, 14, 18, 21, 25, 30, 35, 40, 45, , 35, 41, 47, 53, 60, 67, 75, 83, 91, 100, , 23, 27, 32, 37, 43, 49, 55, 62, 69, 76, , 46, 47, 48, 49, 50, 51, 52, 53, 54, 55, , 361, 378, 396, 415, 434, 453, 473, 494, 514, 536, , 307, 322, 339, 355, 373, 390, 408, 427, 445, 465, , 246, 260, 274, 289, 304, 319, 335, 351, 368, 385, , 389, 407, 426, 446, 466, 486, 507, 429, 550, 573, , 328, 345, 362, 379, 397, 416, 434, 454, 473, 493, , 26, 27, 28, 29, 30, 31, 32, 33, 34, 35, , 98, 107, 116, 126, 137, 147, 159, 170, 182, 195, , 75, 83, 91, 100, 109, 118, 128, 138, 148, 159, , 51, 57, 64, 71, 78, 86, 94, 102, 111, 120, , 110, 119, 130, 140, 151, 163, 175, 187, 200, 213, , 84, 92, 101, 110, 120, 130, 140, 151, 162, 173, , 56, 57, 58, 59, 60, 61, 62, 63, 64, 65, , 557, 579, 602, 625, 648, 672, 697, 721, 747, 772, , 484, 504, 525, 546, 567, 589, 611, 634, 657, 681, , 402, 420, 438, 457, 476, 495, 515, 535, 556, 577, , 595, 618, 642, 666, 690, 715, 741, 767, 793, 820, , 514, 535, 556, 578, 600, 623, 646, 669, 693, 718, , Source: Sachs, 1972
Page 226 :
TABLES, Table 20, , 217, , Critical values of U for the Wilcoxon inversion test, , n1 = number of elements in the largest sample;, n2 = number of elements in the smallest sample., Level of significance α, Two-sided, One-sided, , 0.10, 0.05, , 0.05, 0.025, , 0.02, 0.01, , 0.01, 0.005, , n1, , n2, , 3, 4, 4, , 3, 3, 4, , 0, 0, 1, , –, –, 0, , –, –, –, , –, –, –, , 5, 5, 5, 5, , 2, 3, 4, 5, , 0, 1, 2, 4, , –, 0, 1, 2, , –, –, 0, 1, , –, –, –, 0, , 6, 6, 6, 6, 6, , 2, 3, 4, 5, 6, , 0, 2, 3, 5, 7, , –, 1, 2, 3, 5, , –, –, 1, 2, 3, , –, –, 0, 1, 2, , 7, 7, 7, 7, 7, 7, , 2, 3, 4, 5, 6, 7, , 0, 2, 4, 6, 8, 11, , –, 1, 3, 5, 6, 8, , –, 0, 1, 3, 4, 6, , –, –, 0, 1, 3, 4, , 8, 8, 8, 8, 8, 8, 8, , 2, 3, 4, 5, 6, 7, 8, , 1, 3, 5, 8, 10, 13, 15, , 0, 2, 4, 6, 8, 10, 13, , –, 0, 2, 4, 6, 7, 9, , –, –, 1, 2, 4, 6, 7, , Source: Wijvekate, 1962, , Level of significance α, Two-sided, One-sided, , 0.10, 0.05, , 0.05, 0.025, , 0.02, 0.01, , 0.01, 0.005, , n1, , n2, , 9, 9, 9, 9, 9, 9, 9, 9, , 2, 3, 4, 5, 6, 7, 8, 9, , 1, 4, 6, 9, 12, 15, 18, 21, , 0, 2, 4, 7, 10, 12, 15, 17, , –, 1, 3, 5, 7, 9, 12, 14, , –, 0, 1, 3, 5, 7, 9, 11, , 10, 10, 10, 10, 10, 10, 10, 10, 10, , 2, 3, 4, 5, 6, 7, 8, 9, 10, , 1, 4, 7, 11, 14, 17, 20, 24, 27, , 0, 3, 5, 8, 11, 14, 17, 20, 23, , 1, 3, 6, 8, 11, 13, 16, 19, , 0, 2, 4, 6, 9, 11, 13, 16
Page 227 :
218, , 100 STATISTICAL TESTS, , Table 21 Critical values of the smallest rank sum for the, Wilcoxon–Mann–Whitney test, n1 = number of elements in the largest sample;, n2 = number of elements in the smallest sample., Level of significance α, Two-sided, One-sided, n1, , 0.20, 0.10, , 0.10, 0.05, , 0.05, 0.025, , Level of significance α, , 0.01, 0.005, , n2, , Two-sided, One-sided, n1, , n2, , 0.20, 0.10, , 0.10, 0.05, , 0.05, 0.025, , 0.01, 0.005, , 3, 3, 4, 4, 4, , 2, 3, 2, 3, 4, , 3, 7, 3, 7, 13, , –, 6, –, 6, 11, , –, –, –, –, 10, , –, –, –, –, –, , 10, 10, 10, 10, 10, , 6, 7, 8, 9, 10, , 38, 49, 60, 73, 87, , 35, 45, 56, 69, 82, , 32, 42, 53, 65, 78, , 27, 37, 47, 58, 71, , 5, 5, 5, 5, , 2, 3, 4, 5, , 4, 8, 14, 20, , 3, 7, 12, 19, , –, 6, 11, 17, , –, –, –, 15, , 6, 6, 6, 6, 6, , 2, 3, 4, 5, 6, , 4, 9, 15, 22, 30, , 3, 8, 13, 20, 28, , –, 7, 12, 18, 26, , –, –, 10, 16, 13, , 11, 11, 11, 11, 11, 11, 11, 11, 11, 11, 11, , 1, 2, 3, 4, 5, 6, 7, 8, 9, 10, 11, , 1, 6, 13, 21, 30, 40, 51, 63, 76, 91, 106, , –, 4, 11, 18, 27, 37, 47, 59, 72, 86, 100, , –, 3, 9, 16, 24, 34, 44, 55, 68, 81, 96, , –, –, 6, 12, 20, 28, 38, 49, 61, 73, 87, , 7, 7, 7, 7, 7, 7, , 2, 3, 4, 5, 6, 7, , 4, 10, 16, 23, 32, 41, , 3, 8, 14, 21, 29, 39, , –, 7, 13, 20, 27, 36, , –, –, 10, 16, 24, 32, , 8, 8, 8, 8, 8, 8, 8, , 2, 3, 4, 5, 6, 7, 8, , 5, 11, 17, 25, 34, 44, 55, , 4, 9, 15, 23, 31, 41, 51, , 3, 8, 14, 21, 29, 38, 49, , –, –, 11, 17, 25, 34, 43, , 12, 12, 12, 12, 12, 12, 12, 12, 12, 12, 12, 12, , 1, 2, 3, 4, 5, 6, 7, 8, 9, 10, 11, 12, , 1, 7, 14, 22, 32, 42, 54, 66, 80, 94, 110, 127, , –, 5, 11, 19, 28, 38, 49, 62, 75, 89, 104, 120, , –, 4, 10, 17, 26, 35, 46, 58, 71, 84, 99, 115, , –, –, 7, 13, 21, 30, 40, 51, 63, 76, 90, 105, , 9, 9, 9, 9, 9, 9, 9, 9, 9, , 1, 2, 3, 4, 5, 6, 7, 8, 9, , 1, 5, 11, 19, 27, 36, 46, 58, 70, , –, 4, 9, 16, 24, 33, 43, 54, 66, , –, 3, 8, 14, 22, 31, 40, 51, 62, , –, –, 6, 11, 18, 26, 35, 45, 56, , 10, 10, 10, 10, 10, , 1, 2, 3, 4, 5, , 1, 6, 12, 20, 28, , –, 4, 10, 17, 26, , –, 3, 9, 15, 23, , –, –, 6, 12, 19, , 13, 13, 13, 13, 13, 13, 13, 13, 13, 13, 13, 13, 13, , 1, 2, 3, 4, 5, 6, 7, 8, 9, 10, 11, 12, 13, , –, 7, 15, 23, 33, 44, 56, 69, 83, 98, 114, 131, 149, , –, 5, 12, 20, 30, 40, 52, 64, 78, 92, 108, 125, 142, , –, 4, 10, 18, 27, 37, 48, 60, 73, 88, 103, 119, 136, , –, –, 7, 14, 22, 31, 44, 53, 65, 79, 93, 109, 125
Page 228 :
TABLES, Table 21, , 219, , continued, Level of significance α, , Two-sided, One-sided, n1, , 0.20, 0.10, , 0.10, 0.05, , 0.05, 0.025, , 0.01, 0.005, , n2, , Level of significance α, Two-sided, One-sided, n1, , n2, , 0.20, 0.10, , 0.10, 0.05, , 0.05, 0.025, , 0.01, 0.005, , 14, 14, 14, 14, 14, 14, 14, 14, 14, 14, 14, 14, 14, 14, , 1, 2, 3, 4, 5, 6, 7, 8, 9, 10, 11, 12, 13, 14, , 1, 7, 16, 25, 35, 46, 59, 72, 86, 102, 118, 136, 154, 174, , –, 5, 13, 21, 31, 42, 54, 67, 81, 96, 112, 129, 147, 166, , –, 4, 11, 19, 28, 38, 50, 62, 76, 91, 106, 123, 141, 160, , –, –, 7, 14, 22, 32, 43, 54, 67, 81, 96, 112, 129, 147, , 17, 17, 17, 17, 17, 17, 17, 17, 17, 17, 17, 17, 17, 17, , 4, 5, 6, 7, 8, 9, 10, 11, 12, 13, 14, 15, 16, 17, , 28, 40, 52, 66, 81, 97, 113, 131, 150, 170, 190, 212, 235, 259, , 25, 35, 47, 61, 75, 90, 106, 123, 142, 161, 182, 203, 225, 249, , 21, 32, 43, 56, 70, 84, 100, 117, 135, 154, 174, 195, 217, 240, , 16, 25, 36, 47, 60, 74, 89, 105, 122, 140, 159, 180, 201, 223, , 15, 15, 15, 15, 15, 15, 15, 15, 15, 15, 15, 15, 15, 15, 15, , 1, 2, 3, 4, 5, 6, 7, 8, 9, 10, 11, 12, 13, 14, 15, , 1, 8, 16, 26, 37, 48, 61, 75, 90, 106, 123, 141, 159, 179, 200, , –, 6, 13, 22, 33, 44, 56, 69, 84, 99, 116, 133, 152, 171, 192, , –, 4, 11, 20, 29, 40, 52, 65, 79, 94, 110, 127, 145, 164, 184, , –, –, 8, 15, 23, 33, 44, 56, 69, 84, 99, 115, 133, 151, 171, , 16, 16, 16, 16, 16, 16, 16, 16, 16, 16, 16, 16, 16, 16, 16, 16, , 1, 2, 3, 4, 5, 6, 7, 8, 9, 10, 11, 12, 13, 14, 15, 16, , 1, 8, 17, 27, 38, 50, 64, 78, 93, 109, 127, 145, 165, 185, 206, 229, , –, 6, 14, 24, 34, 46, 58, 72, 87, 103, 120, 138, 156, 176, 197, 219, , –, 4, 12, 21, 30, 42, 54, 67, 82, 97, 113, 131, 150, 169, 190, 211, , –, –, 8, 15, 24, 34, 46, 58, 72, 86, 102, 119, 130, 155, 175, 196, , 18, 18, 18, 18, 18, 18, 18, 18, 18, 18, 18, 18, 18, 18, 18, 18, 18, 18, , 1, 2, 3, 4, 5, 6, 7, 8, 9, 10, 11, 12, 13, 14, 15, 16, 17, 18, , 1, 9, 19, 30, 42, 55, 69, 84, 100, 117, 135, 155, 175, 196, 218, 242, 266, 291, , –, 7, 15, 26, 37, 49, 63, 77, 93, 110, 127, 146, 166, 187, 208, 231, 255, 280, , –, 5, 13, 22, 33, 45, 58, 72, 87, 103, 121, 139, 158, 179, 200, 222, 246, 270, , –, –, 8, 16, 26, 37, 49, 62, 76, 92, 108, 125, 144, 163, 184, 206, 228, 252, , 17, 17, 17, , 1, 2, 3, , 1, 9, 18, , –, 6, 15, , –, 5, 12, , –, –, 8, , 19, 19, 19, 19, 19, 19, 19, 19, 19, 19, 19, 19, 19, 19, 19, 19, , 1, 2, 3, 4, 5, 6, 7, 8, 9, 10, 11, 12, 13, 14, 15, 16, , 2, 10, 20, 31, 43, 57, 71, 87, 103, 121, 139, 159, 180, 202, 224, 248, , 1, 7, 16, 27, 38, 51, 65, 80, 96, 113, 131, 150, 171, 192, 214, 237, , –, 5, 13, 23, 34, 46, 60, 74, 90, 107, 124, 143, 163, 182, 205, 228, , –, 3, 9, 17, 27, 38, 50, 64, 78, 94, 111, 129, 147, 168, 189, 210, , Source: Natrella, 1963
Page 229 :
220, , 100 STATISTICAL TESTS, , Table 22 The Kruskal–Wallis test, Critical region: H ≥ tabulated value., K =3, , K =4, , K =5, , Sample, sizes, , α = 0.05, , α = 0.01, , Sample, sizes, , α = 0.05, , α = 0.01, , Sample, sizes, , α = 0.05, , α = 0.01, , 222, , –, , –, , 321, 322, 331, 332, 333, , –, 4.714, 5.143, 5.361, 5.600, , –, –, –, –, 7.200, , 2211, 2221, 2222, , –, 5.679, 6.167, , –, –, 6.667, , 22111, 22211, 22221, 22222, , –, 6.750, 7.133, 7.418, , –, –, 7.533, 8.291, , 421, 422, 431, 432, 433, 441, 442, 443, 444, , –, 5.333, 5.208, 5.444, 5.791, 4.967, 5.455, 5.598, 5.692, , –, –, –, 6.444, 6.745, 6.667, 7.036, 7.144, 7.654, , 3111, 3211, 3221, 3222, 3311, 3321, 3322, 3331, 3332, 3333, , –, –, 5.833, 6.333, 6.333, 6.244, 6.527, 6.600, 6.727, 7.000, , –, –, –, 7.133, –, 7.200, 7.636, 7.400, 8.015, 8.538, , 521, 522, 531, 532, 533, 541, 542, 543, 544, 551, 552, 553, 554, 555, , 5.000, 5.160, 4.960, 5.251, 5.648, 4.985, 5.273, 5.656, 5.657, 5.127, 5.338, 5.705, 5.666, 5.780, , –, 6.533, –, 6.909, 7.079, 6.955, 7.205, 7.445, 7.760, 7.309, 7.338, 7.578, 7.823, 8.000, –, –, 6.655, 6.873, 6.970, 7.410, 7.106, 7.340, 7.500, 7.795, 7.182, 7.376, 7.590, 7.936, 8.028, 7.121, 7.467, 7.725, 8.000, 8.124, 8.222, , –, –, 7.000, 7.391, 7.067, 7.455, 7.871, 7.758, 8.333, 8.659, 7.909, 7.909, 8.346, 8.231, 8.621, 8.876, 8.588, 8.871, 9.075, 9.287, , –, –, 7.600, 8.127, 8.682, –, 8.073, 8.576, 9.115, 8.424, 9.051, 9.505, 9.451, 9.876, 10.20, , –, 4.822, 5.345, 4.855, 5.348, 5.615, 4.947, 5.340, 5.610, 5.681, 4.990, 5.338, 5.602, 5.661, 5.729, 4.945, 5.410, 5.625, 5.724, 5.765, 5.801, , –, 5.833, 6.133, 6.545, 6.178, 6.309, 6.621, 6.545, 6.795, 6.984, 5.945, 6.386, 6.731, 6.635, 6.874, 7.038, 6.725, 6.957, 7.142, 7.235, , –, 6.583, 6.800, 7.309, 7.682, 7.111, 7.200, 7.591, 7.910, 7.576, 7.769, 8.044, 8.000, 8.200, 8.333, , 611, 621, 622, 631, 632, 633, 641, 642, 643, 644, 651, 652, 653, 654, 655, 661, 662, 663, 664, 665, 666, , 4111, 4211, 4221, 4222, 4311, 4321, 4322, 4331, 4332, 4333, 4411, 4421, 4422, 4431, 4432, 4433, 4441, 4442, 4443, 4444, , 31111, 32111, 32211, 32221, 32222, 33111, 33211, 33221, 33222, 33311, 33321, 33322, 33331, 33332, 33333, , 777, , 5.819, , 8.378, , 888, , 5.805, , 8.465, , Source: Neave, 1978
Page 230 :
TABLES, , 221, , Table 23 Critical values for the rank sum difference test, (two-sided), Level of significance α = 0.01, K, n, 1, 2, 3, 4, 5, , 3, 4.1, 10.9, 19.5, 29.7, 41.2, , 4, 5.7, 15.3, 27.5, 41.9, 58.2, , 5, 7.3, 19.7, 35.7, 54.5, 75.8, , 6, 8.9, 24.3, 44.0, 67.3, 93.6, , 7, 10.5, 28.9, 52.5, 80.3, 111.9, , 8, 12.2, 33.6, 61.1, 93.6, 130.4, , 9, 13.9, 38.3, 69.8, 107.0, 149.1, , 10, 15.6, 43.1, 78.6, 120.6, 168.1, , 6, 7, 8, 9, 10, , 53.9, 67.6, 82.4, 98.1, 114.7, , 76.3, 95.8, 116.8, 139.2, 162.8, , 99.3, 124.8, 152.2, 181.4, 212.2, , 122.8, 154.4, 188.4, 224.5, 262.7, , 146.7, 184.6, 225.2, 268.5, 314.2, , 171.0, 215.2, 262.6, 313.1, 366.5, , 195.7, 246.3, 300.6, 358.4, 419.5, , 220.6, 277.7, 339.0, 404.2, 473.1, , 11, 12, 13, 14, 15, , 132.1, 150.4, 169.4, 189.1, 209.6, , 187.6, 213.5, 240.6, 268.7, 297.8, , 244.6, 278.5, 313.8, 350.5, 388.5, , 302.9, 344.9, 388.7, 434.2, 481.3, , 362.2, 412.5, 464.9, 519.4, 575.8, , 422.6, 481.2, 542.4, 606.0, 671.9, , 483.7, 551.0, 621.0, 693.8, 769.3, , 545.6, 621.4, 700.5, 782.6, 867.7, , 16, 17, 18, 19, 20, , 230.7, 252.5, 275.0, 298.1, 321.8, , 327.9, 359.0, 391.0, 423.8, 457.6, , 427.9, 468.4, 510.2, 553.1, 597.2, , 530.1, 580.3, 632.1, 685.4, 740.0, , 634.2, 694.4, 756.4, 820.1, 885.5, , 740.0, 810.2, 882.6, 957.0, 1033.3, , 847.3, 927.8, 1010.6, 1095.8, 1183.3, , 955.7, 1046.5, 1140.0, 1236.2, 1334.9, , 21, 22, 23, 24, 25, , 346.1, 371.0, 396.4, 422.4, 449.0, , 492.2, 527.6, 563.8, 600.9, 638.7, , 642.4, 688.7, 736.0, 784.4, 833.8, , 796.0, 853.4, 912.1, 972.1, 1033.3, , 952.6, 1021.3, 1091.5, 1163.4, 1236.7, , 1111.6, 1191.8, 1273.8, 1357.6, 1443.2, , 1273.0, 1364.8, 1458.8, 1554.8, 1652.8, , 1436.0, 1539.7, 1645.7, 1754.0, 1864.6, , 8, , 9, , 10, , Level of significance α = 0.05, K, n, 1, 2, 3, 4, 5, 6, 7, 8, 9, 10, 11, 12, 13, , 3, , 4, , 5, , 3.3, 8.8, 15.7, 23.9, 33.1, , 4.7, 12.6, 22.7, 34.6, 48.1, , 43.3, 62.9, 54.4, 79.1, 66.3, 96.4, 7.89 114.8, 92.3 134.3, 106.3, 120.9, 136.2, , 154.8, 176.2, 198.5, , 6, , 7, , 6.1, 16.5, 29.9, 45.6, 63.5, , 7.5, 20.5, 37.3, 57.0, 79.3, , 9.0, 24.7, 44.8, 68.6, 95.5, , 10.5, 28.9, 52.5, 80.4, 112.0, , 12.0, 33.1, 60.3, 92.4, 128.8, , 13.5, 37.4, 68.2, 104.6, 145.8, , 83.2, 104.6, 127.6, 152.0, 177.8, , 104.0, 130.8, 159.6, 190.2, 222.6, , 125.3, 157.6, 192.4, 229.3, 268.4, , 147.0, 184.9, 225.7, 269.1, 315.0, , 169.1, 212.8, 259.7, 309.6, 362.4, , 191.4, 240.9, 294.1, 350.6, 410.5, , 205.0, 233.4, 263.0, , 256.6, 292.2, 329.3, , 309.4, 352.4, 397.1, , 363.2, 413.6, 466.2, , 417.9, 476.0, 536.5, , 473.3, 539.1, 607.7
Page 231 :
222, , 100 STATISTICAL TESTS, Table 23, , continued, Level of significance α = 0.05, , K, n, , 3, , 4, , 5, , 6, , 7, , 8, , 9, , 10, , 14, 15, , 152.1, 168.6, , 221.7, 245.7, , 293.8, 325.7, , 367.8, 407.8, , 443.6, 491.9, , 520.8, 577.4, , 599.4, 664.6, , 679.0, 752.8, , 16, 17, 18, 19, 20, , 185.6, 203.1, 221.2, 239.8, 258.8, , 270.6, 296.2, 322.6, 349.7, 377.6, , 358.6, 392.6, 427.6, 463.6, 500.5, , 449.1, 491.7, 535.5, 580.6, 626.9, , 541.7, 593.1, 646.1, 700.5, 756.4, , 635.9, 696.3, 758.5, 822.4, 888.1, , 732.0, 801.5, 873.1, 946.7, 1022.3, , 829.2, 907.9, 989.0, 1072.4, 1158.1, , 21, 22, 23, 24, 25, , 278.4, 298.4, 318.9, 339.8, 361.1, , 406.1, 435.3, 464.2, 495.8, 527.0, , 538.4, 577.2, 616.9, 657.4, 698.8, , 674.4, 723.0, 772.7, 823.5, 875.4, , 813.7, 872.3, 932.4, 993.7, 1056.3, , 955.4, 1024.3, 1094.8, 1166.8, 1240.4, , 1099.8, 1179.1, 1260.3, 1343.2, 1427.9, , 1245.9, 1335.7, 1427.7, 1521.7, 1616.6, , 8, , 9, , 10, , Level of significance α = 0.10, K, n, , 3, , 4, , 5, , 6, , 7, , 1, 2, 3, 4, 5, , 2.9, 7.6, 13.8, 20.9, 29.0, , 4.2, 11.2, 20.2, 30.9, 42.9, , 5.5, 14.9, 26.9, 41.2, 57.2, , 6.8, 18.7, 33.9, 51.8, 72.1, , 8.2, 22.5, 40.9, 62.6, 87.3, , 9.6, 26.5, 48.1, 73.8, 102.8, , 11.1, 30.5, 55.5, 85.1, 118.6, , 12.5, 34.5, 63.0, 96.5, 134.6, , 6, 7, 8, 9, 10, , 37.9, 47.6, 58.0, 69.1, 80.8, , 56.1, 70.5, 86.0, 102.4, 119.8, , 75.0, 94.3, 115.0, 137.0, 160.3, , 94.5, 118.8, 145.0, 172.8, 202.2, , 114.4, 144.0, 175.7, 209.4, 245.1, , 134.8, 169.6, 207.0, 246.8, 288.9, , 155.6, 195.8, 239.0, 284.9, 333.5, , 176.6, 222.3, 271.4, 323.6, 378.8, , 11, 12, 13, 14, 15, , 93.1, 105.9, 119.3, 133.2, 147.6, , 138.0, 157.1, 177.0, 197.7, 219.1, , 184.8, 210.4, 237.1, 264.8, 293.6, , 233.1, 265.4, 299.1, 334.1, 370.4, , 282.6, 321.8, 362.7, 405.1, 449.2, , 333.1, 379.3, 427.6, 477.7, 529.6, , 384.6, 438.0, 493.7, 551.6, 611.6, , 436.8, 497.5, 560.8, 626.6, 694.8, , 16, 17, 18, 19, 20, , 162.5, 177.9, 193.7, 210.0, 226.7, , 241.3, 264.2, 287.7, 311.9, 336.7, , 323.3, 353.9, 385.5, 417.9, 451.2, , 407.9, 446.6, 486.5, 527.5, 569.5, , 494.7, 541.6, 590.0, 639.7, 690.7, , 583.3, 638.7, 695.7, 754.3, 814.5, , 673.6, 737.6, 803.4, 871.2, 940.7, , 765.2, 837.9, 912.8, 989.7, 1068.8, , 21, 22, 23, 24, 25, , 243.8, 261.3, 279.2, 297.5, 316.2, , 362.2, 388.2, 414.9, 442.2, 470.0, , 485.4, 520.4, 556.1, 592.7, 630.0, , 612.6, 656.8, 702.0, 748.1, 795.3, , 743.0, 796.6, 851.4, 907.4, 964.6, , 876.2, 939.4, 1004.1, 1070.2, 1137.6, , 1012.0, 1085.0, 1159.7, 1236.0, 1314.0, , 1149.8, 1232.7, 1317.6, 1404.3, 1492.9, , Source: Sachs, 1972
Page 232 :
TABLES, Table 24, n, , 223, , Critical values for the rank sum maximum test, K, , Level of significance α, 0.10, , 0.05, , 0.01, , 3, 4, 5, 6, , 22, 30, 38, 46, , 23, 31, 39, 48, , 50, , 2, 3, 4, 5, 6, , 24, 37, 50, 63, 77, , 25, 38, 52, 66, 80, , 41, 55, 70, 85, , 73, 89, , 2, 3, 4, 5, 6, , 35, 55, 75, 95, 115, , 37, 57, 78, 98, 119, , 39, 61, 83, 105, 127, , 64, 87, 111, 134, , 2, 3, 4, 5, 6, , 49, 77, 104, 133, 161, , 51, 79, 108, 138, 167, , 54, 85, 115, 149, 180, , 90, 122, 161, 196, , 7, , 2, 3, 4, 5, 6, , 65, 102, 138, 176, 213, , 68, 105, 144, 182, 221, , 72, 112, 154, 196, 237, , 76, 119, 167, 212, 257, , 8, , 2, 3, 4, 5, 6, , 84, 130, 177, 225, 273, , 87, 135, 183, 233, 282, , 92, 144, 197, 249, 302, , 97, 156, 212, 269, 326, , 3, , 4, , 5, , 6, , Source: Sachs, 1970, , 0.001
Page 233 :
224, , 100 STATISTICAL TESTS, Table 25, , Critical values for the Steel test, One-sided testing, Number of samples K, , n, , α, , 2, , 3, , 4, , 5, , 6, , 7, , 8, , 9, , 4, , 0.05, 0.01, 0.05, 0.01, , 11, –, 18, 15, , 10, –, 17, –, , 10, –, 17, –, , 10, –, 16, –, , 10, –, 16, –, , –, –, 16, –, , –, –, 16, –, , –, 15, –, , 0.05, 0.01, 0.05, 0.01, 0.05, 0.01, 0.05, 0.01, 0.05, 0.01, , 27, 23, 37, 32, 49, 43, 63, 56, 79, 71, , 26, 22, 36, 31, 48, 42, 62, 55, 77, 69, , 25, 21, 35, 30, 47, 41, 61, 54, 76, 68, , 25, 21, 35, 30, 46, 40, 60, 53, 75, 67, , 24, –, 34, 29, 46, 40, 59, 52, 74, 66, , 24, –, 34, 29, 45, 40, 59, 52, 74, 66, , 24, –, 33, 29, 45, 39, 58, 51, 73, 65, , 23, –, 33, 29, 44, 39, 58, 51, 72, 65, , 0.05, 0.01, 0.05, 0.01, 0.05, 0.01, 0.05, 0.01, 0.05, 0.01, , 97, 87, 116, 105, 138, 125, 161, 147, 186, 170, , 95, 85, 114, 103, 135, 123, 158, 144, 182, 167, , 93, 84, 112, 102, 133, 121, 155, 142, 180, 165, , 92, 83, 111, 100, 132, 120, 154, 141, 178, 164, , 91, 82, 110, 99, 130, 119, 153, 140, 177, 162, , 90, 81, 109, 99, 129, 118, 152, 139, 176, 161, , 90, 81, 108, 98, 129, 117, 151, 138, 175, 160, , 89, 80, 108, 98, 128, 117, 150, 137, 174, 160, , 0.05, 0.01, 0.05, 0.01, 0.05, 0.01, 0.05, 0.01, 0.05, 0.01, , 213, 196, 241, 223, 272, 252, 304, 282, 339, 315, , 209, 192, 237, 219, 267, 248, 299, 278, 333, 310, , 206, 190, 234, 217, 264, 245, 296, 275, 330, 307, , 204, 188, 232, 215, 262, 243, 294, 273, 327, 305, , 203, 187, 231, 213, 260, 241, 292, 271, 325, 303, , 201, 186, 229, 212, 259, 240, 290, 270, 323, 301, , 200, 185, 228, 211, 257, 239, 288, 268, 322, 300, , 199, 184, 227, 210, 256, 238, 287, 267, 320, 299, , 5, 6, 7, 8, 9, 10, 11, 12, 13, 14, 15, 16, 17, 18, 19, 20
Page 234 :
TABLES, Table 25, , 225, , continued, Two-sided testing, Number of samples K, , n, , α, , 2, , 3, , 4, , 5, , 6, , 7, , 8, , 9, , 4, , 0.05, 0.01, 0.05, 0.01, , 10, –, 16, –, , –, –, 16, –, , –, –, 16, –, , –, –, 15, –, , –, –, –, –, , –, –, –, –, , –, –, –, –, , –, –, –, –, , 0.05, 0.01, 0.05, 0.01, 0.05, 0.01, 0.05, 0.01, 0.05, 0.01, , 25, 21, 35, 30, 46, 41, 60, 53, 75, 68, , 24, –, 33, 29, 45, 40, 58, 52, 73, 66, , 23, –, 33, 28, 44, 39, 57, 51, 72, 65, , 23, –, 32, 28, 43, 38, 56, 50, 71, 64, , 22, –, 32, –, 43, 38, 55, 49, 70, 63, , 22, –, 31, –, 42, 37, 55, 49, 69, 62, , 22, –, 31, –, 42, 37, 54, 49, 69, 62, , 21, –, 30, –, 41, 37, 54, 48, 68, 62, , 0.05, 0.01, 0.05, 0.01, 0.05, 0.01, 0.05, 0.01, 0.05, 0.01, , 92, 84, 111, 101, 132, 121, 154, 142, 179, 165, , 90, 82, 108, 99, 129, 118, 151, 139, 175, 162, , 88, 80, 107, 97, 127, 116, 149, 137, 172, 159, , 87, 79, 105, 96, 125, 115, 147, 135, 171, 158, , 86, 78, 104, 95, 124, 114, 145, 134, 169, 156, , 85, 78, 103, 94, 123, 113, 144, 133, 168, 155, , 85, 77, 103, 94, 122, 112, 144, 132, 167, 154, , 84, 77, 102, 93, 121, 112, 143, 132, 166, 154, , 0.05, 0.01, 0.05, 0.01, 0.05, 0.01, 0.05, 0.01, 0.05, 0.01, , 205, 189, 233, 216, 263, 244, 294, 274, 328, 306, , 201, 186, 228, 212, 258, 240, 289, 270, 322, 302, , 196, 184, 225, 210, 254, 237, 285, 267, 318, 298, , 196, 182, 223, 208, 252, 235, 283, 265, 315, 296, , 194, 180, 221, 206, 250, 233, 280, 262, 313, 293, , 193, 179, 219, 205, 248, 232, 279, 261, 311, 292, , 192, 178, 218, 204, 247, 231, 277, 260, 309, 290, , 191, 177, 217, 203, 246, 230, 276, 259, 308, 289, , 5, 6, 7, 8, 9, 10, 11, 12, 13, 14, 15, 16, 17, 18, 19, 20, , Source: De Jonge, 1963–4
Page 235 :
226, , 100 STATISTICAL TESTS, Table 26 Critical values of rs for the Spearman, rank correlation test, n, , Level of significance α, 0.001, , 0.005, , 0.010, , 0.025, , 0.050, , 0.100, , 4, 5, , –, –, , –, –, , –, 0.9000, , –, 0.9000, , 0.8000, 0.8000, , 0.8000, 0.7000, , 6, 7, 8, 9, 10, , –, 0.9643, 0.9286, 0.9000, 0.8667, , 0.9429, 0.8929, 0.8571, 0.8167, 0.7818, , 0.8857, 0.8571, 0.8095, 0.7667, 0.7333, , 0.8286, 0.7450, 0.6905, 0.6833, 0.6364, , 0.7714, 0.6786, 0.5952, 0.5833, 0.5515, , 0.6000, 0.5357, 0.4762, 0.4667, 0.4424, , 11, 12, 13, 14, 15, , 0.8455, 0.8182, 0.7912, 0.7670, 0.7464, , 0.7545, 0.7273, 0.6978, 0.6747, 0.6536, , 0.7000, 0.6713, 0.6429, 0.6220, 0.6000, , 0.6091, 0.5804, 0.5549, 0.5341, 0.5179, , 0.5273, 0.4965, 0.4780, 0.4593, 0.4429, , 0.4182, 0.3986, 0.3791, 0.3626, 0.3500, , 16, 17, 18, 19, 20, , 0.7265, 0.7083, 0.6904, 0.6737, 0.6586, , 0.6324, 0.6152, 0.5975, 0.5825, 0.5684, , 0.5824, 0.5637, 0.5480, 0.5333, 0.5203, , 0.5000, 0.4853, 0.4716, 0.4579, 0.4451, , 0.4265, 0.4118, 0.3994, 0.3895, 0.3789, , 0.3382, 0.3260, 0.3148, 0.3070, 0.2977, , 21, 22, 23, 24, 25, , 0.6455, 0.6318, 0.6186, 0.6070, 0.5962, , 0.5545, 0.5426, 0.5306, 0.5200, 0.5100, , 0.5078, 0.4963, 0.4852, 0.4748, 0.4654, , 0.4351, 0.4241, 0.4150, 0.4061, 0.3977, , 0.3688, 0.3597, 0.3518, 0.3435, 0.3362, , 0.2909, 0.2829, 0.2767, 0.2704, 0.2646, , 26, 27, 28, 29, 30, , 0.5856, 0.5757, 0.5660, 0.5567, 0.5479, , 0.5002, 0.4915, 0.4828, 0.4744, 0.4665, , 0.4564, 0.4481, 0.4401, 0.4320, 0.4251, , 0.3894, 0.3822, 0.3749, 0.3685, 0.3620, , 0.3299, 0.3236, 0.3175, 0.3113, 0.3059, , 0.2588, 0.2540, 0.2490, 0.2443, 0.2400, , Source: Sachs, 1972
Page 236 :
TABLES, , 227, , Table 27 Critical values of S for the Kendall rank, correlation test, Level of significance α, Two-sided, One-sided, n, , 0.10, 0.05, , 0.05, 0.025, , 0.02, 0.01, , 0.05, 0.005, , 4, 5, , 6, 8, , –, 10, , 10, , –, –, , 6, 7, 8, 9, 10, , 11, 13, 16, 18, 21, , 13, 15, 18, 20, 23, , 13, 17, 20, 24, 27, , 15, 19, 22, 26, 29, , 11, 12, 13, 14, 15, , 23, 26, 28, 33, 35, , 27, 30, 34, 37, 41, , 31, 36, 40, 43, 49, , 33, 38, 44, 47, 53, , 16, 17, 18, 19, 20, , 38, 42, 45, 49, 52, , 46, 50, 53, 57, 62, , 52, 58, 63, 67, 72, , 58, 64, 69, 75, 80, , 21, 22, 23, 24, 25, , 56, 61, 65, 68, 72, , 66, 71, 75, 80, 86, , 78, 83, 89, 94, 100, , 86, 91, 99, 104, 110, , 26, 27, 28, 29, 30, , 77, 81, 86, 90, 95, , 91, 95, 100, 106, 111, , 107, 113, 118, 126, 131, , 117, 125, 130, 138, 145, , 31, 32, 33, 34, 35, , 99, 104, 108, 113, 117, , 117, 122, 128, 133, 139, , 137, 144, 152, 157, 165, , 151, 160, 166, 175, 181, , 36, 37, 38, 39, 40, , 122, 128, 133, 139, 144, , 146, 152, 157, 163, 170, , 172, 178, 185, 193, 200, , 190, 198, 205, 213, 222, , Source: De Jonge, 1963–4
Page 237 :
228, , 100 STATISTICAL TESTS, Table 28, , Critical values of D for the adjacency test, , Columns a denote the lower boundaries or the left-sided critical values., Columns b denote the upper boundaries or the right-sided critical values., Level of significance α, Two-sided, One-sided, , 0.10, 0.05, , 0.02, 0.01, , n, , a, , b, , a, , b, , 4, 5, , 0.78, 0.82, , 3.22, 3.18, , 0.63, 0.54, , 3.37, 3.46, , 6, 7, 8, 9, 10, , 0.89, 0.94, 0.98, 1.02, 1.06, , 3.11, 3.06, 3.02, 2.98, 2.94, , 0.56, 0.61, 0.66, 0.71, 0.75, , 3.44, 3.39, 3.34, 3.29, 3.25, , 11, 12, 15, 20, 25, , 1.10, 1.13, 1.21, 1.30, 1.37, , 2.90, 2.87, 2.79, 2.70, 2.63, , 0.79, 0.83, 0.92, 1.04, 1.13, , 3.21, 3.17, 3.08, 2.96, 2.87, , Source: Hart, 1942, , Table 29, , Critical values of r for the serial correlation test, , Columns a denote the lower boundaries or the left-sided critical values., Columns b denote the upper boundaries or the right-sided critical values., Level of significance α, Two-sided, One-sided, , 0.10, 0.05, , 0.02, 0.01, , n, , a, , b, , a, , b, , 5, 6, 7, 8, 9, 10, , −0.753, −0.708, −0.674, −0.625, −0.593, −0.564, , 0.253, 0.345, 0.370, 0.371, 0.366, 0.360, , −0.798, −0.863, −0.799, −0.764, −0.737, −0.705, , 0.297, 0.447, 0.510, 0.531, 0.533, 0.525, , 11, 12, 13, 14, 15, , −0.539, −0.516, −0.497, −0.479, −0.462, , 0.353, 0.348, 0.341, 0.335, 0.328, , −0.679, −0.655, −0.634, −0.615, −0.597, , 0.515, 0.505, 0.495, 0.485, 0.475, , 20, 25, 30, , −0.399, −0.356, −0.325, , 0.328 −0.524, 0.276 −0.473, 0.257 −0.433, , 0.432, 0.398, 0.370, , Source: Anderson, 1942
Page 238 :
TABLES, , 229, , Table 30 Critical values for the run test on successive, differences, Columns a denote the lower boundaries or the left-sided critical values., Columns b denote the upper boundaries or the right-sided critical values., Level of significance α, Two-sided, One-sided, , 0.02, 0.01, , 0.10, 0.05, , n, , a, , b, , 5, 6, 7, 8, 9, 10, , –, 1, 1, 2, 2, 3, , –, –, –, –, –, –, , 1, 1, 2, 2, 3, 3, , –, –, –, –, 8, 9, , 11, 12, 13, 14, 15, , 3, 4, 4, 5, 5, , –, –, –, 13, 14, , 4, 4, 5, 6, 6, , 10, 11, 12, 12, 13, , 16, 17, 18, 19, 20, , 6, 6, 7, 7, 8, , 15, 16, 17, 17, 18, , 7, 7, 8, 8, 9, , 14, 15, 15, 16, 17, , 21, 22, 23, 24, 25, , 8, 9, 10, 10, 11, , 19, 20, 21, 21, 22, , 10, 10, 11, 11, 12, , 18, 18, 19, 20, 21, , 26, 27, 28, 29, 30, , 11, 12, 12, 13, 13, , 23, 24, 24, 25, 26, , 13, 13, 14, 14, 15, , 21, 22, 23, 24, 24, , 31, 32, 33, 34, 35, , 14, 15, 15, 16, 16, , 27, 27, 28, 29, 30, , 16, 16, 17, 17, 18, , 25, 26, 27, 27, 28, , 36, 37, 38, 39, 40, , 17, 18, 18, 19, 19, , 30, 31, 32, 33, 33, , 19, 19, 20, 20, 21, , 29, 29, 30, 31, 32, , Source: De Jonge, 1963–4, , a, , b
Page 239 :
230, , 100 STATISTICAL TESTS, Table 31, , Critical values for the run test (equal sample sizes), , Columns a denote the lower boundaries or the left-sided critical values., Columns b denote the upper boundaries or the right-sided critical values., Level of significance α, Two-sided, One-sided, n1 = n2, 5, 6, 7, 8, 9, 10, 11, 12, 13, 14, 15, 16, 17, 18, 19, 20, 21, 22, 23, 24, 25, 26, 27, 28, 29, 30, 35, 40, 45, 50, 55, 60, 65, 70, 75, 80, 85, 90, 95, 100, , 0.10, 0.05, , 0.05, 0.025, , a, , b, , 3, 3, 4, 5, 6, 6, 7, 8, 9, 10, 11, 11, 12, 13, 14, 15, 16, 17, 17, 18, 19, 20, 21, 22, 23, 24, 28, 33, 37, 42, 46, 51, 56, 60, 65, 70, 74, 79, 84, 88, , 9, 11, 12, 13, 14, 16, 17, 18, 19, 20, 21, 23, 24, 25, 26, 27, 28, 29, 31, 32, 33, 34, 35, 36, 37, 38, 43, 48, 54, 59, 65, 70, 75, 81, 86, 91, 97, 102, 107, 117, , Source: Dixon and Massey, 1957, , a, , 0.02, 0.01, b, , 7, 7, 8, 9, 10, 11, 11, 12, 13, 14, , 16, 18, 19, 20, 21, 22, 24, 25, 26, 27, , 18, , 33, , 22, 27, 31, 36, 40, 45, 49, 54, 58, 63, 68, 72, 77, 82, 80, , 39, 44, 50, 55, 61, 66, 72, 77, 83, 88, 93, 99, 104, 109, 115, , 0.01, 0.005, , a, , b, , 2, 2, 3, 4, 4, 5, 6, 7, 7, 8, 9, 10, 10, 11, 12, 13, 14, 14, 15, 16, 17, 18, 19, 19, 20, 21, 25, 30, 34, 38, 43, 47, 52, 56, 61, 65, 70, 74, 79, 84, , 10, 12, 13, 14, 16, 17, 18, 19, 21, 22, 23, 24, 26, 27, 28, 29, 30, 32, 33, 34, 35, 36, 37, 39, 40, 41, 46, 51, 57, 63, 68, 74, 79, 85, 90, 96, 101, 107, 112, 113, , a, , b, , 5, 6, 7, 7, 8, 9, 10, 10, 11, 12, , 18, 19, 20, 22, 23, 24, 25, 27, 28, 29, , 16, , 35, , 20, 24, 29, 33, 37, 42, 46, 50, 55, 59, 64, 68, 73, 77, 82, , 41, 47, 52, 58, 64, 69, 75, 81, 86, 92, 97, 103, 108, 114, 119
Page 240 :
TABLES, , 231, , Table 32 Critical values for the Wilcoxon–Wilcox, test (two-sided), Level of significance α = 0.01, K, n, , 3, , 4, , 5, , 6, , 7, , 8, , 9, , 10, , 1, 2, 3, 4, 5, , 4.1, 5.8, 7.1, 8.2, 9.2, , 5.7, 8.0, 9.8, 11.4, 12.7, , 7.3, 10.3, 12.6, 14.6, 16.3, , 8.9, 12.6, 15.4, 17.8, 19.9, , 10.5, 14.9, 18.3, 21.1, 23.6, , 12.2, 17.3, 21.2, 24.4, 27.3, , 13.9, 19.7, 24.1, 27.8, 31.1, , 15.6, 22.1, 27.0, 31.2, 34.9, , 6, 7, 8, 9, 10, , 10.1, 10.9, 11.7, 12.4, 13.0, , 13.9, 15.0, 16.1, 17.1, 18.0, , 17.8, 19.3, 20.6, 21.8, 23.0, , 21.8, 23.5, 25.2, 26.7, 28.1, , 25.8, 27.9, 29.8, 31.6, 33.4, , 29.9, 32.3, 34.6, 36.6, 38.6, , 34.1, 36.8, 39.3, 41.7, 44.0, , 38.2, 41.3, 44.2, 46.8, 49.4, , 11, 12, 13, 14, 15, , 13.7, 14.3, 14.9, 15.4, 16.0, , 18.9, 19.7, 20.5, 21.3, 22.0, , 24.1, 25.2, 26.2, 27.2, 28.2, , 29.5, 30.8, 32.1, 33.3, 34.5, , 35.0, 36.5, 38.0, 39.5, 40.8, , 40.5, 42.3, 44.0, 45.7, 47.3, , 46.1, 48.2, 50.1, 52.0, 53.9, , 51.8, 54.1, 56.3, 58.4, 60.5, , 16, 17, 18, 19, 20, , 16.5, 17.0, 17.5, 18.0, 18.4, , 22.7, 23.4, 24.1, 24.8, 25.4, , 29.1, 30.0, 30.9, 31.7, 32.5, , 35.6, 36.7, 37.8, 38.8, 39.8, , 42.2, 43.5, 44.7, 46.0, 47.2, , 48.9, 50.4, 51.8, 53.2, 54.6, , 55.6, 57.3, 59.0, 60.6, 62.2, , 62.5, 64.4, 66.2, 68.1, 69.8, , 21, 22, 23, 24, 25, , 18.9, 19.3, 19.8, 20.2, 20.6, , 26.0, 26.7, 27.3, 27.8, 28.4, , 33.4, 34.1, 34.9, 35.7, 36.4, , 40.9, 41.7, 42.7, 43.6, 44.5, , 48.3, 49.5, 50.6, 51.7, 52.7, , 56.0, 57.3, 58.6, 59.8, 61.1, , 63.7, 65.2, 66.7, 68.1, 69.5, , 71.6, 73.2, 74.9, 76.5, 78.1, , Level of significance α = 0.05, K, n, , 3, , 4, , 5, , 6, , 7, , 8, , 9, , 10, , 1, 2, 3, 4, 5, , 3.3, 4.7, 5.7, 6.6, 7.4, , 4.7, 6.6, 8.1, 9.4, 10.5, , 6.1, 8.6, 10.6, 12.2, 13.6, , 7.5, 10.7, 13.1, 15.1, 16.9, , 9.0, 12.7, 15.6, 18.0, 20.1, , 10.5, 14.8, 18.2, 21.0, 23.5, , 12.0, 17.0, 20.8, 24.0, 26.9, , 13.5, 19.2, 23.5, 27.1, 30.3, , 6, 7, 8, 9, 10, , 8.1, 8.8, 9.4, 9.9, 10.5, , 11.5, 12.4, 13.3, 14.1, 14.8, , 14.9, 16.1, 17.3, 18.3, 19.3, , 18.5, 19.9, 21.3, 22.6, 23.8, , 22.1, 23.9, 25.5, 27.0, 28.5, , 25.7, 27.8, 29.7, 31.5, 33.2, , 29.4, 31.8, 34.0, 36.0, 38.0, , 33.2, 35.8, 38.3, 40.6, 42.8, , 11, 12, 13, 14, 15, , 11.0, 11.5, 11.9, 12.4, 12.8, , 15.6, 16.2, 16.9, 17.5, 18.2, , 20.2, 21.1, 22.0, 22.8, 23.6, , 25.0, 26.1, 27.2, 28.2, 29.2, , 29.9, 31.2, 32.5, 33.7, 34.9, , 34.8, 36.4, 37.9, 39.3, 40.7, , 39.8, 41.6, 43.3, 45.0, 46.5, , 44.9, 46.9, 48.8, 50.7, 52.5
Page 241 :
232, , 100 STATISTICAL TESTS, Table 32, , continued, Level of significance α = 0.05, , K, n, , 3, , 4, , 5, , 6, , 7, , 8, , 9, , 10, , 16, 17, 18, 19, 20, , 13.3, 13.7, 14.1, 14.4, 14.8, , 18.8, 19.3, 19.9, 20.4, 21.0, , 24.4, 25.2, 25.9, 26.6, 27.3, , 30.2, 31.1, 32.0, 32.9, 33.7, , 36.0, 37.1, 38.2, 39.3, 40.3, , 42.0, 43.3, 44.5, 45.8, 47.0, , 48.1, 49.5, 51.0, 52.4, 53.7, , 54.2, 55.9, 57.5, 59.0, 60.6, , 21, 22, 23, 24, 25, , 15.2, 15.5, 15.9, 16.2, 16.6, , 21.5, 22.0, 22.5, 23.0, 23.5, , 28.0, 28.6, 29.3, 29.9, 30.5, , 34.6, 35.4, 36.2, 36.9, 37.7, , 41.3, 42.3, 43.2, 44.1, 45.0, , 48.1, 49.2, 50.3, 51.4, 52.5, , 55.1, 56.4, 57.6, 58.9, 60.1, , 62.1, 63.5, 65.0, 66.4, 67.7, , Level of significance α = 0.10, K, n, , 3, , 4, , 5, , 6, , 7, , 8, , 9, , 10, , 1, 2, 3, 4, 5, , 2.9, 4.1, 5.0, 5.8, 6.5, , 4.2, 5.9, 7.2, 8.4, 9.4, , 5.5, 7.8, 9.5, 11.0, 12.3, , 6.8, 9.7, 11.9, 13.7, 15.3, , 8.2, 11.6, 14.2, 16.5, 18.4, , 9.6, 13.6, 16.7, 19.3, 21.5, , 11.1, 15.6, 19.1, 22.1, 24.7, , 12.5, 17.7, 21.7, 25.0, 28.0, , 6, 7, 8, 9, 10, , 7.1, 7.7, 8.2, 8.7, 9.2, , 10.2, 11.1, 11.8, 12.5, 13.2, , 13.5, 14.5, 15.6, 16.5, 17.4, , 16.8, 18.1, 19.4, 20.5, 21.7, , 20.2, 21.8, 23.3, 24.7, 26.0, , 23.6, 25.5, 27.2, 28.9, 30.4, , 27.1, 29.3, 31.3, 33.2, 35.0, , 30.6, 33.1, 35.4, 37.5, 39.5, , 11, 12, 13, 14, 15, , 9.6, 10.1, 10.5, 10.9, 11.2, , 13.9, 14.5, 15.1, 15.7, 16.2, , 18.2, 19.0, 19.8, 20.6, 21.3, , 22.7, 23.7, 24.7, 25.6, 26.5, , 27.3, 28.5, 29.7, 30.8, 31.9, , 31.9, 33.4, 34.7, 36.0, 37.3, , 36.7, 38.3, 39.9, 41.4, 42.8, , 41.5, 43.3, 45.1, 46.8, 48.4, , 16, 17, 18, 19, 20, , 11.6, 12.0, 12.3, 12.6, 13.0, , 16.7, 17.2, 17.7, 18.2, 18.7, , 22.0, 22.7, 23.3, 24.0, 24.6, , 27.4, 28.2, 29.1, 29.9, 30.6, , 32.9, 33.9, 34.9, 35.9, 36.8, , 38.5, 39.7, 40.9, 42.0, 43.1, , 44.2, 45.6, 46.9, 48.2, 49.4, , 50.0, 51.5, 53.0, 54.5, 55.9, , 21, 22, 23, 24, 25, , 13.3, 13.6, 13.9, 14.2, 14.5, , 19.2, 19.6, 20.1, 20.5, 20.9, , 25.2, 25.8, 26.4, 26.9, 27.5, , 31.4, 32.1, 32.8, 33.6, 34.2, , 37.7, 38.6, 39.5, 40.3, 41.1, , 44.1, 45.2, 46.2, 47.2, 48.1, , 50.7, 51.9, 53.0, 54.2, 55.3, , 57.3, 58.6, 60.0, 61.2, 62.5, , Source: Sachs, 1972
Page 242 :
TABLES, Table 33, , 233, , Durbin–Watson test bounds, , dL denotes the lower boundary or left-sided critical values., dU denotes the upper boundary or right-sided critical values., Example: for n = 20, α = 0.01, and two independent variables,, dL = 0.86 and dU = 1.27., Level of significance α = 0.05, Number of independent variables ( p − 1), 1, , 2, , 3, , 4, , 5, , dL, , dU, , dL, , dU, , dL, , dU, , dL, , dU, , dL, , dU, , 15, 16, 17, 18, 19, 20, , 1.08, 1.10, 1.13, 1.16, 1.18, 1.20, , 1.36, 1.37, 1.38, 1.39, 1.40, 1.41, , 0.95, 0.98, 1.02, 1.05, 1.08, 1.10, , 1.54, 1.54, 1.54, 1.53, 1.53, 1.54, , 0.82, 0.86, 0.90, 0.93, 0.97, 1.00, , 1.75, 1.73, 1.71, 1.69, 1.68, 1.68, , 0.69, 0.74, 0.78, 0.82, 0.86, 0.90, , 1.97, 1.93, 1.90, 1.87, 1.85, 1.83, , 0.56, 0.62, 0.67, 0.71, 0.75, 0.79, , 2.21, 2.15, 2.10, 2.06, 2.02, 1.99, , 21, 22, 23, 24, 25, , 1.22, 1.24, 1.26, 1.27, 1.29, , 1.42, 1.43, 1.44, 1.45, 1.45, , 1.13, 1.15, 1.17, 1.19, 1.21, , 1.54, 1.54, 1.54, 1.55, 1.55, , 1.03, 1.05, 1.08, 1.10, 1.12, , 1.67, 1.66, 1.66, 1.66, 1.66, , 0.93, 0.96, 0.99, 1.01, 1.04, , 1.81, 1.80, 1.79, 1.78, 1.77, , 0.83, 0.86, 0.90, 0.93, 0.95, , 1.96, 1.94, 1.92, 1.90, 1.89, , 26, 27, 28, 29, 30, , 1.30, 1.32, 1.33, 1.34, 1.35, , 1.46, 1.47, 1.48, 1.48, 1.49, , 1.22, 1.24, 1.26, 1.27, 1.28, , 1.55, 1.56, 1.56, 1.56, 1.57, , 1.14, 1.16, 1.18, 1.20, 1.21, , 1.65, 1.65, 1.65, 1.65, 1.65, , 1.06, 1.08, 1.10, 1.12, 1.14, , 1.76, 1.76, 1.75, 1.74, 1.74, , 0.98, 1.01, 1.03, 1.05, 1.07, , 1.88, 1.86, 1.85, 1.84, 1.83, , 31, 32, 33, 34, 35, , 1.36, 1.37, 1.38, 1.39, 1.40, , 1.50, 1.50, 1.51, 1.51, 1.52, , 1.30, 1.31, 1.32, 1.33, 1.34, , 1.57, 1.57, 1.58, 1.58, 1.58, , 1.23, 1.24, 1.26, 1.27, 1.28, , 1.65, 1.65, 1.65, 1.65, 1.65, , 1.16, 1.18, 1.19, 1.21, 1.22, , 1.74, 1.73, 1.73, 1.73, 1.73, , 1.09, 1.11, 1.13, 1.15, 1.16, , 1.83, 1.82, 1.81, 1.81, 1.80, , 36, 37, 38, 39, 40, , 1.41, 1.42, 1.43, 1.43, 1.44, , 1.52, 1.53, 1.54, 1.54, 1.54, , 1.35, 1.36, 1.37, 1.38, 1.39, , 1.59, 1.59, 1.59, 1.60, 1.60, , 1.29, 1.31, 1.32, 1.33, 1.34, , 1.65, 1.66, 1.66, 1.66, 1.66, , 1.24, 1.25, 1.26, 1.27, 1.27, , 1.73, 1.72, 1.72, 1.72, 1.72, , 1.18, 1.19, 1.21, 1.22, 1.23, , 1.80, 1.80, 1.79, 1.79, 1.79, , 45, 50, 55, 60, 65, , 1.48, 1.50, 1.53, 1.55, 1.57, , 1.57, 1.59, 1.60, 1.62, 1.63, , 1.43, 1.46, 1.49, 1.51, 1.54, , 1.62, 1.63, 1.64, 1.65, 1.66, , 1.38, 1.42, 1.45, 1.48, 1.50, , 1.67, 1.67, 1.68, 1.69, 1.70, , 1.34, 1.38, 1.41, 1.44, 1.47, , 1.72, 1.72, 1.72, 1.73, 1.73, , 1.29, 1.34, 1.38, 1.41, 1.44, , 1.78, 1.77, 1.77, 1.77, 1.77, , 70, 75, 80, 85, 90, , 1.58, 1.60, 1.61, 1.62, 1.63, , 1.64, 1.65, 1.66, 1.67, 1.68, , 1.55, 1.57, 1.59, 1.60, 1.61, , 1.67, 1.68, 1.69, 1.70, 1.70, , 1.52, 1.54, 1.56, 1.57, 1.59, , 1.70, 1.71, 1.72, 1.72, 1.73, , 1.49, 1.51, 1.53, 1.55, 1.57, , 1.74, 1.74, 1.74, 1.75, 1.75, , 1.46, 1.49, 1.51, 1.52, 1.54, , 1.77, 1.77, 1.77, 1.77, 1.78, , 95, 100, , 1.64, 1.65, , 1.69, 1.69, , 1.62, 1.63, , 1.71, 1.72, , 1.60, 1.61, , 1.73, 1.74, , 1.58, 1.59, , 1.75, 1.76, , 1.56, 1.57, , 1.78, 1.78, , n
Page 243 :
234, , 100 STATISTICAL TESTS, Table 33, , continued, Level of significance α = 0.01, Number of independent variables ( p − 1), 1, , 2, , 3, , 4, , 5, , dL, , dU, , dL, , dU, , dL, , dU, , dL, , dU, , dL, , dU, , 15, 16, 17, 18, 19, 20, , 0.81, 0.84, 0.87, 0.90, 0.93, 0.95, , 1.07, 1.09, 1.10, 1.12, 1.13, 1.15, , 0.70, 0.74, 0.77, 0.80, 0.83, 0.86, , 1.25, 1.25, 1.25, 1.26, 1.26, 1.27, , 0.59, 0.63, 0.67, 0.71, 0.74, 0.77, , 1.46, 1.44, 1.43, 1.42, 1.41, 1.41, , 0.49, 0.53, 0.57, 0.61, 0.65, 0.68, , 1.70, 1.66, 1.63, 1.60, 1.58, 1.57, , 0.39, 0.44, 0.48, 0.52, 0.56, 0.60, , 1.96, 1.90, 1.85, 1.80, 1.77, 1.74, , 21, 22, 23, 24, 25, , 0.97, 1.00, 1.02, 1.04, 1.05, , 1.16, 1.17, 1.19, 1.20, 1.21, , 0.89, 0.91, 0.94, 0.96, 0.98, , 1.27, 1.28, 1.29, 1.30, 1.30, , 0.80, 0.83, 0.86, 0.88, 0.90, , 1.41, 1.40, 1.40, 1.41, 1.41, , 0.72, 0.75, 0.77, 0.80, 0.83, , 1.55, 1.54, 1.53, 1.53, 1.52, , 0.63, 0.66, 0.70, 0.72, 0.75, , 1.71, 1.69, 1.67, 1.66, 1.65, , 26, 27, 28, 29, 30, , 1.07, 1.09, 1.10, 1.12, 1.13, , 1.22, 1.23, 1.24, 1.25, 1.26, , 1.00, 1.02, 1.04, 1.05, 1.07, , 1.31, 1.32, 1.32, 1.33, 1.34, , 0.93, 0.95, 0.97, 0.99, 1.01, , 1.41, 1.41, 1.41, 1.42, 1.42, , 0.85, 0.88, 0.90, 0.92, 0.94, , 1.52, 1.51, 1.51, 1.51, 1.51, , 0.78, 0.81, 0.83, 0.85, 0.88, , 1.64, 1.63, 1.62, 1.61, 1.61, , 31, 32, 33, 34, 35, , 1.15, 1.16, 1.17, 1.18, 1.19, , 1.27, 1.28, 1.29, 1.30, 1.31, , 1.08, 1.10, 1.11, 1.13, 1.14, , 1.34, 1.35, 1.36, 1.36, 1.37, , 1.02, 1.04, 1.05, 1.07, 1.08, , 1.42, 1.43, 1.43, 1.43, 1.44, , 0.96, 0.98, 1.00, 1.01, 1.03, , 1.51, 1.51, 1.51, 1.51, 1.51, , 0.90, 0.92, 0.94, 0.95, 0.97, , 1.60, 1.60, 1.59, 1.59, 1.59, , 36, 37, 38, 39, 40, , 1.21, 1.22, 1.23, 1.24, 1.25, , 1.32, 1.32, 1.33, 1.34, 1.34, , 1.15, 1.16, 1.18, 1.19, 1.20, , 1.38, 1.38, 1.39, 1.39, 1.40, , 1.10, 1.11, 1.12, 1.14, 1.15, , 1.44, 1.45, 1.45, 1.45, 1.46, , 1.04, 1.06, 1.07, 1.09, 1.10, , 1.51, 1.51, 1.52, 1.52, 1.52, , 0.99, 1.00, 1.02, 1.03, 1.05, , 1.59, 1.59, 1.58, 1.58, 1.58, , 45, 50, 55, 60, 65, , 1.29, 1.32, 1.36, 1.38, 1.41, , 1.38, 1.40, 1.43, 1.45, 1.47, , 1.24, 1.28, 1.32, 1.35, 1.38, , 1.42, 1.45, 1.47, 1.48, 1.50, , 1.20, 1.24, 1.28, 1.32, 1.35, , 1.48, 1.49, 1.51, 1.52, 1.53, , 1.16, 1.20, 1.25, 1.28, 1.31, , 1.53, 1.54, 1.55, 1.56, 1.57, , 1.11, 1.16, 1.21, 1.25, 1.28, , 1.58, 1.59, 1.59, 1.60, 1.61, , 70, 75, 80, 85, 90, , 1.43, 1.45, 1.47, 1.48, 1.50, , 1.49, 1.50, 1.52, 1.53, 1.54, , 1.40, 1.42, 1.44, 1.46, 1.47, , 1.52, 1.53, 1.54, 1.55, 1.56, , 1.37, 1.39, 1.42, 1.43, 1.45, , 1.55, 1.56, 1.57, 1.58, 1.59, , 1.34, 1.37, 1.39, 1.41, 1.43, , 1.58, 1.59, 1.60, 1.60, 1.61, , 1.31, 1.34, 1.36, 1.39, 1.41, , 1.61, 1.62, 1.62, 1.63, 1.64, , 95, 100, , 1.51, 1.52, , 1.55, 1.56, , 1.49, 1.50, , 1.57, 1.58, , 1.47, 1.48, , 1.60, 1.60, , 1.45, 1.46, , 1.62, 1.63, , 1.42, 1.44, , 1.64, 1.65, , n, , Source: Durbin and Watson, 1951
Page 244 :
TABLES, Table 34, , 235, , Modified Rayleigh test (V -test), Level of significance α, , n, , 0.10, , 0.05, , 0.01, , 0.005, , 0.001, , 0.0001, , 5, 6, 7, 8, 9, , 1.3051, 1.3009, 1.2980, 1.2958, 1.2942, , 1.6524, 1.6509, 1.6499, 1.6492, 1.6484, , 2.2505, 2.2640, 2.2734, 2.2803, 2.2856, , 2.4459, 2.4695, 2.4858, 2.4978, 2.5070, , 2.7938, 2.8502, 2.8886, 2.9164, 2.9375, , 3.0825, 3.2114, 3.2970, 3.3578, 3.4034, , 10, 11, 12, 13, 14, , 1.2929, 1.2918, 1.2909, 1.2902, 1.2895, , 1.6482, 1.6479, 1.6476, 1.6474, 1.6472, , 2.2899, 2.2933, 2.2961, 2.2985, 2.3006, , 2.5143, 2.5201, 2.5250, 2.5290, 2.5325, , 2.9540, 2.9672, 2.9782, 2.9873, 2.9950, , 3.4387, 3.4669, 3.4899, 3.5091, 3.5253, , 15, 16, 17, 18, 19, , 1.2890, 1.2885, 1.2881, 1.2877, 1.2874, , 1.6470, 1.6469, 1.6467, 1.6466, 1.6465, , 2.3023, 2.3039, 2.3052, 2.3064, 2.3075, , 2.5355, 2.5381, 2.5404, 2.5424, 2.5442, , 3.0017, 3.0075, 3.0126, 3.0171, 3.0211, , 3.5392, 3.5512, 3.5617, 3.5710, 3.5792, , 20, 21, 22, 23, 24, , 1.2871, 1.2868, 1.2866, 1.2864, 1.2862, , 1.6464, 1.6464, 1.6463, 1.6462, 1.6462, , 2.3085, 2.3093, 2.3101, 2.3108, 2.3115, , 2.5458, 2.5473, 2.5486, 2.5498, 2.5509, , 3.0247, 3.0279, 3.0308, 3.0335, 3.0359, , 3.5866, 3.5932, 3.5992, 3.6047, 3.6096, , 25, 26, 27, 28, 29, , 1.2860, 1.2858, 1.2856, 1.2855, 1.2853, , 1.6461, 1.6461, 1.6460, 1.6460, 1.6459, , 2.3121, 2.3127, 2.3132, 2.3136, 2.3141, , 2.5519, 2.5529, 2.5538, 2.5546, 2.5553, , 3.0382, 3.0402, 3.0421, 3.0439, 3.0455, , 3.6142, 3.6184, 3.6223, 3.6258, 3.6292, , 30, 40, 50, 60, 70, , 1.2852, 1.2843, 1.2837, 1.2834, 1.2831, , 1.6459, 1.6456, 1.6455, 1.6454, 1.6453, , 2.3145, 2.3175, 2.3193, 2.3205, 2.3213, , 2.5560, 2.5610, 2.5640, 2.5660, 2.5674, , 3.0471, 3.0580, 3.0646, 3.0689, 3.0720, , 3.6323, 3.6545, 3.6677, 3.6764, 3.6826, , 100, 500, 1000, , 1.2826, 1.2818, 1.2817, , 1.6452, 1.6449, 1.6449, , 2.3228, 2.3256, 2.3260, , 2.5699, 2.5747, 2.5752, , 3.0775, 3.0877, 3.0890, , 3.6936, 3.7140, 3.7165, , Source: Batschelet, 1981; original provided by W.T. Keeton
Page 245 :
236, , 100 STATISTICAL TESTS, Table 35 Watson’s Un2 -test, Level of significance α, n, , 0.10, , 0.05, , 0.025, , 0.01, , 0.005, , 2, 3, 4, , 0.143, 0.145, 0.146, , O.155, 0.173, 0.176, , 0.161, 0.194, 0.202, , 0.164, 0.213, 0.233, , 0.165, 0.224, 0.252, , 5, 6, 7, 8, 9, , 0.148, 0.149, 0.149, 0.150, 0.150, , 0.177, 0.179, 0.180, 0.181, 0.182, , 0.205, 0.208, 0.210, 0.211, 0.212, , 0.238, 0.243, 0.247, 0.250, 0.252, , 0.262, 0.269, 0.274, 0.278, 0.281, , 10, 12, 14, 16, 18, , 0.150, 0.150, 0.151, 0.151, 0.151, , 0.182, 0.183, 0.184, 0.184, 0.184, , 0.213, 0.215, 0.216, 0.216, 0.217, , 0.254, 0.256, 0.258, 0.259, 0.259, , 0.283, 0.287, 0.290, 0.291, 0.292, , 20, 30, 40, 50, 100, , 0.151, 0.152, 0.152, 0.152, 0.152, , 0.185, 0.185, 0.186, 0.186, 0.186, , 0.217, 0.219, 0.219, 0.220, 0.221, , 0.261, 0.263, 0.264, 0.265, 0.266, , 0.293, 0.296, 0.298, 0.299, 0.301, , 0.152, , 0.187, , 0.221, , 0.267, , 0.302, , ∞, , Source: Batschelet, 1981; adapted from Stephens, 1964
Page 246 :
TABLES, , 237, , Table 36 Watson’s two-sample U 2 -test, n and m are sample sizes., Level of significance α, n, , m, , 0.50, , 0.20, , 0.10, , 0.05, , 0.02, , 0.01, , 0.005, , 0.002, , 0.001, , 5, 5, 5, 5, 5, 5, 5, 5, , 5, 6, 7, 8, 9, 10, 11, 12, , 0.089, 0.085, 0.086, 0.085, 0.080, 0.084, 0.081, 0.078, , 0.161, 0.133, 0.128, 0.131, 0.124, 0.124, 0.124, 0.124, , 0.225, 0.182, 0.171, 0.165, 0.159, 0.161, 0.156, 0.155, , 0.225, 0.242, 0.200, 0.215, 0.191, 0.196, 0.190, 0.186, , 0.257, 0.269, 0.280, 0.241, 0.229, 0.226, , 0.280, 0.289, 0.297, 0.261, , 0.289, 0.297, 0.304, , 6, 6, 6, 6, 6, 6, 6, , 6, 7, 8, 9, 10, 11, 12, , 0.088, 0.081, 0.083, 0.082, 0.077, 0.078, 0.080, , 0.132, 0.121, 0.127, 0.126, 0.126, 0.121, 0.124, , 0.171, 0.154, 0.161, 0.156, 0.156, 0.157, 0.155, , 0.206, 0.194, 0.196, 0.193, 0.190, 0.187, 0.183, , 0.264, 0.282, 0.246, 0.232, 0.231, 0.225, 0.226, , 0.282, 0.298, 0.262, 0.248, 0.262, 0.259, , 0.298, 0.311, 0.323, 0.289, 0.275, , 0.323, 0.333, 0.343, , 0.343, , 7, 7, 7, 7, 7, 7, , 7, 8, 9, 10, 11, 12, , 0.079, 0.079, 0.079, 0.077, 0.077, 0.076, , 0.135, 0.120, 0.122, 0.123, 0.122, 0.122, , 0.158, 0.156, 0.156, 0.155, 0.155, 0.154, , 0.199, 0.182, 0.182, 0.187, 0.184, 0.186, , 0.251, 0.225, 0.222, 0.227, 0.221, 0.226, , 0.304, 0.272, 0.255, 0.262, 0.253, 0.252, , 0.304, 0.322, 0.291, 0.277, 0.281, 0.276, , 0.339, 0.353, 0.323, 0.308, , 0.353, 0.366, 0.377, , 8, 8, 8, 8, 8, , 8, 9, 10, 11, 12, , 0.078, 0.078, 0.078, 0.077, 0.077, , 0.125, 0.123, 0.122, 0.122, 0.121, , 0.156, 0.155, 0.155, 0.154, 0.156, , 0.184, 0.186, 0.185, 0.184, 0.185, , 0.226, 0.226, 0.222, 0.225, 0.223, , 0.250, 0.258, 0.249, 0.252, 0.252, , 0.296, 0.283, 0.280, 0.280, 0.281, , 0.344, 0.363, 0.336, 0.319, 0.317, , 0.363, 0.380, 0.353, 0.340, , 9, 9, 9, 9, , 9, 10, 11, 12, , 0.077, 0.076, 0.076, 0.077, , 0.125, 0.122, 0.121, 0.122, , 0.155, 0.154, 0.154, 0.154, , 0.187, 0.186, 0.185, 0.185, , 0.225, 0.226, 0.225, 0.226, , 0.266, 0.254, 0.255, 0.254, , 0.286, 0.287, 0.281, 0.280, , 0.340, 0.321, 0.317, 0.316, , 0.384, 0.361, 0.341, 0.340, , 10, 10, 10, , 10, 11, 12, , 0.075, 0.076, 0.076, , 0.123, 0.122, 0.121, , 0.155, 0.154, 0.153, , 0.185, 0.186, 0.185, , 0.225, 0.224, 0.225, , 0.255, 0.255, 0.255, , 0.283, 0.279, 0.282, , 0.317, 0.317, 0.316, , 0.345, 0.341, 0.341, , 0.071, , 0.117, , 0.152, , 0.187, , 0.233, , 0.268, , 0.304, , 0.350, , 0.385, , ∞, , ∞, , Source: Batschelet, 1981: adapted from Zar, 1974
Page 247 :
238, , 100 STATISTICAL TESTS, Table 37 Maximum likelihood estimate k̂ for, given R̄ in the von Mises case, For the solution k = A−1 (ρ), replace k̂ by k, R̄ by ρ., R̄, , k̂, , R̄, , k̂, , R̄, , k̂, , 0.00, 0.01, 0.02, 0.03, 0.04, , 0.00000, 0.02000, 0.04001, 0.06003, 0.08006, , 0.35, 0.36, 0.37, 0.38, 0.39, , 0.74783, 0.77241, 0.79730, 0.82253, 0.84812, , 0.70, 0.71, 0.72, 0.73, 0.74, , 2.01363, 2.07685, 2.14359, 2.21425, 2.28930, , 0.05, 0.06, 0.07, 0.08, 0.09, , 0.10013, 0.12022, 0.14034, 0.16051, 0.18073, , 0.40, 0.41, 0.42, 0.43, 0.44, , 0.87408, 0.90043, 0.92720, 0.95440, 0.98207, , 0.75, 0.76, 0.77, 0.78, 0.79, , 2.36930, 2.45490, 2.54686, 2.64613, 2.75382, , 0.10, 0.11, 0.12, 0.13, 0.14, , 0.20101, 0.22134, 0.24175, 0.26223, 0.28279, , 0.45, 0.46, 0.47, 0.48, 0.49, , 1.01022, 1.03889, 1.06810, 1.09788, 1.12828, , 0.80, 0.81, 0.82, 0.83, 0.84, , 2.87129, 3.00020, 3.14262, 3.30114, 3.47901, , 0.15, 0.16, 0.17, 0.18, 0.19, , 0.30344, 0.32419, 0.34503, 0.36599, 0.38707, , 0.50, 0.51, 0.52, 0.53, 0.54, , 1.15932, 1.19105, 1.22350, 1.25672, 1.29077, , 0.85, 0.86, 0.87, 0.88, 0.89, , 3.68041, 3.91072, 4.17703, 4.48876, 4.85871, , 0.20, 0.21, 0.22, 0.23, 0.24, , 0.40828, 0.42962, 0.45110, 0.47273, 0.49453, , 0.55, 0.56, 0.57, 0.58, 0.59, , 1.32570, 1.36156, 1.39842, 1.43635, 1.47543, , 0.90, 0.91, 0.92, 0.93, 0.94, , 5.3047, 5.8522, 6.5394, 7.4257, 8.6104, , 0.25, 0.26, 0.27, 0.28, 0.29, , 0.51649, 0.53863, 0.56097, 0.58350, 0.60625, , 0.60, 0.61, 0.62, 0.63, 0.64, , 1.51574, 1.55738, 1.60044, 1.64506, 1.69134, , 0.95, 0.96, 0.97, 0.98, 0.99, , 10.2716, 12.7661, 16.9266, 25.2522, 50.2421, , 0.30, 0.31, 0.32, 0.33, 0.34, , 0.62922, 0.65242, 0.67587, 0.69958, 0.72356, , 0.65, 0.66, 0.67, 0.68, 0.69, , 1.73945, 1.78953, 1.84177, 1.89637, 1.95357, , 1.00, , ∞, , Source: Mardia, 1972
Page 248 :
TABLES, Table 38, , 239, , Mardia–Watson–Wheeler test, , n1 = smaller of the two sample sizes n1 , n2 ; n = n1 + n2 ., Level of significance α, n, , n1, , 0.001, , 0.01, , 0.05, , 0.10, , 8, , 4, , 9, , 3, 4, , 8.29, , 6.41, 4.88, , 3, 4, 5, , 9.47, 10.47, , 6.85, 6.24, 6.85, , 3, 4, 5, , 12.34, , 7.20, 10.42, 8.74, , 5.23, 7.43, 6.60, , 3, 4, 5, 6, , 11.20, 13.93, 14.93, , 7.46, 8.46, 10.46, 11.20, , 5.73, 7.46, 7.46, 7.46, , 3, 4, 5, 6, , 11.83, 15.26, 17.31, , 7.68, 9.35, 10.15, 10.42, , 6.15, 7.03, 7.39, 8.04, , 3, 4, 5, 6, 7, , 19.20, 20.20, , 12.34, 16.39, 15.59, 16.39, , 7.85, 9.30, 10.30, 12.21, 11.65, , 6.49, 7.60, 7.85, 7.94, 8.85, , 17.35, 20.92, 22.88, , 12.78, 14.52, 17.48, 16.14, , 7.99, 8.74, 10.36, 11.61, 11.57, , 6.78, 7.91, 7.91, 9.12, 9.06, , 3, 4, 5, 6, 7, , 18.16, 22.43, 25.27, , 13.14, 15.55, 16.98, 18.16, , 8.11, 9.44, 10.44, 11.54, 12.66, , 5.83, 7.38, 9.03, 9.11, 9.78, , 3, 4, 5, 6, 7, 8, , 13.44, 18.86, 23.73, 27.40, 29.37, , 8.21, 11.76, 16.44, 17.76, 17.98, 19.11, , 7.23, 9.74, 11.03, 12.21, 12.63, 13.36, , 6.14, 7.64, 8.76, 9.41, 10.11, 10.15, , 10, , 11, , 12, , 13, , 14, , 15, , 16, , 17, , 3, 4, 5, 6, 7, , 6.83, , Source: Mardia, 1972
Page 249 :
REFERENCES, Anderson, R.L. (1942) ‘Distribution of the serial correlation coefficient’, Annals of Mathematical Statistics, 13:, 1–13., Batschelet, E. (1972) ‘Recent statistical methods for orientation data’, in S.R. Galler et al. (eds), Symposium on, Animal Orientation and Navigation. Washington, DC: US Government Printing Office., Batschelet, E. (1981) Circular Statistics in Biology. London: Academic Press., Bennett, C. and Franklin, N.L. (1961) Statistical Analysis in Chemistry and the Chemical Industry. New York:, Wiley., De Jonge, H. (1963–4) Inleiding tot de Medrische Statistick. Vol. 1: Fundamentele Begrippen en Technieken:, Verdelingsvrije Methoden. Vol. II: Klassieke Methoden. 3rd edn. Leiden: TNO Health Research., Dixon, W.J. and Massey, F.J. Jr (1957) Introduction to Statistical Analysis. New York: McGraw-Hill., Durbin, J. and Watson, G.S. (1951) ‘Testing for serial correlation in least squares regression II’, Biometrika, 38:, 159–78., Fisher, R.A. (1958) Statistical Methods for Research Workers. Edinburgh: Oliver and Boyd., Fisher, R.A. and Yates, F. (1974) Statistical Tables for Biological, Agricultural and Medical Research. 6th edn., Edinburgh: Oliver and Boyd., Geary, R.E. and Pearson, E.S. (n.d.) ‘Tests of normality’, Biometrika Office, University College, London., Hart, B.I. (1942) ‘Significance levels for the ratio of the mean square successive difference to the variance’, Annals, of Mathematical Statistics, 13: 445–7., Mardia, K.V. (1972) Statistics of Directional Data. London: Academic Press., Massey, F.J. Jr (1951) ‘The Kolmogorov–Smirnov test for goodness of fit’, Journal of the American Statistical, Association, 4(6): 1990., Merrington, M. and Thompson, C.M. (1946) ‘Tables for testing the homogeneity of a set of estimated variances’,, Biometrika, 33: 296–304., Natrella, M.G. (1963) Experimental Statistics. National Bureau of Standards Handbook 91. Washington, DC: US, Government Printing Office., Neave, H.R. (1976a) ‘The teaching of hypothesis testing’, Bulletin in Applied Statistics, 3(1): 55–63., Neave, H.R. (1976b) ‘Non-parametric testing – why and how’, Bulletin in Applied Statistics, 3(2): 49–58., Neave, H.R. (1978) Statistical Tables. London: George Allen & Unwin., Pearson, E.S. and Hartley, H.O. (1970) Biometrika Tables for Statisticians, Vol. 1. Cambridge: Cambridge, University Press., Pearson, E.S. and Hartley, H.O. (1976) Biometrika Tables for Statisticians, Vol. 2. London: Charles Griffin., Sachs, L. (1970) Statistische Methoden: ein Soforthelfer. Berlin: Springer-Verlag., Sachs, L. (1972) Statistische Auswertungsmethoden. 3rd edn. Berlin: Springer-Verlag., Stephens, M.A. (1964) ‘The distribution of the goodness of fit statistic Un2 II’, Biometrika, 51: 393–7., Walpole, R.E. and Myers, R.H. (1989) Probability and Statistics for Engineers and Scientists. 4th edn. New York:, Macmillan., Wijvekate, M.L. (1962) Verklarende Statistiek. Utrecht: Aula., Zar, J.H. (1974) Biostatistical Analysis. Englewood Cliffs, NJ: Prentice Hall.
Page 250 :
INDEX, adjacency test 118, alternative hypothesis 2, analysis of variance 55, 61, 182, angular values 174, 176, 182, angular variance 18, 177, , Fisher’s combined test 52, Fisher’s cumulant test 51, Fisher’s exact test 83, Fisher’s Z-transformation 194, Friedman’s test 131, , non-additivity 17, 139, normal distribution 16,, 25, 44, normality 74, null hypothesis 1, 4, 17, , Bartlett’s test 71, Bernoulli population 166, binomial distribution 26, 27, , goodness of fit test 12, 76, 79, , outliers 54, 75, , H-test 104, Harrison–Kanji–Gadsden, test 182, Hartley’s test 73, Hotelling’s T 2 test 48, hypothesis testing 2, , paired observations 9, 35, 46, 96,, 109, 110, Poisson distribution 28, 60, probabilistic model 18, 172, , chi-square (χ 2 ) distribution, 44, 59, chi-square (χ 2 ) test 10, 44, 59,, 81, 85, 86, 89, 91, 173, circular observations 18, 177, 178, Cochran’s test 75, 88, consistency 83, 85, 86, 88, 89, contingency tables 13, 83, contrast 63, control group 69, 108, correlated proportions 57, correlation coefficient 39, 40, 42, correlations 46, counts 81, critical region 2, 3, critical value 40, 42, 44, 45, 57, cumulant test 51, cumulative distribution 76, degrees of freedom 7, 8, 9, 10, 11, delta test, see, Kolmogorov–Smirnov test, 76, 78, dichotomous classification 16, 83,, 86, 116, difference sign test 122, discriminant test 50, distribution-free test 19, Dixon test 54, Duckworth’s test 171, Dunnett’s test 69, Durbin–Watson test 169, equality of variances 71, 73, exponential population 18, 165, F-test 11, 45, 46, 55, 60, 61, 63,, 139, 142, 145, 148, 151, 153,, 158, 160, 161, , q-test 65, Q-test 88, independence test 91, interaction effect 142, 161, inversion test 97, , judgement 133, , K-statistics 51, Kendall rank correlation, test 110, Kolmogorov–Smirnov test, 76, 78, Kruskall–Wallis rank sum test 104, kurtosis 51, 53, , level of significance 3, likelihood ratio test 18, 164, Link–Wallace test 67, log odds ratio 156, , Mardia–Watson–Wheeler, test 180, mean 55, 61, 95, 96, mean angles 18, 178, median test 93, 94, 98, 99, 171, modified Rayleigh test 174, multinomial distribution 137, multiple comparison 65, 67, 106, multiple regression 18, 158, , Neave 2, nested classification 148, , random effects model 18, 160, randomness 118, 120, 121,, 122, 123, 124, 126, 128,, 129, 174, rank correlation test 109, 110,, 129, 133, rank sum difference test 106, rank sum maximum test 107, rectangular population, 18, 164, regression 37, 151, 153, run test 123, 124, 126, , sequential contingencies 156, sequential probability ratio, test 168, sequential test 18, 112, 114,, 116, 166, serial correlation test 120, Siegel–Tukey rank sum dispersion, test 102, sign test 93, 94, signed rank test 95, 96, significance level 2, skewness 51, 53, Spearman rank correlation, test 109, standard deviation 114, Steel test 108, Studentized range 65, 74, Student’s t distribution 29, 31, 33,, 35, 37
Page 251 :
242, t-test 7, 8, 29, 31, 33, 35,, 37, 39, Tukey’s test 65, 139, turning point test 121, two-way classification 139,, 142, 145, U-test 97, UMP test 165, uncertainty of events 155, , INDEX, V -test 174, variance 59, variance ratio test 45, von Mises population, 18, 182, , Wilcoxon inversion test 97, Wilcoxon–Wilcox test 130, Wilcoxons–Mann–Whitney rank, sum test 101, 128, Yates correction 85, , w/s-test 74, Watson–Williams test 178, Watson’s U 2 test 177, Watson’s Un2 test 176, , Z-test 5, 6, 21, 23, 25, 26, 27, 28,, 40, 42, 57, 155, 156, Z-transformation 194
 Learn better on this topic