Notes of Math World For ssc ,Bank ,Railway , State exams, Quantitative Aptitude DATA interpretation.pdf - Study Material
Page 2 :
Directions: (Q. 1-10) Study the following pie chart and table to answer, these questions, , Q 1) What is the difference between the graduate male population and XII Std, male population from, AP ?, (a) 24000, (b) 14000, (c) 28000, (d) 36000, (e) None of these, Q 2) What is the ratio of female population of Goa to XII Std female population of, Delhi respectively?, (a) 7:5, (b) 5:7, (c) 16:15, (d) 15:16, (e) None of these, Q 3) Graduate female population of Chandigarh what per cent of the XII Std, female population of the, state ?, DATA INTERPRETATION, , Page 2
Page 3 :
(a) 40% (b) 62.5% (c) 50 % (d) 52.5%, (e) None of these, Q 4) Class XII pass male population of Chandigarh is what per cent of the total XII, Std population of all the states together ?, (a) 8%, (b) 12%, (c) 11% (d) 9%, (e) None of these, Q 5) What is the ratio of graduation male population of the Goa to XII Std female, population of that state ?, (a) 28:35, (b) 35:28, (c) 32:45, (d) 45:32, (e) None of these, Q 6) Total graduate population of state MP is what per cent of the total XII Std, population of AP ?, (a) 56%, (b) 72% (c) 68%, (d) 72%, (e) None of these, Q 7) XII Std male population of Goa is what per cent of XII Std male population, of MP?, (a) 70%, (b) 75% (c) 68%, (d) 72%, (e) None of these, Q 8) What is the ratio of the total graduate and XII Std male population of AP to, the total graduate and XII Std of AP to the total graduate and XII Std female, population of that state?, (a) 215:216, (b) 214:215, (c) 217:215, (d) 215:217 (e) None of these, Q 9) What is the ratio of the total graduate population of the Delhi to the total Std, population of that, state?, (a) 17:16, (b) 16:17 (c) 64:51 (d) 51:64, (e)None of these, Q 10) Graduate female population of Bihar is what per cent of the graduate female, population of Goa, ? (rounded off to nearest integer), (a) 129%, (b) 82%, (c) 77% (d) 107%, (e) None of these, ANSWERS, (1) b (2) d, , (3) c (4) a, , (5) e, , (6) e, , (7) b, , (8) c, , (9) a (10) c, , Direction (11-15): Study the pie chart carefully and answer the given questions., The pie chart shows the percentage breakup of students in different classes from VI, to X in the year 2017, , DATA INTERPRETATION, , Page 3
Page 4 :
11. The total number of students study in class VI and class IX together is, approximately what percentage more than that of the total number of students, study in class X?, A. 125%, B. 280%, C. 217%, D. 189%, E. 77%, 12. If in class VI, the ratio of boys to girls is 6:5 and the total number of girls in, class VI is 50 less than that of the total number of girls in class VII. Find the ratio, of the total number of boys in class VI to class VII., A. 5:7, B. 7:11, C. 9:13, D. 6:13, E. 4:5, 13. If in 2018, the total number of students in class VI and class VII is increased by, 10% each and the total number of students in class VIII is decreased by 20% then, what is the difference between the total number of students in class VI and VII, together in 2018 to that of the total number of students in class VIII in 2018?, A. 976, B. 1067, C. 1156, D. 1078, E. 878, 14. If the total number of boys in class VIII is “x” and the total number of boys in, class IX is “x+40”. The total number of girls in class VIII and class IX together is, 306. Then find the value of “x”., A. 190, B. 210, C. 174, D. 184, E. 196, 15. What is the difference between the total number of students in class VII and, class VIII together to that of the total number of students in class IX and class X, together?, A. 480, B. 520, C. 440, D. 400, E. 560, Answer, 11-C 12-D, , 13-B, , 14-A, , 15-C, , Directions(16-20)-In the following pie chart number of student who failed in, different exam eximine the chart of following question, total no. of student who have failed is 500, DATA INTERPRETATION, , Page 4
Page 5 :
16-The number of student who failed in science is less than the number of student, failed in all other subjects, A -170, b-140, c-180, d- 160, 17-The center angle of sector student who have failed in math is, A30degree b-100 deg c-105.2deg d-108deg, 18-Total number of student who did not qualify in math ,language and science is, A-460, b-490, c-480, d-470, 19-Number of student who failed in math is less than the student who did not, qualify in language by;, A20, b-40, c-30, d-50, 20-The percentage of student who failed in math and language is;, A-65.5%, b-60%, c-66%, D-62%, Answer, 16-c 17-d 18-b 19-c 20-c, Directions(21-25)-In the following pie chart shows number of student enroll in, school in different activites total no. of student in school is 1200 study chart and, ans following question, , DATA INTERPRETATION, , Page 5
Page 6 :
21-How many student are enroll in NCC activity?, A-180, b-120, c-72, d-240, 22-What is the total no. of student in debating club and HRD club?, A-144, b-216, c- 288, d-72, 23-The no of student enrolled in Eco club is what percent of those enrolled in Red, cross Club?, A-94.24% b-94.45% c-82.45% d-104.76%, 24-What is the ratio of number of student enrolled in scout and Redcross activity, together to those enrolled in debating club activity?, A-3:1 b-4:1, c-1:4 d-1:3, 25-Which two club have the enrolment in the ratio of 2:1?, A-Eco club, HRD club B-Eco club,NCC, c-HRD,Eco club, D-debating, Eco club, Answer, 21-a 22- c 23-d, , 24-a 25-a, , Directions (Q. 26-30): Study the following pie chart and table carefully to, solve the questions given below, Percentage wise distribution of the number of LCD sold by the shopkeeper during, six months, Total number of LCD sold = 45000, , DATA INTERPRETATION, , Page 6
Page 7 :
Sales, December, , july, , aug, , 12%, , sept, , oct, , nov, , 16%, , 8%, , 17%, 25%, 22%, , month, July, aug, Sept, Oct, Nov, dec, , ratio, 8:7, 4:5, 3:2, 7:5, 7:8, 7:9, , Ques 26. What is the ratio of the number of LCD sold of company B during July to, those sold during December of the same company?, a) 119 : 145, b) 116 : 135 c) 119 : 135 d) 119 : 130 e) None of these, Ques 27. If 35% of the LCD sold by company A during November were sold at a, discount, how many LCD of Company A during that month were sold without a, discount?, a) 882 b) 1635 c) 1638, d) 885, e) None of these, Ques 28. If the shopkeeper earned a profit of Rs. 433 on each LCD sold by, Company B during October, what was his total profit earned on the LCD of that, company during the same month?, a)Rs. 6,49,900 b)Rs. 6,45,900, c)Rs. 6,49,400 d)Rs. 6,49,500 e) None of, these, Ques 29. The number of LCD sold of Company A during July is approximately, what per cent of the number of LCD sold of Company A during December?, a) 110, b) 140, c) 150, d) 105, e) 130, Ques 30. What is the total number of LCD sold of Company B during August and, September together?, DATA INTERPRETATION, , Page 7
Page 8 :
a) 10000, , b) 15000 c) 10500 d) 9500, , e) None of these, , Answer, 26-c 27-e 28- d 29-e 30-a, Directions (Q.31-35) Study the following pie chart and table carefully to, answer the questions:, Percentage breakup of employees working in various departments of an, organization and the number of males in them, , Department, , Number of Males, , Production, 245, HR, 12, IT, 74, Marketing, 165, Accounts, 93, 31. The number of males working in the Marketing department is what percent of, the total number of employees working in that department? (Rounded off to the, nearest integer), a) 70, b) 78, c) 63, d) 91, e) 86, 32. What is the respective ratio between the number of females working in the HR, department and the total number of employees in that department?, a) 7:10, b) 5:7 c) 8:17 d) 12:19 e) None of these, 33. The number of males working in the Production department of the organization, forms what percent of the total number of employees working in that department?, a) 76.5, b) 72.5, c) 61.5 d) 87, e) None of these, 34. The number of females working in the IT department forms what percent of the, total number of employees in the organization from all departments together?, DATA INTERPRETATION, , Page 8
Page 9 :
a) 10.75, b) 15.25, c) 11.5 d) 13.75 e) None of these, 35. What is the respective ratio of the number of males working in the marketing, department to the number of females working in that department?, a) 63:8, b) 55:9, c) 64:7, d) 56:3, e) None of these, Answer, 31-E, 32-A, , 33-D, , 34-A 35-B, , Directions (Q. 36-40): Study the following table and pie chart carefully to, answer the given questions., Percentage of various regiment in Indian army, bihar, maratha 12%, 18%, madras, 15%, , jat, 35%, sikh, 20%, , The table shows the ratio of Hindi religion soldiers to soldiers of other religions, Name of regiment, hindi, Other religions, Jat regiment, 4, 1, Sikh regiment, 3, 5, Madras regiment, 2, 1, Maratha regiment, 3, 2, Bihar regiment, 5, 3, 36) What is the number of Hindu soldiers in Jat regiment?, a) 2600, b) 2700, c) 3200, d) 2800, e) 2350, 37) What is the difference between Hindu soldiers in Madras regiment and soldiers, of other religions in Bihar regiment?, a) 485, b) 550, c) 520 d) 510, e) 490, 38) The number of Hindu soldiers in Sikh regiment is what percent of the number, of other soldiers in Maratha regiment?, a) 97.12%, b) 99.56%, c) 102%, d) 104.16% e) 25%, 39) In which regiment is the number of non-Hindu soldiers the maximum?, , DATA INTERPRETATION, , Page 9
Page 10 :
a) Maratha regiment, b) Sikh regiment, c) Madras regiment, d) Jat regiment, e) Bihar regiment, 40) What is the ratio of the number of Hindu soldiers in Bihar regiment to the, number of non-Hindu soldiers in Jat regiment?, a) 11 : 10, b) 12 : 11, c) 13 : 12 d) 14 : 13 e) 15 : 14, Answer, 36-D 37-B 38- D, , 39- A, , 40-E, , Direction(41-45): Study the following information to answer the questions., , 41. On Wednesday, in hotel A, 30% of male customers and 70% of female, customers were from Town X. what was the number of customers in hotel A from, town X on Wednesday?, A. 161, B. 183, C. 181, D. 153, E. 157, 42- The number of customers (male + female) in hotel A and B are increased by, 50% and 15% respectively from Thursday to Saturday. If the total number of, female customers in hotel A and B together was equal on Thursday and Saturday,, what was the total number of male customers in hotel A and B together on, Saturday?, A. 458, B. 438, C. 442, D. 448, E. 452, 43-. In hotel B, the ratio of female customers on Tuesday and Friday was 2 : 3. If, on Friday, female customers constituted 50% of the number of customers (male +, female), then what was the number of customers (male + female) in hotel B on, Friday?, A. 288 B. 296, C. 294, D. 282 E. 276, 44-. In hotel A, what is the difference between the total number of male customers, on Monday and Tuesday together and that on Wednesday and Thursday together?, A. 183, B. 177, C. 185, D. 187, E-181, DATA INTERPRETATION, , Page 10
Page 11 :
45--what is the average number of male coustmer in hotel B on Monday,, Wednesday and Thursday, A. 134 B. 188 C. 185 D. 175 E. 184, , Answer, 41-A 42-D 43-D 44-E 45-A, Direction (46-50): The table given below represents number of bikes of five, different brands sold from 2001- 2005, with the help of data given in the table,, answer the following questions., , 46. In how many years the increase of selling is greater than 10% for any brand?, A. 2, B. 3 C. 1, D. 4, E. None of these, 47. The sales of Yamaha increased from 2001 to 2005 by what percentage?, A. 11.11% B. 12% C. 13.33% D. 10.6%6, E. None of these, 48. The average sale of Bajaj from 2001 to 2005 is what percentage of total sales, of Suzuki from 2001-2005?, A. 12.22% B. 15.23% C. 14%, D. 13.23% E. None of these, 49. What is the ratio of average sales of TVS in year 2002 and 2005 to the average, sales of Honda in year 2001 and 2004?, A. 111:142, B. 441:173, C. 273:433, D. 433: 273 E. None of these, 50. If sales of Suzuki in the year 2006 is increased by 5% and sales of Yamaha, decreased by 5%, then what is the difference of averages of sales of Suzuki in year, 2001 and 2006 and average sales of Yamaha in 2002 and 2006?, A. 2330 B. 2345 C. 1170, D. 2000, E. None of these, Answer, 46-C, 47-A, , 48-D, , 49-D 50-B, , Directions (51-55): Study the table and answer the given questions., Data related to Human Resource Dept. of a multinational company (X) which has, 145 offices across 8 countries, Countries, , Offices, , DATA INTERPRETATION, , Total, Employees, , Respective, Ratio of male, , % of post, graduate, Page 11
Page 12 :
A, B, C, D, E, F, G, H, , 16, 18, 14, 22, 13, 17, 24, 21, , & female, employees, 5:7, 11 : 5, 10 : 11, 3:2, 7:6, 20 : 21, 8:7, 8:6, , 2568, 2880, 2310, 3575, 2054, 2788, 3720, 3360, , 75, 65, 40, 60, 50, 75, 55, 80, , Q51. The number of male post graduate employees in country H is 1800. If, number of female post graduates increase by 50% in the next year, what % of, female employees in that particular country is post graduate? (Given that all other, data remain same), (a) 76.8% (b) 74% (c) 92.5% (d) 90% (e) 80%, Q52. In which country, is the percentage of women employees to number of, employees (both male & female) is ranked third lowest?, (a) E (b) B (c) H (d) F (e) A, Q53. What is the ratio between total number of male employees in countries B and, H together and total number of post graduate employees in same countries?, (a) 76 : 65 (b) 86 : 85 (c) 75 : 76 (d)65 : 76 (e)12 : 33, Q54. What is the difference between average number of post graduate employees, in countries A, B and D together and average number of post graduate employees, in countries F, G and H together?, A-294 (b) 282 (c) 284 (d) 280 (e) 200, Q55. Which country has the 2nd highest number of average employees per office?, (a) D (b) H (c) G (d) A (e) F, Answer, 51-c 52-c 53-d 54-a 55-e, Direction (56–60): Study the following table carefully to answer the questions that, follow:, Number of Orders cancelled by five different e-commerce companies in six different, years, Years, 2011, 2012, 2013, , P, 240, 420, 600, , DATA INTERPRETATION, , Q, 405, 600, 680, , R, 305, 470, 546, , S, 365, 446, 430, , T, 640, 258, 610, Page 12
Page 13 :
2014, 2015, 2016, , 160, 140, 290, , 208, 640, 363, , 708, 656, 880, , 550, 250, 195, , 586, 654, 483, , Q56. What was the difference between the highest number of Order cancelled by, Company-Q and the lowest number of Order cancelled by Company-T out of all, the six years?, (a) 325 (b) 422 (c) 596 (d) 416 (e) None of these, Q57.What was the approximate percentage increase in number of Order cancelled, by Company-S in the year 2014 as compared to previous year?, (a) 57 (b) 44 (c) 125 (d) 28 (e) 95, Q58. What was the average number of Order cancelled by the Companies P,R, S, and T in the year 2014?, (a) 405 (b) 551.5 (c) 501 (d) 488 (e) None of these, Q59.In 2016, 40% Order are cancelled by Company-R due to bad weather and, others by packaging fault. How many orders are cancelled by Company-R due to, packaging fault?, (a) 548 (b) 468 (c) 568 (d) 528 (e) None of these, Q60.What is the approximate percentage of cancelled Order by Companies P and, R in 2013 as compared to cancelled orders by Company-S in 2011?, (a) 340 (b) 314 (c) 280 (d) 265 (e) 384, Answer, 56-b 57-d 58-c 59-d 60-b, Directions (61-65): The table given below shows the monthly salary of six, employees working in a leading manufacturing firm, Years→, Employe, es↓, Richali, Piyush, Ritesh, Aditi, Krishna, Raksha, , 2011, , 2012, , 2013, , 2014, , 2015, , 2016, , 19200, 28500, 22600, 23000, 24800, 31500, , 20500, 30100, 24000, 24500, 26000, 35800, , 23400, 31800, 26400, 26100, 27900, 36600, , 25000, 33000, 28100, 27000, 29100, 40200, , 26600, 34900, 29800, 29300, 30800, 44000, , 28200, 36000, 31000, 31200, 33000, 45800, , Q61. What is the difference between average monthly income of Aditi all over the, years and monthly income of Raksha in 2015?, (a) Rs. 17250 (b) Rs. 18150 (c) Rs. 17510 (d) Rs. 17150 (e) None of these, Q62. Monthly salary of Ritesh in 2016 contributes for what percent in total, monthly salary of Richali, Piyush and Krishna together in 2016? (approximately), DATA INTERPRETATION, , Page 13
Page 14 :
(a) 30% (b) 32% (c) 38% (d) 42% (e) 28%, Q63. Find the ratio of annual salary of Aditi in 2012 and Raksha in 2014 together, to that of Piyush in 2013 and Richali in 2011 together?, (a) 6 :7 (b) 7 : 6 (c) 5 : 4 (d) 3 : 2 (e) None of these, Q64. Monthly salary of Piyush and Krishna together in 2013 is by what percent, more or less than that of Aditi and Raksha together in 2015? (approximately), (a) 19% more (b) 16% less (c) 19% less (d) 16% more (e) 29% less, Q65. In 2015, Raksha donated 5% of her monthly salary, she then lent out 20% of, remaining salary on CI at 5% for 3 years. Find the interest (approx.) earned by her, after 3 years?, (a) Rs. 1381 (b) Rs. 1318 (c) Rs. 1418 (d) Rs. 1315 (e) Rs. 1300, Answer, 61-D 62-B 63- E 64-C 65-B, Directions (66-70): The table below shows production of five types of Trucks by a, company in the years 2009 to 2014. Study the table and answer questions., Production of trucks by a company, Year →, Type ↓, Minivan, Pickup, Canopy, Panel, Cab, Total, , 2009, , 2010, , 2011, , 2012, , 2013, , 2014, , Total, , 8, 16, 21, 4, 25, 74, , 20, 10, 17, 6, 18, 71, , 16, 14, 16, 10, 19, 75, , 17, 12, 15, 16, 30, 90, , 21, 12, 13, 20, 14, 80, , 6, 14, 8, 31, 27, 86, , 88, 18, 90, 87, 133, 476, , Q66. In which year the production of trucks of all types taken together was, approximately equal to the average of the total production during the period?, (a) 2009 (b) 2011 (c) 2013 (d) 2014 (e) None of these, Q67. In which year, the total production of trucks of types of Minivan and Pickup, together was equal to the total production of trucks of types Canopy and Panel, together., (a) 2010 (b) 2011 (c) 2014 (d) 2013 (e) None of these, Q68. During the period 2009-14, in which type of trucks was a continuous increase, in production?, (a) Minivan (b) Pickup (c) Canopy (d) Panel (e) None of these, Q69. The production of which type of trucks was 25% of the total production of all, types of trucks during 2013?, (a)Panel (b) Canopy (c) Pickup (d)Minivan (e) None of these, DATA INTERPRETATION, , Page 14
Page 15 :
Q70. The per cent increase in total production of all types of trucks in 2012 to that, in 2011 was?, (a) 15 (b) 20 (c) 25 (d) 30 (e) None of these, Answer, 66-c 67-d 68-d 69-a 70-b, Directions (71-75): Study the following table carefully and answer the questions, given below:, Number of Cars (in thousands) of different Models and colours sold in two Metro, Cities in a year, Type, , Metro M, Colour, Red, Blue, , Black, A, B, C, D, E, F, , 40, 20, 35, 45, 50, 55, , 25, 35, 30, 40, 35, 42, , Whit, e, 55, 60, 50, 45, 35, 40, , Metro H, , Colour, Silver Black Red, 75, 80, 90, 85, 60, 65, , 15, 20, 35, 40, 30, 52, , 45, 30, 40, 35, 50, 47, , 32, 37, 42, 39, 44, 34, , Blue, 40, 39, 41, 37, 43, 45, , Whit, e, 60, 81, 6, 90, 77, 87, , Silver, 20, 35, 37, 42, 22, 17, , Q71.The difference between the white-coloured cars sold in the two metros of, which of the following models is the minimum?, (a) A (b) C (c) D (d) F (e) None of these, Q72. The total number of blue-coloured cars of Model E and D sold in metro H is, exactly equal to the number of white-coloured cars of which model in Metro M?, (a) B (b) F (c) C (d) A (e)E, Q73. What is the difference between the number of blue-colours cars of model ‘C’, sold in Metro M and number of red-colour cars of Model ‘F’ sold in Metro H?, (a) 8,000 (b) 10,000 (c) 12,000 (d) 15,000 (e) None of these, Q74. The total number of silver-coloured cars sold in Metro H is approximately, what percentage of that in Metro M?, (a) 130 (b) 140 (c) 90 (d) 100 (e) 110, Q75. In metro M the number of cars sold was maximum for which of thecolourmodel combinations?, (a) White-C (b) Blue-B (c) Silver-B (d) White-D (e) Silver-F, Answer, 71E 72 .A 73;E, DATA INTERPRETATION, , 74,C 75 A, Page 15
Page 16 :
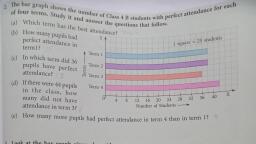
Direction(76-80) study the following table which show the number of student, appeared and passed in different streams in university and answer the questions, , 76-Approx what percent of student appeared in medical, passed in 2003?, A 75% b-85% C- 78% D- 88%, 77-Approx what percent of total student appearing in 2004 , appeared in commerce, stream, A-53.3% b-64.4% C-52.5% d-59.3%, 78-The number of student appeared in all stream was minimum in the year, A-2002 B-2003 C-2004 D- 2006, 79-The number of student passing in all stream was maximum in the year, A-2001 b-2005 C-2006 D-2004, 80-what percentage of student passed in engineering in 2005?, Ans-89.67%, Answer, 76 b 77 d 78 c 79b, Directions for questions (81 -85): Go through the data set given below and, solve the questions based on it., Following bar chart provides the percentage of Adult Males, Adult Females and, Children out of total, population in five colonies A, B, C, D and E:, , DATA INTERPRETATION, , Page 16
Page 17 :
Total number of resdence, Colonies, Residents, A, 1250, B, 2050, C, 1800, D, 1150, E, 1620, , Q81. What is the total number of adult females in colonies A, B and C together?, a) 1785 b) 1821 c) 1479 d) 1692, e) None of The Above, Q82. The number of children in colony A are approximately what percent of the, number of children in colony E?, a) 121 b) 116 c) 75 d) 101 e) 98, Q83. What is the respective ratio of the number of adult males to the number of, adult females in colony B?, a) 3:5 b) 7:5 c) 8:7 d) 5:7 e) None of The Above, Q84. What is the average number of residents from all the colonies together?, a) 1654, b) 1600 c) 1580, d) 1574, e) None of The Above, Q85. What is the difference between the number of adult males and the number of, children in colony D?, a) 138 b) 126 c) 136 d) 135 e) None of The Above, Answer, 81 B, 82B, 83A 84D 85A, Directions (86-90): Study the following bar graph carefully to answer the, DATA INTERPRETATION, , Page 17
Page 18 :
questions., Five students namely Param, Qartar, Rasheed, Sultan and Tango are termed as P,, Q, R, S and T., Marks obtained by them in Physics and Chemistry :-, , Q 86. Marks obtained by Sultan in Chemistry is what percent of the total marks, obtained by all the students in Chemistry?, a) 26, b) 28.5, c) 35, d) 31.5, e) 22, Q 87. If the marks obtained by Tango in Physics were increased by 14% of the, original marks, what would be his new approximate percentage in Physics if the, maximum marks in Physics were 140?, a) 57 b) 32, c) 38 d) 48, e) 41, Q 88. Fill in the blank space in order to make the sentence correct as per the given, information. Total marks obtained by Tango in both the subjects together is more, than the marks obtained by, a) Qartar in Chemistry, b) Rasheed in Physics, c) Sultan in Chemistry, d) Param in Physics, e) Rasheed in both the subjects together, Q 89. What is the respective ratio between the total marks obtained by Param in, Physics and Chemistry together to the total marks obtained by Tango in Physics, and Chemistry together?, a) 3 : 2, b) 20 : 11, c) 5 : 3 d) 2 : 1 e) None of these, Q 90. What is the respective ratio between the total marks obtained by Qartar and, Sultan together in Chemistry to the total marks obtained by Param and Rasheed, together in Physics?, DATA INTERPRETATION, , Page 18
Page 19 :
a) 23 : 25, , b) 23 : 21, , c) 17 : 19 d) 17 : 23 e) None of these, , Answer, 86A 87 E 88B 89D 90 B, Directions (Q. 91-95): Study the given bar graph and pie chart to answer the, following questions., The bar graph shows the production (in thousand tones) of Wheat, Rice and Maize, in different states., , The pie-, , chart shows the percentage of agricultural land in the given six states., Productivity = Total production / Area of agricultural land, , 91) The productivity of which state is the maximum?, a) Bihar, b) Haryana, c) Punjab, d) UP, e) MP, DATA INTERPRETATION, , Page 19
Page 20 :
92) The production of which state is the maximum?, a) Bihar, b) MP, c) Haryana d) UP e) Punjab, 93) The production of wheat in Punjab is what percent more than the production of, Maize in Odisha?, a) 350% b) 250% c) 300%d) 200% e) 400%, 94) What is the ratio of the production of Rice in Bihar to the production of Wheat, in Haryana?, a) 2 : 3 b) 3 : 2 c) 2 : 1d) 1 : 1 e) 1 : 2, 95) If MP exports 40% of Rice at the rate of Rs.30 per kg and UP exports 30% of, Rice at the rate of Rs.32 per kg, then what is the ratio of the incomes from the, exports?, a) 65 : 48 b) 31 : 42 c) 43 : 54d) 57 : 62 e) 1 : 2, Answer, 91-B 92- E 93- C 94- D 95 A, Directions: Study the given bar-chart carefully and answer the following, questions., The graph shows the number of villages in fouir different states where, electrification was done in different years, , 91) The number of villages in Nagaland where electrification was done in 2013 is, what percentage of the number of villages in Tripura where electrification was, done in 2014?, DATA INTERPRETATION, , Page 20
Page 21 :
a) 55.5% b) 44.4% c) 77.7% d) 66.6%, e) 33.3%, 92) What is the ratio of the villages in Assam to those in Manipur where, electrification was done in 2013?, a) 1 : 4, b) 3 : 4, c) 1 : 2 d) 4 : 5 e) 3 : 2, 93) In which state was the electrification work done in maximum villages during, the given three years?, a) Assam b) Manipur c) Manipur and Tripura, d) Nagaland, e) Manipur and Assam, 94) If the cost of electrification of a village is Rs.75 lakh then what is the cost of, electrification in four, states during the given period?, a) Rs.4319000000 b) Rs.3825000000, c) Rs.4143000000, d) Rs.355700000, e) Rs.2721000000, 95) In which year was the electrification work done in maximum number of, villages?, a) 2012 b) 2013 c) 2014, d) 2013 and 2012, e) 2012 and 2014, Answer, 91E, , 92D, , 93C, , 94B, , 95A, , Direction(96-100) the following bar chart shows the sales of company XYZ( in, crore) study the chart and answer the following, , 96-total sales in 2nd and 3rd year together?, A-2688cr B-2888Cr C- 2788 cr D-2488Cr, 97- the second highest sale in the year, A10 B 9 C- 8 D-7, DATA INTERPRETATION, , Page 21
Page 22 :
98-The second least sale in the year?, A-2 B-3 C-6 D-4, 99-the mean of the highest and lowest sale (in cr) is;, A4922.5 B-4827 C-4365 D-4922, 100-the sale in the year $ is less than the sale in the year, A-3608 Cr B-3504 Cr c-3127Cr D -3427Cr, answer, 96-B,97-A,98-B.99-B,100-B, Directions(101-105) a watch company produce four different watches the sale of, those product in lakh during 2005-2010, 101-the sale in the percentage of wrist waches in 2010 more vthan the sales of, table clock in 2010 was nearly by, A-26.67% b-27.7% C-28.7% D-21.7%, 102-the ratio of sales of stop watch in 2010 to the sales of table clock in2005?, A6:19 B-7;6 C-19:6 D-7:19, 103- the sales of table clock in2005 is less than the sales of wall clock in2005 in, nearly by, A-70.55% B- 69.05% C-68.05% D-62.05, , production in lakh, , Chart Title, 35, 30, 25, 20, 15, 10, 5, 0, , wrist watch, , table clock, , stop watch, , wall clock, , 2005, , 21.3, , 9.5, , 5.5, , 30.7, , 2010, , 28.7, , 22.3, , 3.5, , 32.7, , 104-during the period of 2005-10 ihe minimum rate of increase in the sales is in, the product of, A wrist watch B-table cock C-stop watch D- wall colck, 105-The sales have incr. by nearly 135% from 2005-10 in the product of, A-table clock B-wrist watch C-stop watch D-wall clock, Answer, DATA INTERPRETATION, , Page 22
Page 23 :
101-C, 102-D,103-B,104-D,105-A, , sales in (thausand numbers), , Direction(106-110)-sales of books in sux branches of publishing company in 20002001, 120, 100, 80, 60, , 2000, , 40, , 2001, , 20, 0, B1, , B2, , B3, , B4, , B5, , B6, , Branches, , 106-Total sales of branch B1 ,B3 and B5 together for both the years(in thausand) is, A-250 b-310 c-435, D-560, 107-find the ratio of total sales of branch B2 for both year of total sale of branch, B4 for both year:?, A-2;3 b-3;5 C-4:5 D-7:9, 108-the average sale of branch B1, B3and B6 in 2000 is what percent of the, average of beanch B1,B2 and B3 in 2001?, a-87.5 b-75 c-77.5, d-82.5, 109-find the percentage increase in the sales of bookof Branch B3 in the year2001, than branch B2?, A-62.9 B-50.8 C-40.9 D-65.7, 110-total sales of branches B2,B4and B6 in both year?, a-530 B-512 C-523 D- none, answer, 106-D, 107-D, 108-A,109-A,110-A, Directon(111-114)Study the following table carefully and answern the given, questios, , DATA INTERPRETATION, , Page 23
Page 24 :
• Strike rate =( total runs scored/total balls faced)X100, • All the given batsman could bat in all the given matches played by them, • Few value are missing in the table “_” a candidate expected to calculate the, missing data if it is required in amswer of given question on the basis of, given data, 111- If the runs scored by R in last 3 matches of the tournament are not considered, his avg. runs scored in the tournament will decrease by9 if the runs scored by R in, the 21st and 22nd match are below 140 and no two scores are equal, what is the, minimum possible runs scored by R in 24th match?, A-65 b-85 c-70 D-60 E-75, 112- respective ratio b/w total num of balls faced byOand that byQ in the, tournament is 5:3 total number of runs scored byQ in the tournament iswhat, percent less than the total number of runs scored byQ in the tournament?, A-21.27% B-25.81% C-29.09% D-27.45% E23.63%, 113-Batsman M faced equal no of balls in the first 11 matches he played in the, tournament and last 11 matches he played in the tournament. If his strike rate in, first 11 match are 83 and last 11 match 71 . what is the total no. of balls faced by, him in tournament?, A1800 B-1500 c-1700 D-1600 E-1400, 114- in the tournament, the total no. of ball faced by the batsman N is 402 less, than the total no. of runs scored by him. What is the average of runs scored by, batsman N in the tournament?, a-32 B54 C-84 D-62 E-71, DATA INTERPRETATION, , Page 24
Page 25 :
Answer, 111-B 112-C 113-E 114-C, Direction (115-119): Study the following information and answer the related, questions., P, Q, R, S, T, A, B, C, D and E are employees of a company. A table shows the, average age of any two employees of the company. The average age of A and B is, 27.5, , i.e. average age of A & P is given as (A+P)/2=39.5, 115. What is the age of T?, A. 27 B. 29 C. 33 D. 39, E. None of these, 116. What is the average age of D, R and S?, A. 25 B. 31 C. 32, D. 35.6, E. None of these, 117. What is the ratio of ages of Q and E?, A. 46: 43 B. 43: 46, C. 23: 25 D. 25: 23 E. None of these, 118. What will be the average of sum of ages of A, B, C, D and E together after, five years?, A. 39.8 B. 40, C. 42.6 D. 45.5 E. None of these, 119. If age of P and Q is decreased by 50% and age of A and B is increased by, 20%, what will be the ratio of ages of P, Q, R, S and T together to the ages of A, B,, C, D and E together?, A. 51: 50 B. 50: 51, C. 199: 133 D. 133: 199, E. None of these, ANSWER, 115-B 116-E 117-A 118-C 119-D, Directions (120-124): The following table shows number of students who applied, for the various posts for RRB India having different qualifications. Study the table, carefully and answer the questions that follow., DATA INTERPRETATION, , Page 25
Page 26 :
Note: In table some data are missing. Find the missing data first if it is required in, any question and then proceed, , Note: No. of students having different qualifications is independent from each-other, Don’t treat any student may have more than one qualification unless it is not mentioned in, questions., , Q120. If only 10th pass students are eligible for group-D exam then total number, of students who applied for group-D exam from Bihar is what percent of total, number of students who have qualification of degree from MP and Jharkhand, together? It is given that total number of students from Bihar who applied for, various posts in RRB is 95,500., (a) 13.92% (b) 26.92% (c) 24.92% (d) 22.92% (e) 23%, Q121. If only degree holders are eligible for ALP post then find the average, number of students who have applied for ALP post from all the states together., (a) 26,750 (b) 28,450 (c) 27,850 (d) 28,750 (e) 27,580, Q122. According to RRB, only those candidates who have qualification of both ITI, & higher qualification can apply for the post of Technician then find the total, number of students who has applied for the post of Technician from all the states, together. It is given that the number of students who have (ITI + Diploma), qualification from Assam is 45% of number of students from Bihar having same, qualifications as that of students from Assam., (a) 90,400 (b) 87,500(c) 95,400 (d) Can’t be determined (e) 1,30,200, Q123. If number of students having (10th + ITI) qualification from MP is 25%, more than that from Assam having same qualification then total number of, students having (10th + ITI) from these two states is what percent of total number, of students having (10th + ITI) from all the six states together? It is given that total, number of students from Assam having (10th + ITI) qualification is 10,000, (a) 28.21% (b) 22.27% (c) 26.27% (d) 22.37% (e) 28.37%, Q124. If total number of students having 12th qualification from UP is 100% more, than that from Gujrat and Jharkhand together having same qualification, then what, is the total number of students having 12th qualification from U.P. It is given that, the ratio of number of students from Gujrat and Jharkhand having 12th, qualification is 8 : 7 and total number of students having 12th qualification from all, the states is 85,700., DATA INTERPRETATION, , Page 26
Page 27 :
(a) 36,000 (b) 45,000 (c) 24,000 (d) 54,000 (e) 32,000, Directions (125-129): Study the following table carefully and answer the given, questions, Mobile, Cost, Selling, % of, Profit, Price, Price, Profit, Samsung 35,000, ------3,500, Apple, 53,000, ---14%, ---Micromx ---22,000, ------LG, 28,000, ---------HTC, ---33,000, 10%, ---Sony, , 32,000, , ----, , ----, , 4,000, , 125. What is the selling price and % of Profit of Sony Mobile ?, A.36,000 and 12.5% B.36,00 and 15% C.36,000 and 18% D-36,000 and 20%, E.36,000 and 23%, 126. What is the % of Profit Micromax, If Cost Price of Micromax is 3/5 of Cost, Price of HTC mobile ?, A.33 1/3% B.26 4/9%, C.22 2/9%, D.24 5/9%, E25 7/9%, 127. What is the selling price and % of profit of LG mobile?. If profit is 5oo more, than the profit of Samsung mobile ., A.32,000 and 14 1/7%, B.34,000 and 14 4/7%, C.32,000 and 15 2/7%, D.34,000 and 17 5/7%, E2,000 and 14 2/7%, 128. What is the profit earned on Apple mobile ?, A.7360 B.7450, C.7420, D.7560, E.7620, 129. What is the ratio between Cost Price and Selling price of Samsung ?, A.14:15, B.10:13, C.10:14, D.14:15, E.10:11, Answer, 125A 126 C 127 E 128C 129E, DIRECTION(130-134) Answer the questions based on the information given, below:, The following line graph shows revenue and expenditure of a company A for 5, year (in Lakhs):, , DATA INTERPRETATION, , Page 27
Page 28 :
130. What is the average revenue of the company over the years?, A. 1000 lakhs B. 1010 lakhs C. 1050 lakhs D. 2020 lakhs E. None of these, 131. What is the difference between revenue and expenditure of company A over, the year?, A. 350 lakhs B. 250 lakhs C. 200 lakhs, D. 300 lakhs E. None of these, 132. What is the average expenditure of the company A over the years?, A. 940 lakhs B. 900 lakhs C. 1000 lakhs D. 1010 lakhs E. None of these, 133. What is the ratio of sum of expenditure in the year 2012 and 2013 to that of, revenue in year 2014?, A. 21: 25, B. 25: 21 C. 30: 37, D. 37: 30 E. None of these, 134. In which year was the profit percentage highest?, [𝑟𝑒𝑣𝑒𝑛𝑢𝑒−𝑒𝑥𝑝𝑒𝑛𝑑𝑖𝑡𝑢𝑟𝑒], Given that: Profit =, X100, 𝑒𝑥𝑝𝑒𝑛𝑑𝑖𝑡𝑢𝑟𝑒, , A. 2011, B. 2012 C. 2013, D. 2014, Answer, 130-B 131-A 132-A 133-D 134-C, , E. 2010, , Directions (135-139): Study the following line graph carefully and answer the, questions given below:, 𝑖𝑛𝑐𝑜𝑚𝑒 − 𝑒𝑥𝑝𝑒𝑛𝑑𝑖𝑡𝑢𝑟𝑒, 𝑝𝑟𝑜𝑓𝑖𝑡% = [, ] × 100, 𝑒𝑥𝑝𝑒𝑛𝑑𝑖𝑡𝑢𝑟𝑒, , DATA INTERPRETATION, , Page 28
Page 29 :
135. The percentage increase or decrease in the income of company C₂ is highest, in which of the following years?, A. 2013 B 2012 C 2011 D. 2009 E 2010, 136. If the expenditure of company C₁ in the year2009 was Rs. 2.25 lakh, then, what was the profit percentage of C₁ in that year?, A. 124% B 112% C 122% D 108%, E 118%, 137. If the profit percentage of company C₂ in the year 2011 is 20%, what was its, expenditure in that year? (in Rs, lakh), A 5.83, B 4.58 C 4.12, D 6.83 E 3.45, 138. What is the average income of company C₃ over all the years? (in Rs. lakh), A 4.63, B 3.83, C 4.83, D 4.23 E 4.18, 139. What was the approximate percentage increase in the income of company C₁, in the year 2010 as compared with the year 2008?, A. 40%, B 36%, C 32.5% D 34.75%, E 31%, Answer, 135-C 136-C 137-A 138-C 139-A, Direction (140-144): Study the bar graph and line graph carefully to answer the, questions given below., , DATA INTERPRETATION, , Page 29
Page 30 :
line graph shows the number of males and females (in thousand) in town Y during, the given year, , 140. What is the ratio of the average number of males in town X to the average of, males in town Y for the given period?, A 269:282 B 265:281 C 265:283 D. 265:282 E. Other than the given options, DATA INTERPRETATION, , Page 30
Page 31 :
141. In which of the following years, is the percentage increase or decrease in the, number of females for town Y the minimum?, A. 2015 B 2014, C 2012, D 2013, E Both 1) and 2), 142. The population o town X in 2011 and 2012 together is approximately what, per cent of the population of town Y in 2014 and 2015 together?, A. Other than the given options B 81.6% C 89.6% D 84.5% E 86.6%, 143. Find the number of years in which the number if females in town X and Y are, less their respective average numbers., A. One, Two, B Two, Two, C None, D Three, Two, E Other than the given options, 144. In which of the following pairs of years in the difference in the number of, males and females the maximum for town Y and minimum for town Y and, minimum for town X respectively?, A. 2011 and 2014, B 2015 and 2011 C 2015 and 2014 D 2013 and 2015, E Other than the given options, Answer, 140-D 141-A 142-E 143-B 144-C, Direction(145-147) study the radar graph carefully and answer the questions, follows, , monthly salary(in thausand)of 5 different, person in 3 different year, , poonam, , sumit, 30, 25, 20, 15, 10, 5, 0, , anil, , 2010, 2009, 2008, , arvind, , jyoti, , 145-what is the average monthly salary of sumit in the year 2008,Anil in the, year2009and jyoti in the year 2010 together?, A-20000 B-30000 C-40000 D-50000, DATA INTERPRETATION, , Page 31
Page 32 :
146-total monthly salary of arvind in all the years together was what percent of the, total monthly salary of all the five persons together in the year2008?, a-60% B-15.64% C-45% D-46%, 147-what is the percent decrease in monthly salary of poonam in the year 2009 as, compared to her monthly salary in previous year?, A-15% B-63% c-45% D-20%, Answer, 145- A, 146- A, 147- D, Directions(148-152)study the Radar graph carefully and answer the following, question, Number of student in thousand in two different universities in six different, year, , year2012, , year2007, 35, 30, 25, 20, 15, 10, 5, 0, , year2011, , year2008, university 1, , university2, year2009, , year2010, , 148-what was the difference between the number of students in university 1 in the, year 2010 and the number of students in university 2 in year 2012 together?, A-0 B-5000 C-15000 D-10000 E-1000, 149-what is the sum of the number of students in university 1 in the year 2007 and, the number of student in university 2 in the year 2011 together?, A-50000 B-55000, C-45000 D-57000 E-40000, 150- if the 25% of the students in university 2 in the year 2010 were females , what, was the number of male students in the University in the same year?, A-11250 B-12350, C-12500 D-11500 E-11750, 151-What was the percent increase in the number of student in University 1in the, year 2011 as compare to the previous year?, A-135 B-15 C-115, D-25, E-35, DATA INTERPRETATION, , Page 32
Page 33 :
152-IN which year was the Difference between the number of students in, university 1 and the number of students in university 2 highest?, A-2008 B-2009 C-2010, D-2011, E-2012, ANSWER, 148- A 149- E, , 150- A, , 151-D, , 152- E, , Space For ruff work, Spacessss, , DATA INTERPRETATION, , Page 33
 Learn better on this topic