Notes of M.Com I, Eco.for Business Decision D and S analysis.pdf - Study Material
Page 1 :
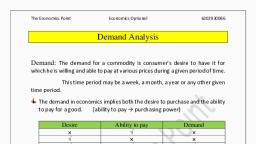
Demand and Supply Analysis ran 39, , , , Beye, RBRRAARAEAREAEESS, , porbatetelebet nD nn an) a) nD nd nd nd nd a) nD ad nd a) ca) nd nd a) dn) a) a) ad a) a) ta) td ct} ed p, , DEMAND AND, SUPPLY ANALYSIS, , r ao) a) sa} a) a} a) a?, 7, 1, X, , , , , , e@ Determinants of demand - market demand function - theory of attributes, snob appeal, band wagon and Veblen effect and demand function. Law of, supply - elasticity of supply, , e@ Applications of elasticity of demand and supply to economic issues : Paradox, of bumper harvest - tax on price and quantity - minimum floor and, maximum ceilings : minimum wages controversy and Administered price, control, , @ The theory of consumer choice - Consumer preference and budget constraint, , — equilibrium position of tangency with the help of Indifference curve analysis, , - effect of changes in price and income on consumer equilibrium, , CONCEPT OF DEMAND, , In economics, demand for a commodity does not simply mean desire or need, or want. In addition to these the consumer must be willing and able to pay the, price. e.g. a person may indicate his desire to have chocolates. Another person, may be needing shoes. Yet another person wants to go to the Essel World; but, unless and until they possess the required amount of money and also the, willingness to spend it they will not be able to generate demand for all these, things. In that case desire will just remain a desire; the need too will not be, fulfilled and the want will not take the shape of demand. It is only when the, desire for anything is backed by ability and willingness to pay for that thing, that it flows out in the form of effective demand i.e. the person who desires to, have chocolates will be able to generate demand for it if he also has the required, amount of money to pay for it along with the willingness to pay. He must,, therefore, have adequate purchasing power and the readiness to part with money, in exchange for the good that he desires to have., , Thus, demand in Economics should have the lowing characteristics :, , A. Desire to have a particular commodity., , B. Ability to purchase that commodity. Obviously the ability to buy or, purchasing power will depend on two factors :, a) The disposable money income of the consumer, and, , b) The price of the commodity., C. Willingness to spend the disposable money income. i.e., apart from, Possession of money, one should be willing to part with it for purchasing the, commodity at a given price. Thus, a miser's desire, however rich he may be, will, not emerge as effective demand if he is not willing to part with his money.
Page 2 :
pan Peceesorne = MCV (Row i 4, a, Paneer be vane sided by the two buyers, , . cabal na resnen ton conse for © Cle eked, al price oft ‘ eee ee, , Thus. economic sense, deme, , ability and willingness to pay for Ht, , Desire to have + Ability te wy, , he demand for anything, , : {me at that price, , price of Kiet We, , , , L wittingnest (0 PAY, a given price, #8 the ary, Oe evs, the demand |, , , , , , , Ct which s eh pes unit pen gity which the buyers, ur amounts of (hal OMT ied period of time Quantity Market, Pat any given prince during 20rne AP Demanded Demanded Demand, y of the ies aye of by A (Bea), , son of the var, , salar represental, , , , preanes a tab , =, acs et ted at He different possible prices at ANY gy, , , , , , , , , , 4 ,, : swiedge of demand for any commodity X, we shy :, « =< Se cereal purchase at various alterns, wx shouls conmider the list of prices on one Rent aot j, t different ‘, corresponding amount of quantity demanded of X, cther This ist. uote Marghall, “may be called his demand schedule ose ‘ :, mand schedule may be portrayed at an individual level as well as {, < schedule may be p Thus, the market demand schedule ss '4%lar tabon of the sum, —— = 7 , of demands of all the individuals for a commodity at corresponding level of, , prices at any given time. _/, , The iméiwidus! demand schedule represents the various amount o| THE DEMAND CURVE, , commodity X éemanéed by an individual at different possible prices at any, , On the basis of the demand schedule when we, given time, , ssader the case of an individual B who wants to consut: P pe 4 graph we get, the demand curve A demand fers t, , y X We then consider different possible prices of X at” perstion between peice aaa. eae et ad Se ear, , these alternative possible prices, put up correspondits [an be translated graphically ste ene poeeae, , » X which will be demanded by B. We shall obtain th: mass) Ctr <P, , , , , , , , , , price on the Y-axis and the quantity demar ce we have, ts! cemandé schedule as follows i, considered two types of demand schedule v 2 demand schedule, Table 2.1, , and the market demand schedule we can correspe, demand curve and the market demand curve, , , , Individual Demand Schedule, , the individual, , , , , , , , , , , , Price of Kin & Quantity of X demanded by B per day A+ Individual Demand Curve Ye, = Fe —_— If we plot points on the graph on the, + ee _ basis of individual demand schedule we 44. 5, ‘ 9 obtain the individual demand curve, ] 14 a (Refer Table 2.1.) seat t*, + — A single point on the demand curve, - 20 indicates a single price quantity relation 400 A, 34 7 €.g. point w indicates that if the pnce wo, were % 3/- quantity demanded would be +, 45 14 units, The demand curve is a 9, ¢ Likely that the undividual demand schedule d ,; diagrammatic representation of the °, © given set of prices due to diflerences in income eye, PETS" functional relationship between price y, aste 6 cons on » size of the fam! d the quantity demanded The |“ 2, The Market Demand Schedule mand curve slopes downwards from “Dd,, In order to derive the market demand left to right, indicating an inverse oF a Q) Nemee se, 4 deimand of all the beavers tan ghimand hedule we must consider the patie! Bekative relationship between price ant sce Wieeasin GX, t = a companodity for the givens 1 a nana ., given Gime The aggregate demand of et of prices at . reupectve Novel of pices wl enable oe « commodity quantity demanded het, schedule. ¢. Let us consider that there market dems”, particular good X when price of K ig tare’ Me (WO consumers Band A. Fol, 3 demands 6 units of X, and AIM Conn Hccwoanicn tow Hupinens Uxinnonis (Sem 1, , A demands 2 units of X
Page 3 :
iar, , , , bid es, B. Market Demand Curve, , The graphical representation of, the market demand schedule (Refer, Table 2.2) will enable us to derive the, market demand curve. We may first, draw the demand curves expressing, the price-quantity relationship of, individual buyers at varying prices., DA is the demand curve of individual, ‘A’ and DB is the demand curve of, individual buyer 'B’. Given DA and DB, we add them laterally to derive the, market demand curve (DA + DB). ¢.gwhen price of X is % 2/-, A demands, 10 units of X and B demands 20 units, of X., , Total Market demand for X will be, 10 units + 20 units = 30 units of X., , , , 3.00, , 2.00 =, Db:, , , , 100, oso!, © j0203040 3060 70, , to20 ‘Quantity Demanded of X, , pp PA+Du., , , , Fig. 2.2, , Thus, the market demand curve technically is the summation of all the, , individual demand curves., , According to Samuelson and Nordhaus; "The market demand curve is found, by adding together quantities demanded by all individuals at each price., , DETERMINANTS OF DEMAND, , The market demand for any commodity x depends on several factors whic, , are as follows, , i) The Price of Commodity X : The Market Demand for any commodity ':, primarily influenced by its price, Normally, at higher price, less of it is, demanded and at lower price more it will be demanded., , ii) The Price of Substitutes of X, , purchase some commodity X, they also try to find out the price, , : When the consumers go to the market, , substitutes of X and then take the decision to buy. If the nearest, substitutes are available at slightly lower price the consumer's demand, , for X will be affected adversely., , iii) Income of the Consumer : The average income of the consumer's 4!, important determinant of market demand. As people’s incomes ris?, individuals find to buy more of almost every thing, even if prices don, change. Automobile purchases have risen sharply because of higher leve!, , of income., , iv) The size of market measurable by the size of the population, Demand for any good also depends on the number ar ayers o, , consumers in the market., , v) The composition of the Consumers : Market demand for differe®, , products will depend not only on the size of the population but also t!, , composition of the population;, , groups, the age- wise and sex wise composition of population too afl, , , , such as lower, middle and upper incom, , , , the market demand for commodities., , vi) Utility of the commodity :, , demand. Utility is the mainspring of demand. D., , X arises because of its utility to, , Utility of commodity lies at the root ©, , }emand for an; dit?, the consumer. y comm, , Demand and Supply Analysis en 43, , vii) Quality of the commodity : Demand for any good is.also influenced by, the quality of that good. The better the quality of the good, the more will, be the demand for it., , viii) Taste and fashion : The taste of the consumer for a particular, commodity influences the extent of its demand. If a particular good is, favoured over the others then more of it will be demanded in the market., Similarly, when a new acceptable fashion comes to the market, it tickles, the consumer to demand a particular type of good, but if the thing goes, out of fashion then demand for it falls suddenly., , ix) Psychology of the consumers : Demand for a good depends also on the, psychological behaviour of the consumer. There is the possibility that as, more and more consumers possess a particular good, others are also, psychologically activated to buy that good. This is commonly called the, Bandwagon effect. On the other hand, some consumers display opposite, attitude. Just because others demand a particular good, they would not, like to demand that good. They may prefer to have something which is not, commonly demanded by others. This is called the Snob effect. They, simply will not buy what others are buying. These are inter-personal, psychological attitudes which also influence demand in the market., , Advertisements and Salesmanship : In modern markets the demand for, , a product can be created through appropriate advertisements and, , salesmanship. The best salesman is one who does not merely sell what, , buyers want but who makes the buyers buy what he has to sell. Thus,, advertisement, publicity and salesmanship are agencies which create, demand in the market., , xi) Special influence : Climate or seasonal variations or even festive, occasions will influence demand for different goods differently. The, demand for umbrella may be high in rainy seasons and demand for, woollen wears may be high in certain regions. Similarly demand for sugar,, fruit and sweetmeats may be high during festive seasons., , xii) Expectations about future prices : Our expectations regarding prices, that would prevail in the market in the near or distant future also affects, the demand for the product in the present., If the buyers anticipate, further rise in price of a commodity X in future then, depending upon the, nature of the food, they will buy more of it today., , THEORY OF ATTRIBUTES, , Attribution theory is concerned with how individuals interpret events and, how this relates to their thinking and behaviour. Heider (1958) was the first to, Propose a psychological theory of attribution, but Weiner and colleagues (e-g.,, Jones et al, 1972; Weiner, 1974, 1986) developed a theoretical framework that, has become a major research paradigm of social psychology. Attribution theory, assumes that people try to determine why people do what they do, i.e., attribute, causes to behaviour. A person seeking to understand why another person did, something may attribute one or more causes to that behaviour., , A three-stage process underlies an attribution :, , the person must perceive or observe the behaviour,, behavior was intentionally, , x), , , , a), b) then the person must believe that the, performed, and, , c) then the person m, forced to perform the, , ust determine if they believe the other person was, ¢ behaviour (in which case the cause is attributed to
Page 4 :
bes rs, , the situation) or not (in which case the, person)., , Weiner focused his attribution the’, , cause is attributed to the othe;, , on achiewe ee ertant factors, identified ability, effort, task difficulty, and luck as the mon ied. along three, affecting attributions for achievement. Attributions arf UA. he locus of, causal dimensions: locus of control, stability, and contril te ote otro The, control dimension has two poles: internal versus external Well 0 et, stability dimension captures whether causes change Ove! nd effort classified, instance, ability can be classified as a stable, internal cause, an’ ON tt, as unstable and internal. Controllability contrasts causes one C&P , Such, as skill/efficacy, from causes one cannot control, such, actions, and luck., , Illustration, , Attribution theory has been used to explain the difference in motvation, between high and low achievers. According to attribution theory, high achievers, will approach rather than avoid tasks related to succeeding because they believe, success is due to high ability and effort which they are confident of. Failure is, thought to be caused by bad luck or a poor exam, i.e. not their fault. Thus,, failure doesn't affect their self-esteem but success builds pride and confidence., On the other hand, low achievers avoid success-related chores because they tend, to (a) doubt their ability and/or (b) assume success is related to luck or to "who, you know” or to other factors beyond their control. Thus, even when successful, it, isn't as rewarding to the low achiever because he/she doesn't feel responsible,, ie., it doesn’t increase his/her pride and confidence., , Attribution in Statistics, , Generally statistics deals with quantitative data only. But in behavioural, sciences, one often deals with the variable which are not quantitatively, measurable. Literally an attribute means a quality on characteristic which are, not related to quantitative measurements. Examples of attributes are health,, honesty, blindness etc. They cannot be measured directly. The observer may find, the presence or absence of these attributes, Statistics of attributes based on, descriptive character., , Association of attribute is studied by the presence or absence of a particular, attribute. If only one attribute is studied, the population is divided into two, classes according to its presence or absence and such classification is termed as, division by dichotomy. If a class is divided into more than two scale-classes, such, classification is called manifold classification. Positive class which denotes the, presence of attribute is generally denoted by Roman letters generally A,B,....etc, and the negative class denoting the absence of the attribute noted, the Greek letters., , Conditions with Reference of Attributes, , An attribute requires the following conditions :, , , , , , as aptitude, mood, others’, , and it is denoted by, , i) The total number of objects of the same general class should be known, , ii) The characteristic should be readily A, an objective definition., , iii) The presence or absence of the attribut, examination of the objects or situations,, , iv) The number of objects which have the characteristic should be table, countable., , identifiable preferably as the basis of, , © should be determine by a, , Demand and Supply Analysis reo 45, , CLASSIFICATION OF ATTRIBUTION, |, , T, 4 \, , , , , , 7 at y +, [bicHotomy bs NOTATION | [COMBINATION] [Chass, , At es FREQUENCY, \ cLASSIIC {INOLOG) ArTRIBuTES |, , , , , , Classification of data relating to attributes is made on the basis of the, presence or absence of an attribute in the universe. Classification of data relating, to attributes can be done in following ways, , A. Dichotomy, , A classification of simple kind in which each class is divided into two sub, classes is called division by DICHOTOMY or TWO FOLD classification, B. Arbitrary or Vague Classification, , Classification does not necessary imply existence of a clearly defined, boundary between two classes. The division may be vague and uncertain. Such, type of a classification is called ARBITRARY or VAGUE classification., , Eg: Tall & Short, Sanity & Insanity., ©. Notation and Terminology, , ‘The capital letters A,B,C, are used to denote the presence of various, attributes and the Greek letters a, & Y are used to denote the absence of these, attributes., , ‘Thus (a) mean not (4),, (8) stands for not (B) and, (¥) denotes not (C)., "NOTATIONS & TERMINOLOGY, N, A, , PRESENCE OF ATTRIBUTE, , i, , ABSENCE OF ATTRI BUTE, , , , A= Literacy literacy, B= Smoking B= Non Smoking, C= Males Females, , , , D. Combination of Attributes, , Combination of attributes is denoted by grouping together of the letters, concerned e.g. AB is the combination of the attributes A & B. Thus if A stands for, literacy and B for smoking then the combination will be in following manner:, , AB = COMBINATION OF ATTRIBUTES OF Literacy and Smoking., , GB = Combination of attributes of ILLITERACY & SMOKING., , AB = Combination of attributes of LITERACY & NON SMOKING., , a B = Combination OF attributes of ILLITERACY & NON SMOKING, E. Class Frequency, , ‘The number of observations falling in each class is its class frequency and is, denoted by enclosing the corresponding class symbol in brackets like (A),, , (a), (B), (B), (AB), (4 8), (A B), (4 B) ete.
Page 5 :
——, , ee, , economics for Business Decisions — MLCOMm. (Ser, 4, , , , CLASS FREQUENCES, , (aA), (BB). (Cy), , (A) (AB), (ABC) fa), (a, er | Frequencies of, Frequencies of Rees Complementary, positive negati ‘events |, , Events. events, |, , , , CLASS FREQUENCY is further divided into three parts, A. Order Of Classes & Class-Frequencies, B. Total Number Of Class Frequencies, C. Ultimate Class Frequencies, Association of Attributes, , According to statistics two attributes A and B are associated only if they, appear together in a greater number of cases than is to be expected if they are, independent, , Eg : Two attributes A and B are associated, , ieiap) «AB, , , , , , ~ By, re. (AB) > BLIP) | positive association), 1) = B, Or (AB) < BLIP) Negative association), . (A) Bs, 1f (AB) = 48) then the two attributes A and B are independent., , SNOB APPEAL, , The snob effect is a phenomenon referring to the situation where the demand, for a certain good by individuals of a higher income level is inversely related to, the demand for the good by individuals of a lower income level. The “snob effect, contrasts most other microeconomic models, in that the demand curve can have, a positive slope, rather than the typical negatively sloped demand curve of normal, goods., The Snob effect refers to “the extent to whic!, , good is decreased owing to the fact that others are alse eee consumers, commodity (or that others are increasin,, This represents the desire of people to, themselves from the ‘common herd., , tn other words the Snob elfect refers to when a con;, particular product or service due to the fact, , with luxury goods that are considered status symbols; they are coyang Ue coe, they are scarce and exclusive. This effect is related to uniqueness weet eo,, posits that people have a desire to be moderately different f i eae em, that purchasing a unique product satisfies this need. It alge geet Peers on, Product is more unique and thus exclusive due to its limes mes that &, sopscity imited availability oF, , are also consuming the sam¢, g their consumption of that commodity), be exclusive; to be different; to dissociate, , sumer shies away from a, , ow:, 7 unusual, expensive or unique, , foods. These goods usually have & high economic value, Bit wee Bractcdl vali, ical value, ror 47, ‘The less of an item available, the higher its snob value. Examples of such items, , with general snob value are rare works of art, designer clothing, and sports cars., , In all these cases, one can debate whether they meet the snob value criterion,, which in itself may vary from person to person. A person may reasonably claim to, purchase a designer garment because of a certain threading technique, longevity,, and fabric. While this is true in some cases, the desired effect can often be, achieved by purchasing a less-expensive version from a reputable brand. Often, these high-end items end up as closcout items in discount stores or online, retailers where they may be offered at deep discounts from original price, bringing, into question the true value of the product. Ultimately, wealthy consumers can be, lured by superficial factors such as rarity, celebrity representation and brand, prestige,, , Collectors within a specific field can suffer from snob effect, searching for the, rarest and often most expensive collectibles. Such examples are classic, automobiles, stamps and coins., , Snob appeal refers to the qualities or attributes of a product that might, appeal to a consumer with "snobby" tastes. It may refer to the actual product, itself or the exclusivity the consumer could potentially experience as a result of, owning the product that is being advertised., , Understanding Snob Appeal, ‘The purpose of snob appeal is to persuade a consumer to purchase a product, , or service by convincing him or her that the purchase will elevate their status. By, , appealing to individuals’ desires to be among the elite, advertisers attempt to sell, their products., , Examples of Snob Appeal, , Some advertisements that illustrate snob appeal include the following:, , i) Cigarette ads with big and tough guys smoking cigarettes makes it seem, that the consumer, too, could be amongst the elite hearty men who smoke, cigarettes., , ii) Commercials that show men drinking a certain brand of beer attracting, all of the beautiful women in a bar gives the underlying message that, drinking that beer will make the consumer more attractive to women., , iii) A food commercial that highlights parents who are "Number One" that, purchase a certain food product implies that the consumer will also be a, top notch parent if he or she purchases the product., , iv) A perfume advertisement that features a woman dressed in fancy clothes, and very expensive jewelry appeals to the "inner snob" by implying that a, woman who wears that perfume will be equally as exquisite in, appearance., , A commercial for cat food that shows a cat eating a certain brand of food, , in a posh house with a fancy pet dish makes the consumer feel she is, , treating her cat the best she possibly can by purchasing that food., , vi) A military slogan that says, "Do you have what it takes?" is appealing to, snob appeal by trying to recruit members implying that they are an elite, group that has characteristics that others do not possess., , vii) When a company is attempting to sell its services over competitors’, services and states "You don't want to deal with those OTHER, companies...” it is attempting to elevate its own image to be more, appealing as an elite company., , Demand and Supply Analtysis
 Learn better on this topic